This 39-Day Midterm Window Has Delivered 100% Winners for Duke Energy (DUK)
Duke Energy is heading toward a historically strong 39-day midterm-year summer window just as the stock trades near its 52-week high and investors brace for a massive grid investment cycle and new rate decisions.
Price as of Jun 30, 2026: $126.58 (last close).
What is the seasonal pattern for Duke Energy (DUK)?
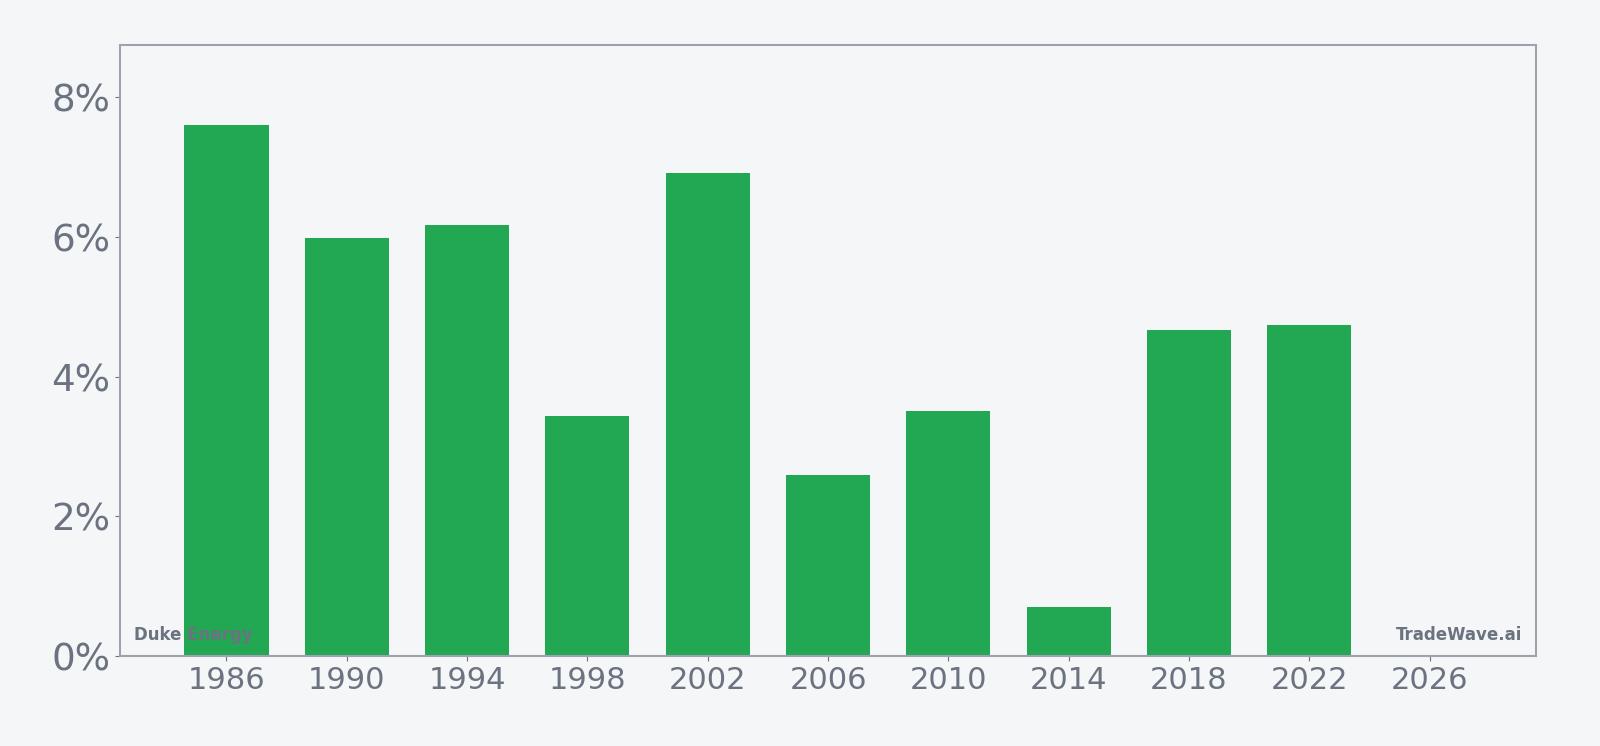
Duke Energy has risen in 10 of 10 midterm-year summer windows during this 39-day period, with an average gain of 4.63% in winning years.
- 10 for 10 in this window, with Duke Energy averaging 4.63% gains in winning years across the last 10 midterm election cycles.
- The upcoming 39-day window starts Jul 10 and has been a consistently bullish DUK seasonal trend in midterm election years.
- Percent Profitable is 100%, with 10 winners and 0 losers in the historical sample for this Duke Energy trading window.
- Average winner gains of 4.63% stack up to a 56% cumulative return across the 10 historical windows.
- The TradeWave Ratio of 2.48 signals that price has typically traveled meaningfully in the long direction within the window, even before final closes.
- Intraperiod swings have included sharp drawdowns in some years, so the historical seasonality comes with real downside volatility along the way.
According to historical data from TradeWave.ai, this midterm-year summer stretch has behaved very differently from an average month on the calendar for Duke Energy. The next section walks through how that pattern has played out and what it means for the upcoming 39-day window.
How has Duke Energy (DUK) traded in this midterm-year summer window?
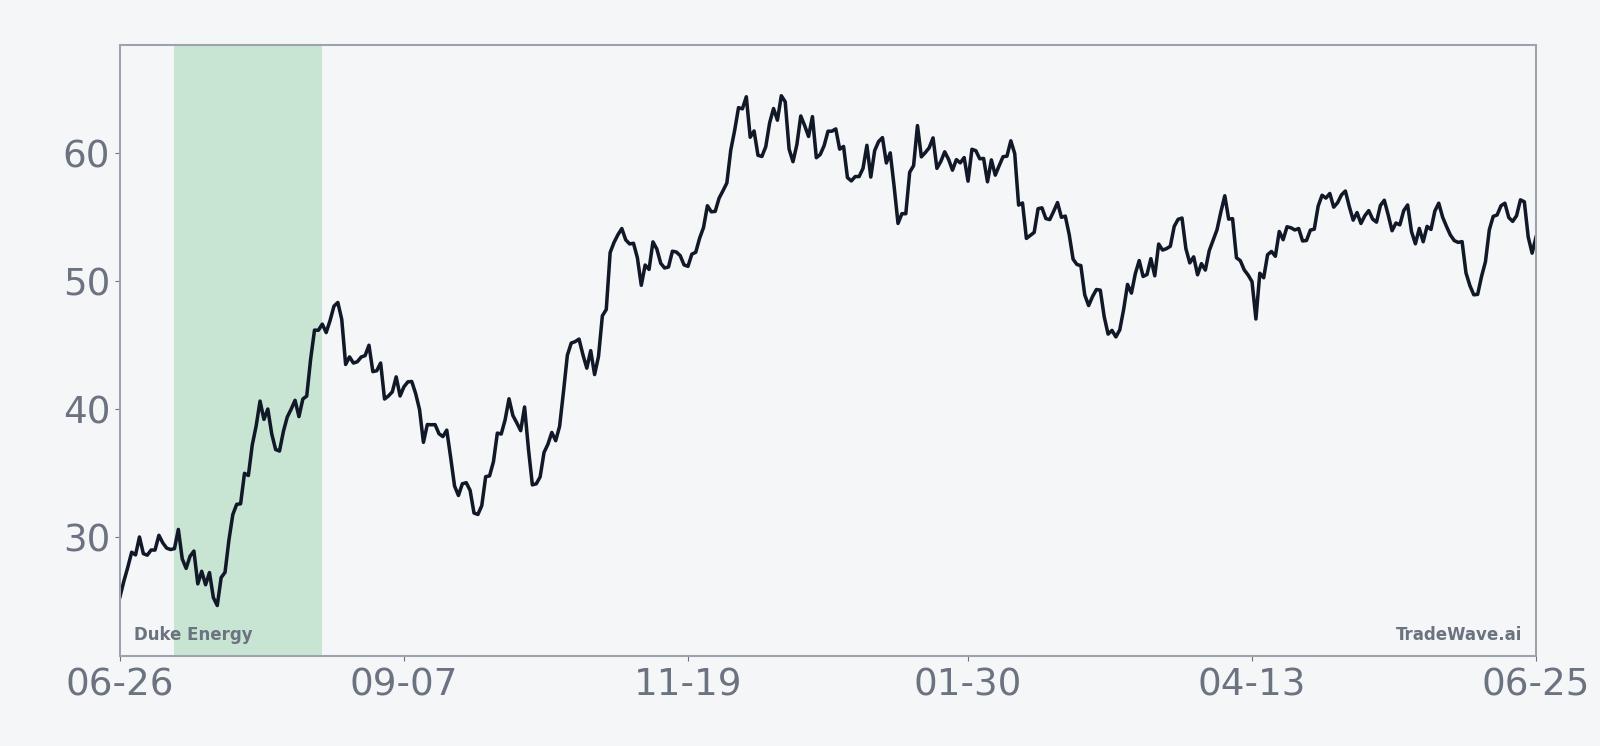
Duke Energy has posted gains in every one of the last 10 midterm election years during the 39 calendar days starting Jul 10, averaging a 4.63% rise per window. Today the stock closed at $126.58, down 1.4% on the day and sitting about 4.2% below its 52-week high of $132.20, after a strong run over the past month.
Grouping the data by the presidential election cycle matters here because utilities often feel policy and regulatory shifts most acutely in midterm years, when rate cases, infrastructure bills and climate rules tend to move. This pattern phase covers the last 10 midterm election years, while the calendar is currently in the midterm election year itself, so the upcoming window lines up directly with that policy-heavy part of the cycle.
This seasonal window begins on Jul 10 and spans 39 calendar days. Historically, during this period, Duke Energy has shown a strong bullish tendency in midterm election years, with a long trade direction and no losing years in the sample.
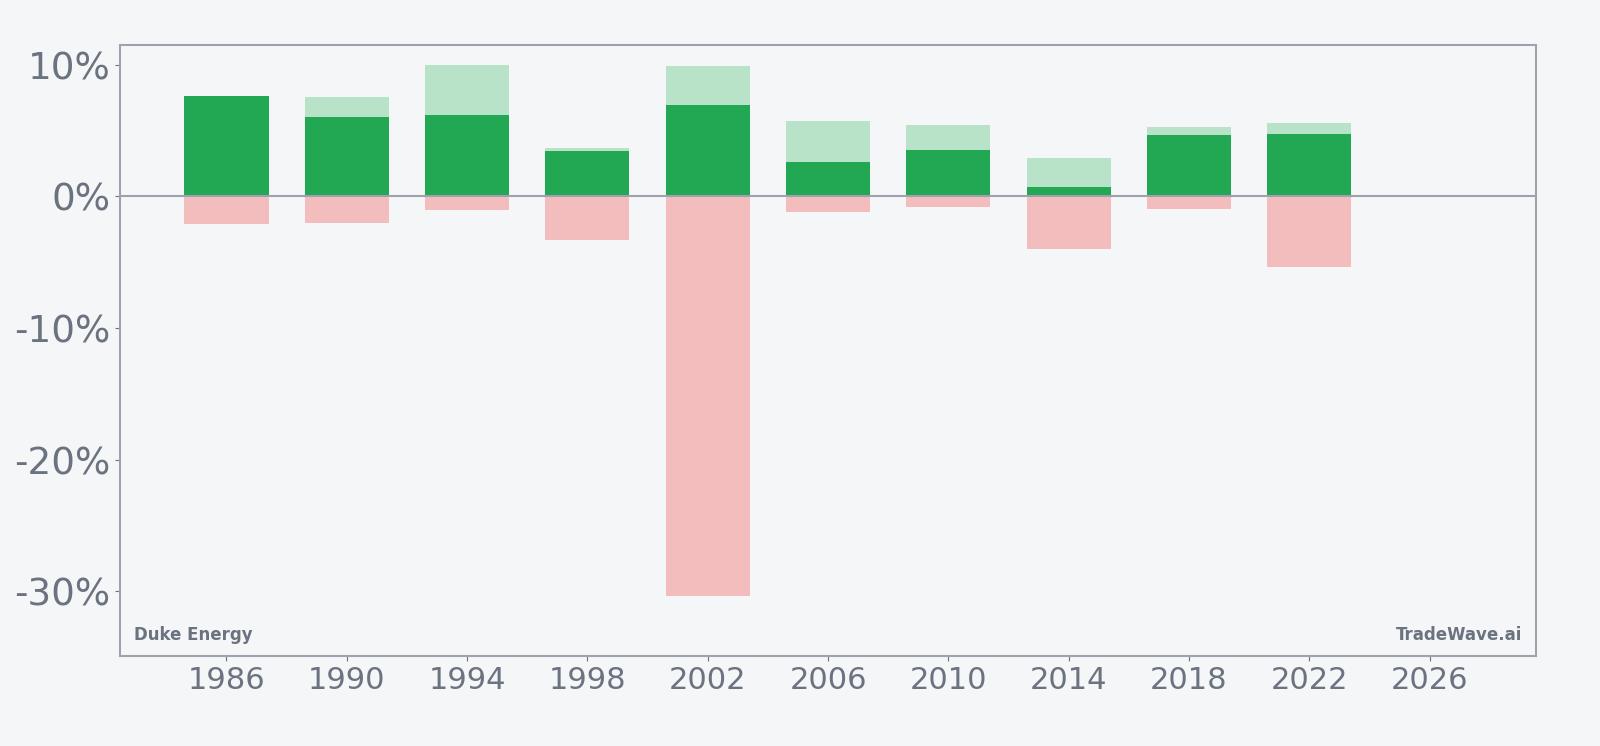
A second view layers in both the best and worst intraperiod swings for each year.
Across the 10 historical windows, the average profit of 4.63% and a 56% cumulative gain underline how consistently this slice of the calendar has favored long exposure. The long trade direction aligns with that record, and the Sharpe ratio of 1.99 points to a relatively strong risk-adjusted profile based on end-of-window outcomes.
The per-year table shows that even the weakest net result, a 0.71% gain in 2014, still finished positive, while stronger years such as 1994 and 2002 delivered net returns above 6%. In several cycles, including 1994 and 2002, the maximum favorable move inside the window reached roughly 10%, suggesting that when the pattern works, it can produce sizable rallies before the window closes.
Intraperiod downside has not been trivial. In 2002, for example, the worst drawdown from entry during the window was about 30.38% even though the trade ultimately finished up 6.91%. Other years saw more modest adverse excursions, often in the low single digits, but the range of maximum adverse moves shows that even a historically strong window can include sharp pullbacks along the way.
The historical seasonal average trend chart suggests that gains have tended to build gradually rather than in a single burst, with a bias toward steady appreciation across the 39 days. That fits a classic utility pattern where dividend-focused buyers and defensive flows accumulate positions over several weeks instead of chasing short, speculative spikes.
The combined net, best-case and worst-case bars highlight a key nuance for traders watching this DUK seasonal pattern analysis. Maximum favorable excursions have often been meaningfully larger than the final net gains, while maximum adverse excursions cluster in a wide band from shallow dips to one extreme outlier, underscoring that path matters as much as destination in this window.
History does not guarantee future results; adverse excursions can be large even in winning windows, so traders should treat this seasonal tendency as context rather than a forecast.
Why does Duke Energy (DUK) follow this seasonal pattern?
One likely driver is the way utility regulation and capital spending decisions bunch up around midyear in midterm election cycles, when policymakers often push through rate and infrastructure actions before the next campaign season. Analysts have also pointed to institutional portfolio repositioning into defensive, dividend-paying names during policy-heavy summers, which can favor large regulated utilities like Duke. This midterm-year summer window may therefore reflect a mix of regulatory clarity, sector rotation and income-focused buying that tends to arrive on a similar timetable each cycle.
What is driving Duke Energy (DUK) today?
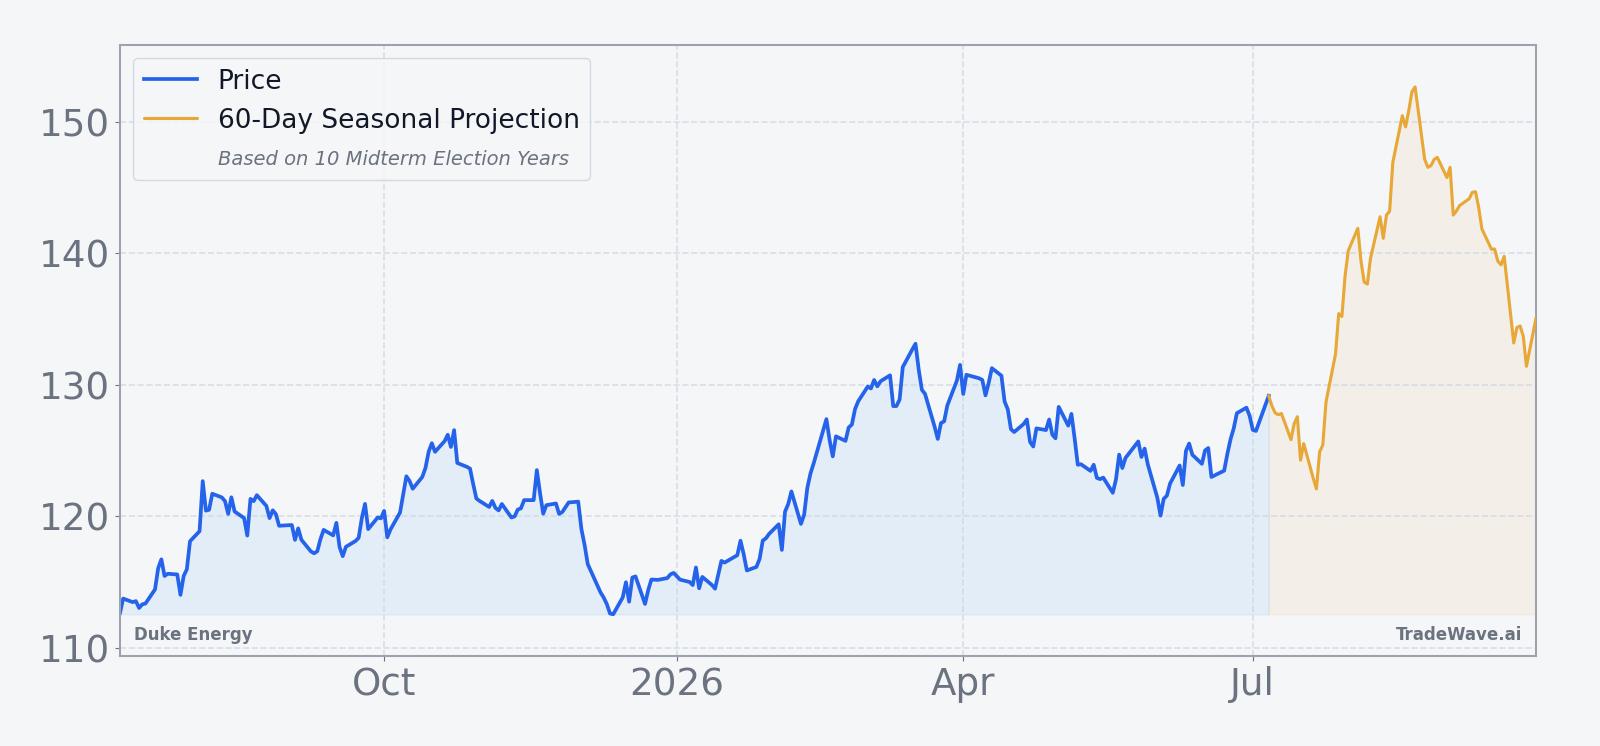
Duke Energy closed Wednesday at $126.58, down 1.75 points or 1.4% on the day, after trading between $126.39 and $127.93 in the prior session. The stock is about 4.2% below its 52-week high of $132.20 and has gained 5.58% over the past month, outpacing many defensive peers as investors lean into utilities with visible growth pipelines.
The near-term story is dominated by Duke’s planned step-up in grid and generation investment and the regulatory backdrop that will determine how much of that spending earns timely returns. In Aug 2025, the company outlined plans to boost capital expenditures to $87 billion and highlighted expectations that most electric capital spending would qualify for efficient-recovery mechanisms, reducing regulatory lag and supporting earnings from its core utility segment.[1]
That capex push sits alongside a supportive demand backdrop. In Aug 2025, the U.S. Energy Information Administration projected record U.S. power consumption in 2025 and 2026, a trend that underpins Duke’s decision to lean into grid upgrades and new generation capacity.[1] For a regulated utility, higher volumes and a larger rate base can translate into steadier earnings growth, provided regulators sign off on rate structures that keep returns attractive.
Rate cases and capital plans are the key catalysts on the horizon. Management has flagged an updated capital plan expected in early 2026 that could outline $95 billion to $105 billion of spending for 2026 through 2030, with an equity funding mix of roughly 30% to 50%, a balance that will matter for dilution and credit metrics.[1] The company has also pointed to rate case hearings in the fourth quarter with new rates expected to be effective by early 2026, a sequence that will shape the earnings power of its electric utilities segment for years.[1]
Back in Aug 2025, Duke reported better-than-anticipated adjusted earnings per share of $1.25 for the quarter, beating a $1.18 consensus estimate, with electric utilities segment earnings rising to $1.19 billion from $1.12 billion a year earlier.[1] Shares climbed to a record high on that report and were last up about 2.5% on the day, underscoring how sensitive the stock can be to signs that regulators are allowing the company to earn on its growing capital base.[1]
The chart below situates the latest move in its recent multi-month context and overlays a short-term seasonal projection.
What should traders watch as this seasonal window approaches?
First, the calendar. The 39-day window starting Jul 10 has been a clean 10-for-10 for long positions in prior midterm election years, so how DUK behaves in the first week of that stretch will be an early tell on whether the historical pattern is asserting itself again. A firm tape with shallow pullbacks would rhyme with the typical seasonal path, while a sharp break lower would mark a clear departure from the historical script.
Second, policy and regulation. Any updates around the planned 2026–2030 capital plan, the equity funding mix, or the timing and outcomes of rate case hearings will feed directly into how investors handicap Duke’s ability to earn on its growing asset base.[1] Surprises that improve visibility on returns have historically been met with strong buying interest, while tougher regulatory stances can blunt even favorable seasonal backdrops.
Third, demand and macro. Power consumption forecasts and broader economic data will shape how investors view the utilities sector seasonal outlook. If the narrative of record electricity demand in 2025 and 2026 holds, that supports the case for sustained infrastructure investment and could reinforce the historical tendency for DUK to grind higher through this midterm-year summer window.[1]
Finally, price behavior itself will be the cleanest scoreboard. Traders watching this Duke Energy stock pattern analysis will be focused on whether intraperiod drawdowns stay in the more typical low single-digit range or start to resemble the rare but severe outlier seen in 2002. A window that delivers steady gains with contained downside would fit the 10-for-10 history, while a choppy or deeply negative path would signal that this cycle is breaking from the usual midterm-year playbook.
Sources
About this seasonal analysis
Seasonal pattern data is sourced from TradeWave.ai, which analyzes historical price behavior across annual calendar windows going back up to 30 years. Read the full data methodology or the book The 100-Year Pattern by Afshin Moshrefi (2026 edition). Past performance of seasonal patterns does not guarantee future results. This article is for informational purposes only and does not constitute investment advice.