Amphenol (APH) Has Never Lost in This 273-Day Midterm Window, With 389% Cumulative Upside
Amphenol is heading into a historically powerful 273-day seasonal window just as shares retreat from record territory, raising the stakes for this midterm-year setup.
Price as of Jul 2, 2026: $164.59 (last close).

What is the seasonal pattern for Amphenol (APH)?
Amphenol has risen in 8 of 8 midterm-election-year windows starting around Jul 11, with an average gain of 22.25% in winning years.
- 8 for 8 in this window, averaging 22.25% gains in winning years across the last eight midterm election cycles.
- Seasonal window begins Jul 11, 2026 and runs for 273 calendar days, spanning the back half of the midterm year into the pre-election ramp.
- Percent Profitable is 100%, with 8 winners and 0 losers in the historical sample for this APH seasonal trend.
- Average profit of 22.25% reflects strong upside in this Amphenol trading window, with median gains of 22.67% and a 389% cumulative return across all cycles.
- TradeWave Ratio (TWR) of 2.29 and a Sharpe ratio of 2.14 point to historically strong upside moves relative to volatility in this period.
- Individual years have still seen meaningful drawdowns inside the window, with adverse swings as deep as about 28% before finishing higher.
According to historical data from TradeWave.ai, this upcoming stretch for Amphenol behaves very differently from an average calendar year, with a distinct midterm-election-year bias that most investors never see in standard research.
How has Amphenol (APH) traded in this midterm-year seasonal window?
Amphenol has posted gains in every one of the last eight midterm-election-year windows that start around Jul 11 and run for 273 calendar days, averaging 22.25% returns for long positions. Shares finished the prior session at 164.59 after a 4.4% drop, leaving the stock about 7.8% below its 52-week high of 178.52 and still well above its 50-day moving average near 145.75. That combination of a sharp pullback from highs and a historically strong seasonal regime approaching gives this year’s setup unusual weight for traders watching the APH seasonal trend.
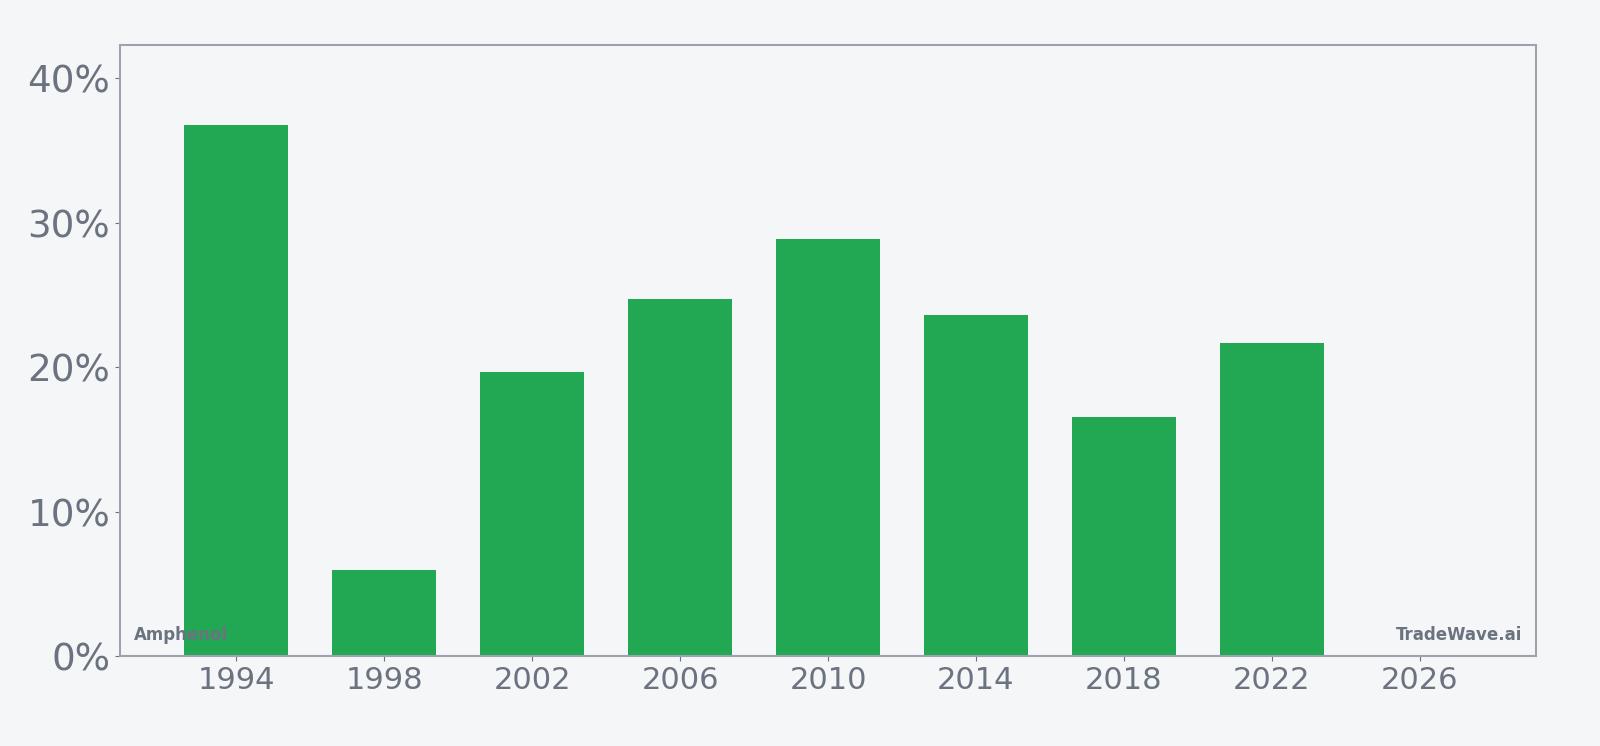
Grouping the data by the presidential election cycle matters here because this window sits in the back half of the midterm election year, a phase that often sees policy uncertainty fade and risk appetite rebuild ahead of the year before the presidential election. For a cyclical, AI-exposed industrial like Amphenol, that backdrop has historically lined up with stronger capital spending and data center build-outs, which can amplify any existing uptrend in the stock.
This seasonal window begins on Jul 11, 2026 and spans 273 calendar days. Historically, during this period, Amphenol has shown a strong bullish tendency for long positions, with 8 winners and 0 losers and a 389% cumulative return across those cycles. The average gain of 22.25% sits close to the median of 22.67%, which suggests the wins have been relatively clustered rather than driven by a single outlier year.
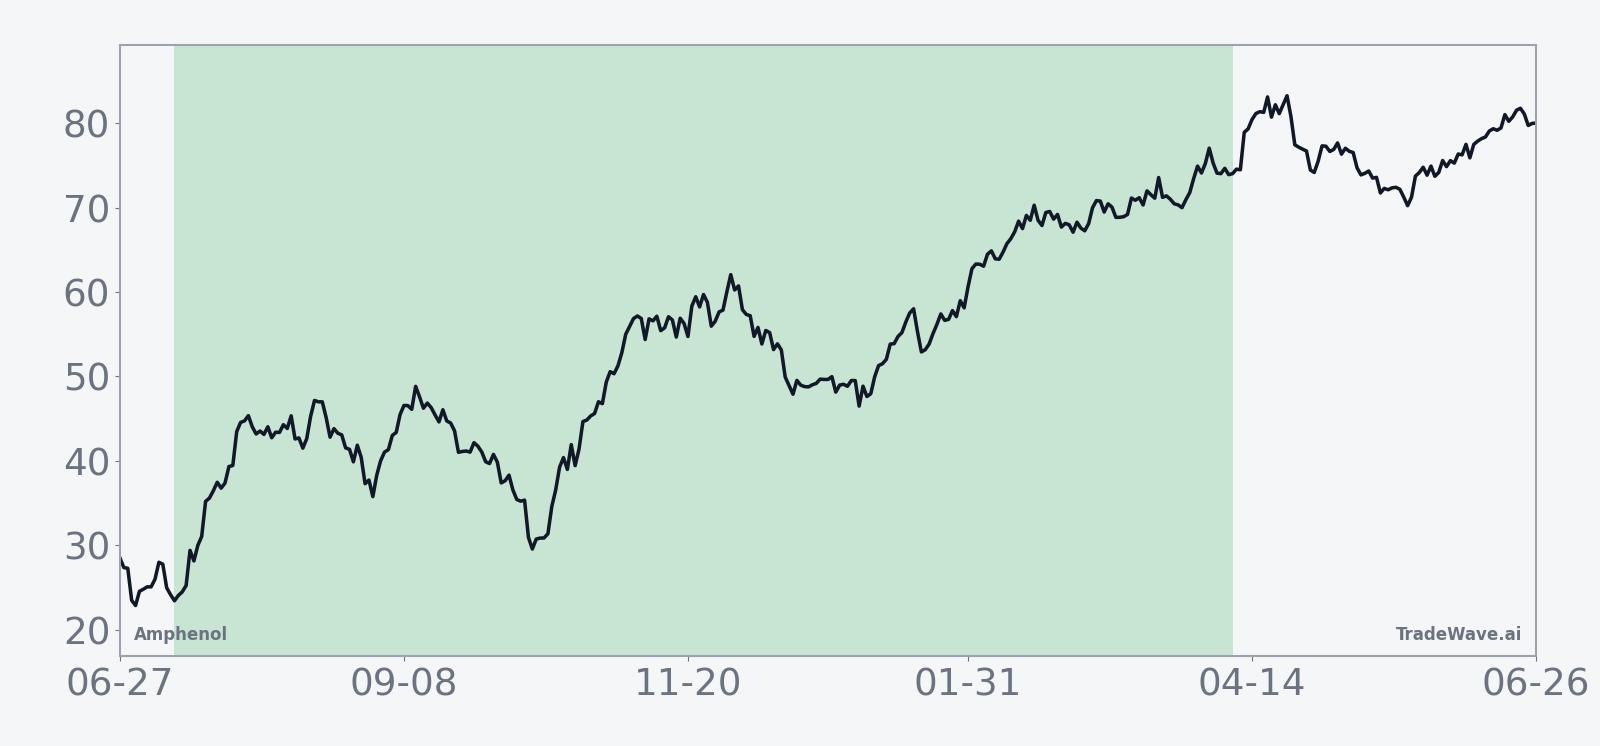
The historical seasonal average trend for this Amphenol trading window slopes higher for most of the period, with gains building steadily rather than spiking in a single short burst. Trend metrics show 55 days where the average path is meaningfully higher in the trade direction versus only 9 days leaning lower, and an even stronger 82-to-0 skew when focusing on the most directional stretches. That profile fits a regime where pullbacks have tended to be pauses inside a broader advance rather than lasting reversals.
Year-by-year bars that include both peak rallies and worst drawdowns help clarify how much volatility has come with those gains.
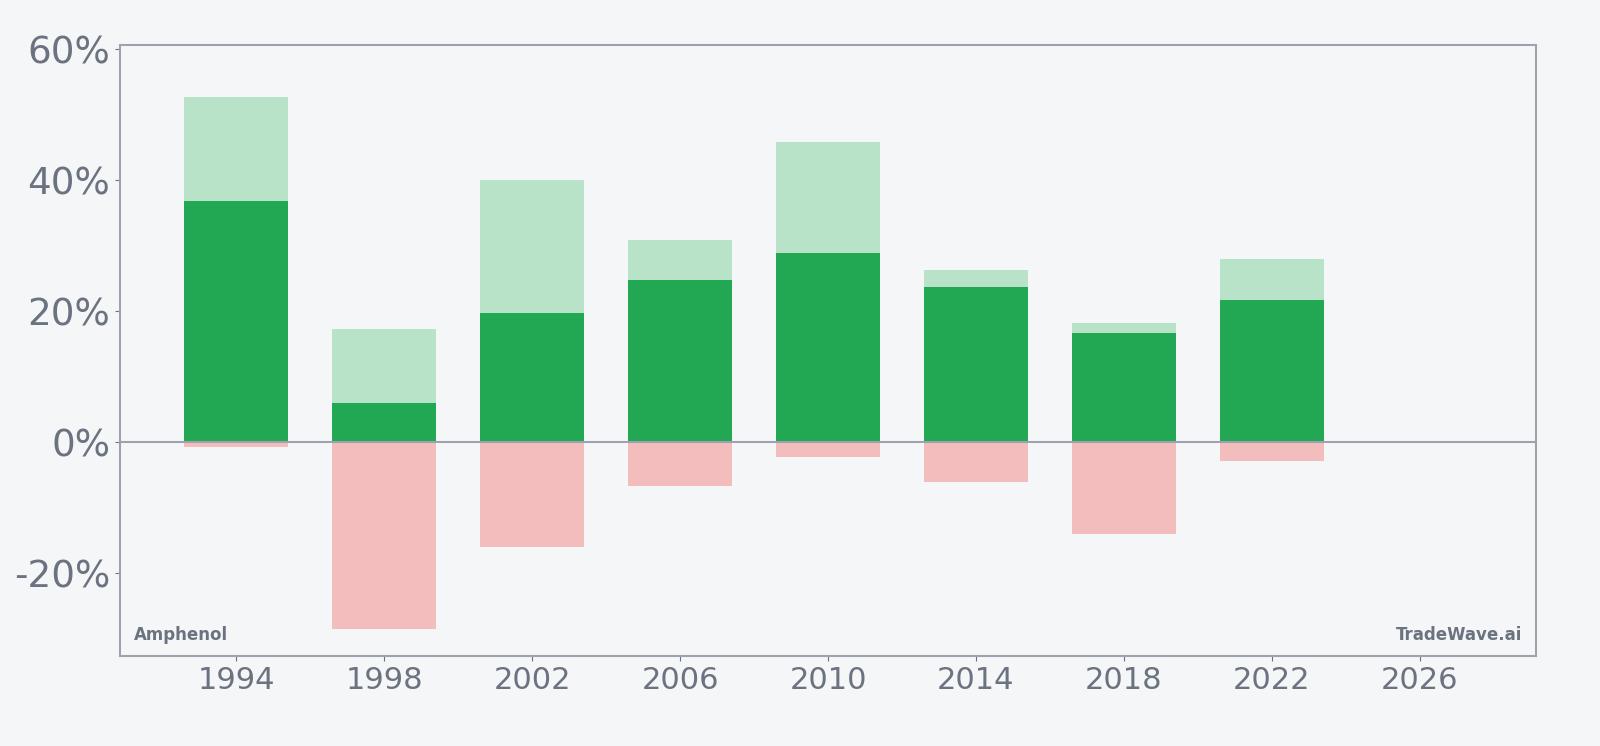
Maximum favorable moves inside the window have been substantial, with peak run-ups ranging from about 17% to more than 52% in individual years, while maximum adverse moves have varied from shallow pullbacks of less than 1% to drawdowns near 28%. In 1994, for example, Amphenol gained 36.8% with a best intraperiod rally of 52.79% and only a 0.7% worst drawdown, while in 1998 the stock still finished up 5.97% but only after enduring a 28.47% slide at one point. Add it up and you get a pattern that has favored longs consistently, but with enough intraperiod volatility that position sizing and risk management have mattered.
History does not guarantee future results; even in windows where every past year finished higher, adverse excursions can be large and fast before the trend reasserts itself.
Why does Amphenol (APH) follow this seasonal pattern?
One likely driver is the clustering of corporate and government technology budgets in the back half of the midterm election year, as policy visibility improves and delayed projects are released. Analysts have also pointed to sector rotation into industrial and communications hardware ahead of the typically strong year before the presidential election, which can channel incremental flows into names like Amphenol. This pattern may also reflect institutional portfolio rebalancing around fiscal year-ends, when long-term investors lean into structural AI and connectivity themes after midyear volatility.
What is driving Amphenol (APH) today?
Amphenol closed the prior session at 164.59, down 4.4% on the day, after trading between 161.36 and 173.00 on heavy volume of about 8.3 million shares versus a 20-day average near 9.6 million. The stock remains well above its 50-day moving average around 145.75 and has more than doubled from its 52-week low near 93.91, even after slipping about 7.8% below its 178.52 high, leaving bulls with a pullback rather than a broken trend.
Fundamentally, the story that carried Amphenol to those highs has centered on AI-driven demand for its interconnect, cable and fiber products, with analysts projecting sustained high AI revenue growth into 2026 as data center and networking build-outs continue.[1] The company has also been expanding its footprint in communications and defense through acquisitions, including a planned purchase of CommScope’s broadband connectivity and cable unit and a separate deal to buy Trexon, which would deepen its presence in fiber and defense cable assemblies.[2][3] Those deals, announced in 2025, signaled a push to lock in more exposure to broadband and defense spending cycles rather than relying solely on organic AI demand.
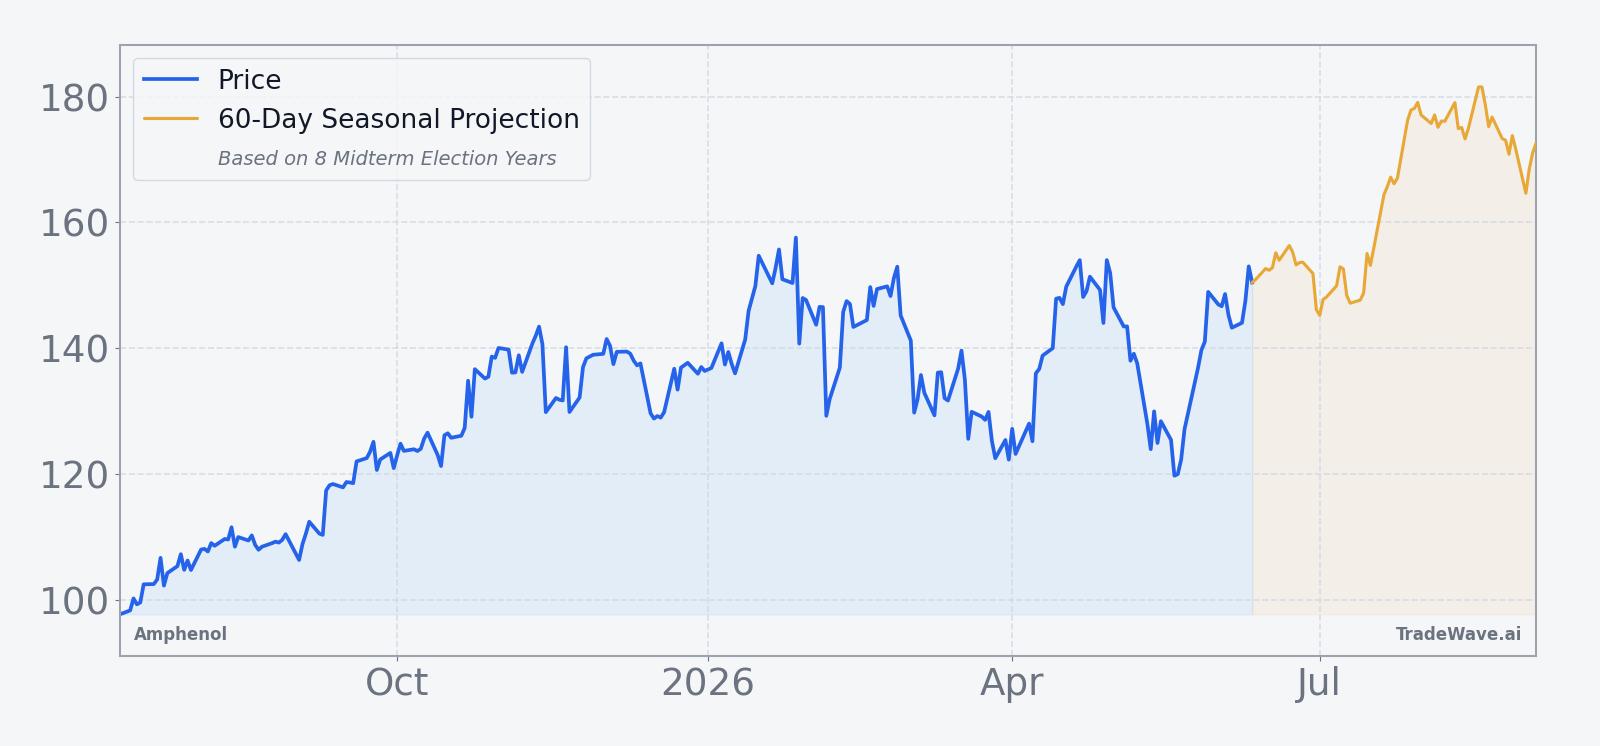
The chart below situates the latest pullback against the past year’s climb and a short-term seasonal projection.
What should traders watch as this Amphenol seasonal window approaches?
First, the calendar: the 273-day window tied to the last eight midterm election years begins on Jul 11, so price action in the days around that date will show whether Amphenol is respecting its historical seasonality or diverging from it. A firming of the stock above the 50-day moving average and a push back toward the 170s would be more in line with the typical bullish pattern, while a break toward the low 150s would mark a clear departure from the historical script.
Second, macro and policy catalysts matter in this phase of the presidential cycle. Any shifts in fiscal spending plans, defense budgets or incentives for broadband and data center infrastructure could either reinforce or blunt the usual midterm-to-pre-election tailwind for industrial and communications hardware names. Traders will be watching whether AI-related capex commentary from large cloud and telecom customers continues to point higher, since that demand has been central to Amphenol’s recent narrative.[1]
Third, intraperiod volatility inside this window has historically been meaningful, with some years seeing drawdowns of more than 20% before finishing higher. If the stock starts the window with a strong rally, traders may look for whether any subsequent pullbacks stay shallower than those past maximum adverse moves, which would signal a cleaner trend than in prior cycles. Conversely, a deep early drawdown that still holds above the 52-week low would be consistent with the pattern’s history of shaking out weak hands before resuming higher.
Finally, because this window bridges the midterm election year into the year before the presidential election, behavior here will help set the tone for how investors treat AI and connectivity hardware in the broader cycle. If Amphenol can stabilize after the latest drop and track anything close to its historical seasonal path, it would reinforce the idea that this stock pattern analysis still matters for positioning. If it breaks sharply from that script, traders may need to rethink how much weight to give election-cycle seasonality in a market dominated by AI and policy crosscurrents.
Sources
About this seasonal analysis
Seasonal pattern data is sourced from TradeWave.ai, which analyzes historical price behavior across annual calendar windows going back up to 30 years. Read the full data methodology or the book The 100-Year Pattern by Afshin Moshrefi (2026 edition). Past performance of seasonal patterns does not guarantee future results. This article is for informational purposes only and does not constitute investment advice.