IBM Enters Historically Strong 47-Day Midterm Summer Window
IBM is about to open a historically strong 47-day midterm-year trading window just as the stock trades well below its 52-week high and options activity heats up.
Price as of Jun 30, 2026: $281.21 (last close).

What is the seasonal pattern for IBM (IBM)?
IBM has risen in 8 of 8 midterm-year summer windows starting around Jul 2, with an average gain of 7.66% in winning years.
- 8 for 8 in this window, with IBM averaging 7.66% gains across winning years over the last eight midterm election cycles.
- The upcoming 47-day trading window begins Jul 2 and has historically been a bullish IBM seasonal trend in midterm election years.
- Percent Profitable is 100%, with 8 winners and 0 losers in this specific IBM trading window.
- Average profit in winning years is 7.66%, with a cumulative return of 77% across the eight historical windows.
- Intraperiod swings have been meaningful, with some years seeing adverse moves of more than 6% before finishing higher.
- The pattern clusters in midterm election years, tying IBM’s seasonal behavior to the policy and spending backdrop of that phase.
According to historical data from TradeWave.ai, this midterm-year stretch has behaved very differently from an average summer for IBM, with a clear directional bias that most investors never see quantified.
How has IBM (IBM) traded in this midterm-year summer window?
IBM has risen in 8 of the last 8 midterm election years during the 47 calendar days starting Jul 2, averaging a 7.66% gain and delivering a 77% cumulative return across those windows. The stock heads into this latest iteration at 281.21 after Tuesday’s close, about 15.4% below its 52-week high of 332.46, leaving room above if the historical pattern repeats. Options traders have already been active around IBM’s quantum and policy catalysts, with heavy call buying reported in late May as investors reacted to a potential $1 billion U.S. Commerce Department grant for quantum computing.[8]
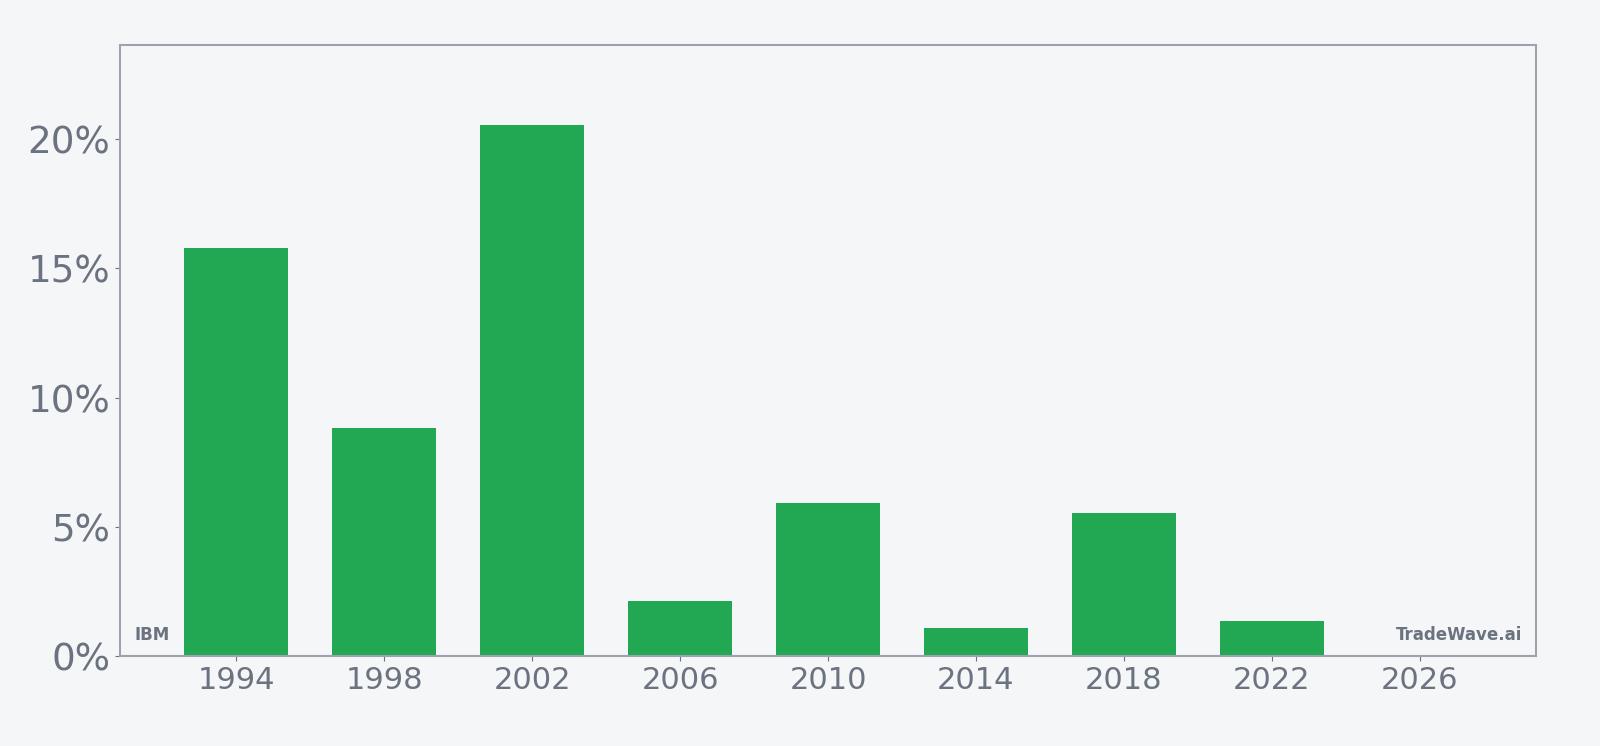
Grouping the data by the presidential election cycle matters here because this window sits in the heart of the midterm election year, a phase when policy debates, spending decisions and regulatory noise often reshape expectations for large-cap tech and enterprise IT budgets. IBM’s historical seasonality in this slice of the calendar reflects that backdrop, capturing how the stock has traded as Washington moves from early-term agenda setting toward the run-up to the pre-election year.
This seasonal window begins on Jul 2 and spans 47 calendar days. Historically, during this period, IBM has shown a strong bullish tendency when traded long, with every midterm-year sample finishing higher at the end of the window. The strongest year in the sample was 2002, when IBM gained 20.55% between the entry and exit dates, while the softest outcome was 2014, which still delivered a 1.11% net gain.
The average winner gain of 7.66% sits above the median profit of 5.74%, which tells you that a few outsized years have pulled the mean higher. Even so, the distribution is not just about one or two big outliers: five of the eight windows posted net returns between roughly 2% and 9%, suggesting a fairly consistent positive IBM seasonal pattern rather than a single lucky spike.
Intraperiod swings have been real. Maximum favorable moves inside the window have ranged from 2.38% in 2006 to 21.08% in 2002, while maximum adverse moves have stretched as far as a 9.08% drawdown in 2022 before the stock recovered to finish the window in the green. That MAE profile shows that even in a historically strong IBM trading window, investors have had to sit through meaningful downside at times.
The trend view across the 47 days shows gains that tend to build gradually rather than in a single burst. In several years, IBM’s historical seasonality has featured a modest early drift followed by stronger performance in the back half of the window, which lines up with how midterm-year policy news often clusters later in the summer.
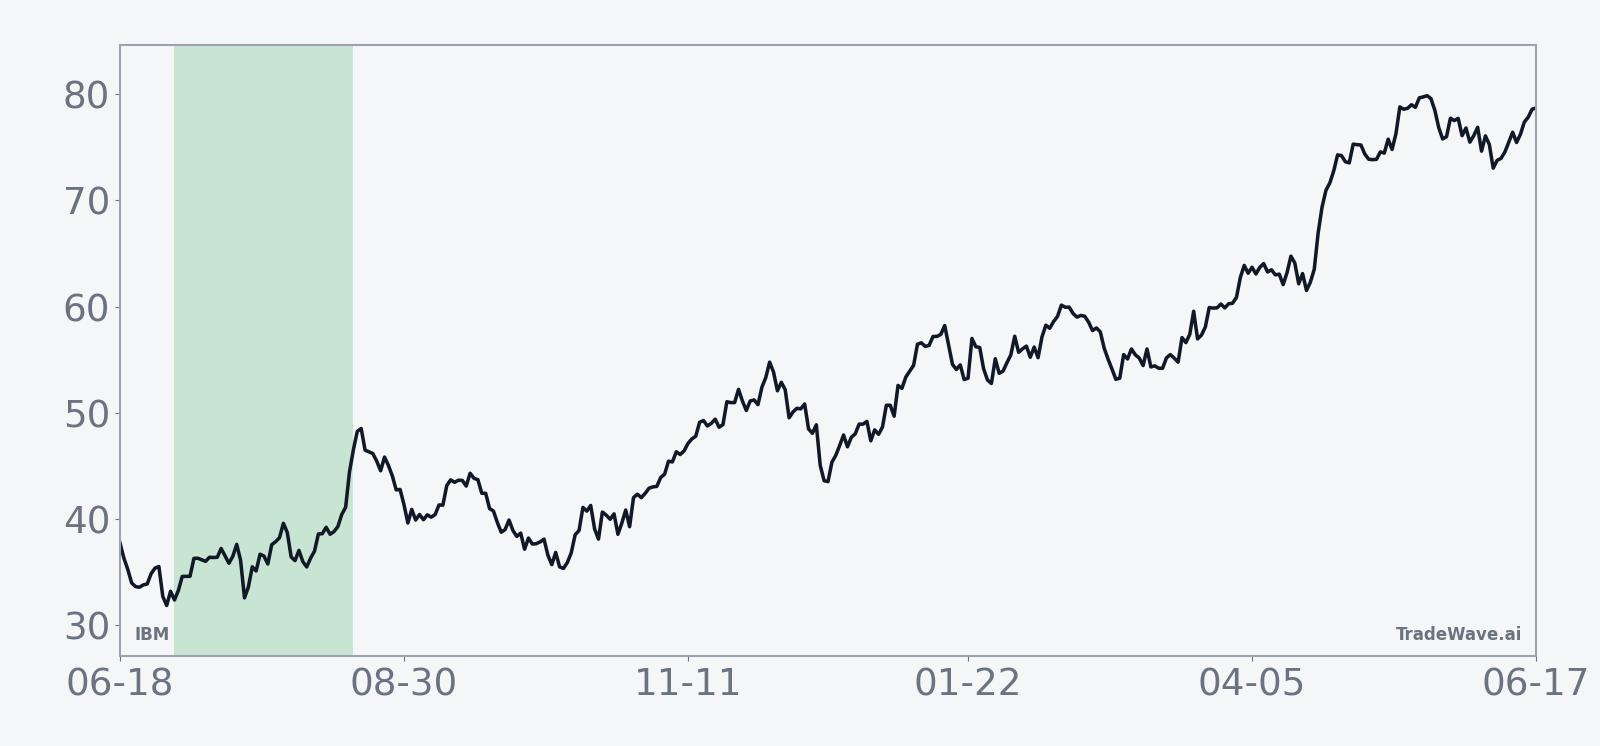
Year-by-year net returns and intraperiod swings round out the picture of upside persistence with real drawdown risk.
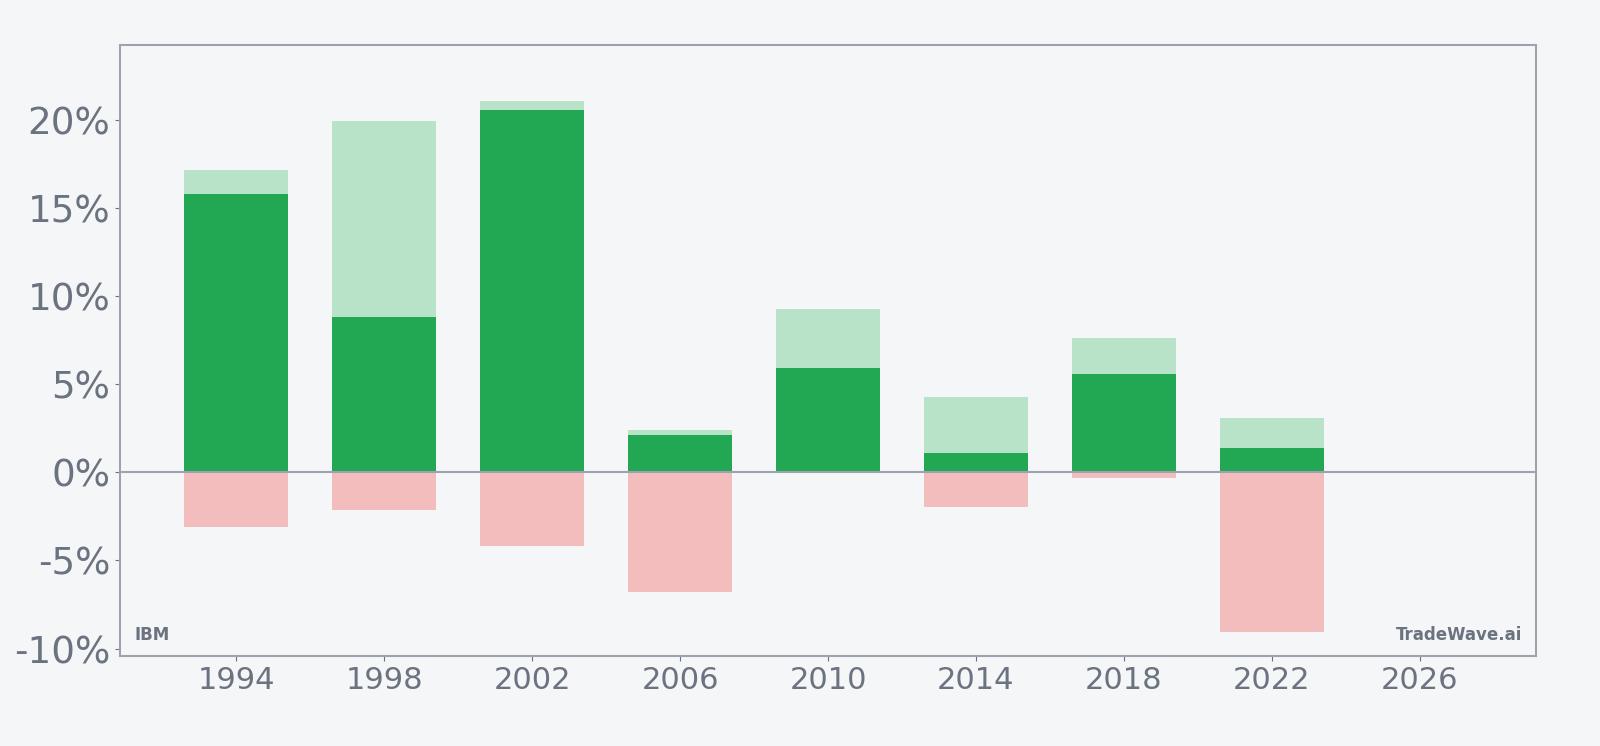
The pattern is clear: this midterm-year summer window has favored IBM longs in every sample so far, but the path has often included sharp swings before the gains stick.
Why does IBM (IBM) follow this seasonal pattern?
One likely driver is the way IBM’s earnings calendar and enterprise spending cycles line up with the midterm-year policy backdrop. Corporate IT budgets and government contracts often firm up in the middle of the year, just as Washington debates spending and regulation that can benefit large, established vendors. Analysts have also pointed to sector rotation into defensive tech and software during midterm uncertainty, which can steer flows toward IBM’s mix of mainframe, software and services rather than higher-beta growth names.
History does not guarantee future results; adverse excursions can be large even in winning windows, and IBM’s past seasonal behavior may not repeat in this cycle.
What is driving IBM (IBM) today?
IBM closed Tuesday at 281.21, up 1.15% on the day, after trading between 271.12 and 282.57 on volume below its 20-day average. The stock is about 15.4% below its 52-week high of 332.46 and well above its 52-week low of 212.34, with the 50-day moving average down at roughly 252.43, so the recent pullback still sits inside a broader uptrend.
In early June, IBM shares surged about 15% in a single session after a video featuring former President Donald Trump resurfaced and helped refocus attention on the company’s role in AI and quantum themes, driving a record close for the stock.[9] The same day, a bullish initiation from Barclays highlighted IBM’s software franchise and quantum optionality, assigning a $350 price target and arguing that the stock offered a defensive way to play enterprise AI demand.[10] Barron’s coverage that day also emphasized how software strength, not just quantum headlines, had been powering the move, underscoring that IBM’s story is no longer just about mainframes.[6]
On the fundamental side, IBM’s most recent quarter in April delivered a beat on both revenue and earnings, with management reiterating guidance for more than 5% constant-currency revenue growth in 2026 and about $1 billion in incremental free cash flow, even as the stock sold off on a cautious read of the outlook.[2] Earlier coverage in 2025 from MarketWatch and CNBC flagged similar dynamics: solid headline beats but investor focus on software momentum and the durability of mid-single-digit growth targets.[5][3] Forbes and other outlets have framed the stock as a value play on AI and hybrid cloud, arguing that IBM’s valuation has lagged its strategic repositioning toward software and consulting.[4][14]
Layered on top of that, the U.S. Commerce Department’s plan to steer roughly $1 billion toward IBM for quantum computing has become a fresh catalyst, sparking heavy call buying and renewed interest in the stock as traders handicap how federal support could accelerate commercialization.[8] Yahoo Finance coverage of the June spike noted how quickly sentiment can swing when IBM’s narrative intersects politics and policy, a theme that fits neatly with the midterm-year seasonal window that opens this week.[9]
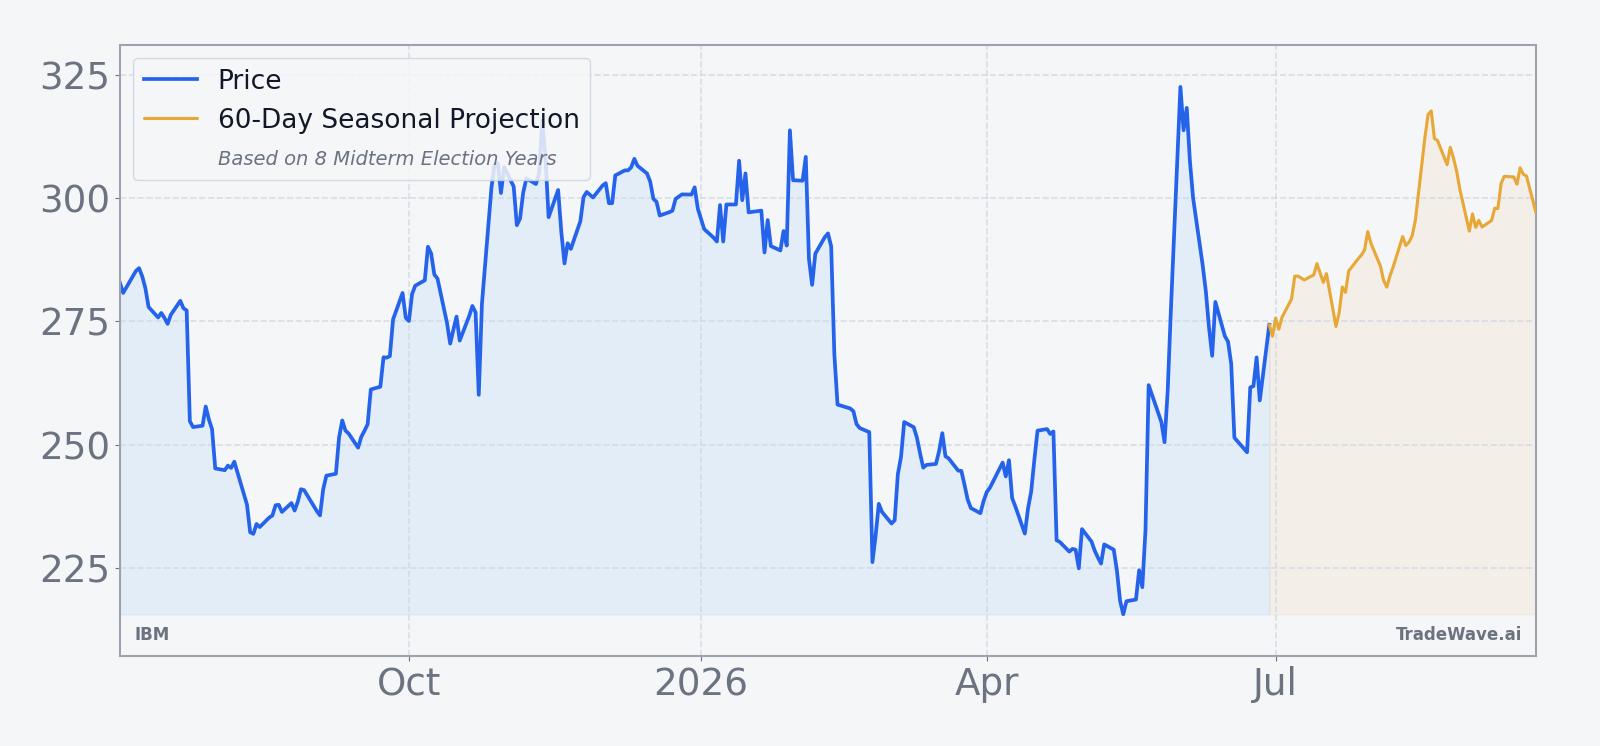
The chart below situates the latest move in its recent multi-month context, alongside a 60-day seasonal projection based on prior midterm-year behavior.
What should traders watch in this IBM (IBM) window?
First, watch how IBM behaves around the 50-day moving average near 252 and the 52-week high at 332.46. A move that respects the former as support while grinding back toward the latter would be consistent with the historical IBM seasonal trend of midterm-year summer strength.
Second, keep an eye on options flow and quantum headlines. If the heavy call buying that followed the Commerce Department grant news and Barclays’ bullish call continues or accelerates, it would signal that speculative interest is leaning into the seasonal tailwind rather than fading away.[8][10] A sharp reversal in that flow, by contrast, would be an early sign that this cycle might diverge from the past eight windows.
Third, monitor the policy calendar and macro tone into late summer. Any shifts in federal tech spending, AI regulation or broader fiscal debates could either reinforce IBM’s role as a defensive enterprise IT play or push investors back toward higher-growth software names. Inside this 47-day IBM trading window, behavior around those headlines will tell you whether the midterm-year pattern is still in force or finally meeting its first real test.
Sources
- MarketWatch: IBM’s stock is sliding. Here’s why these analysts see an opportunity to buy. (Jul 24, 2025)
- Yahoo Finance (GuruFocus): IBM Stock Tumbles. Solid Quarter Can't Offset Tepid Forecast (Apr 23, 2026)
- CNBC: IBM tops third-quarter estimates and lifts guidance, but stock drops (Oct 22, 2025)
- Forbes: What’s Happening With IBM Stock? (Oct 7, 2025)
- MarketWatch: Why is IBM’s stock down after an earnings beat? Here’s one quibble. (Jul 23, 2025)
- Barron's: IBM Stock Notches Highest Close on Record. This Time It’s Not About Quantum. (Jun 1, 2026)
- Barron's: IBM Earnings Beat Estimates. The Stock Is Still Falling. (Apr 22, 2026)
- Yahoo Finance: IBM shares surge 15% after Trump video resurfaces (Jun 1, 2026)
- Business Insider: IBM stock shoots higher after bullish Barclays forecast hits back at SaaSpocalypse fears (Jun 1, 2026)
- Forbes: IBM Stock Isn't Dying. It's On Sale (Feb 24, 2026)
About this seasonal analysis
Seasonal pattern data is sourced from TradeWave.ai, which analyzes historical price behavior across annual calendar windows going back up to 30 years. Read the full data methodology or the book The 100-Year Pattern by Afshin Moshrefi (2026 edition). Past performance of seasonal patterns does not guarantee future results. This article is for informational purposes only and does not constitute investment advice.