Lilly (Eli) (LLY) Has Rallied in 10 of 10 Midterm Windows Starting Jul 26, Averaging 20.76% Gains
Lilly (Eli) is heading into a 291-day midterm-election-year seasonal window with a perfect win record, just as the stock trades near all-time highs and GLP-1 demand reshapes the drugmaker’s outlook.
Price as of Jul 10, 2026: $1,188.58 (last close).

What is the seasonal pattern for Lilly (Eli) (LLY)?
Lilly (Eli) has risen in 10 of 10 midterm-election-year windows starting around Jul 26, with an average gain of 20.76% in winning years.
- 10 for 10 in this window, with winning years averaging 20.76% gains across the last 10 midterm election years.
- The upcoming seasonal window begins Jul 26, 2026 and runs for 291 trading days, spanning the late midterm year into the pre-election year.
- Percent Profitable is 100%, with 10 winners and 0 losers in the historical sample for this long trade setup.
- Cumulative return across those 10 windows totals 523%, with a median single-window gain of 17.42%.
- Intraperiod swings have been meaningful, with individual years showing double-digit peak run-ups and adverse drawdowns before finishing higher.
- The pattern aligns with a long trade direction, supported by a TradeWave Ratio of 1.58 and a Sharpe ratio of 1.26 over the sample.
According to historical data from TradeWave.ai, this midterm-election-year stretch has behaved very differently from an average calendar year for Lilly (Eli), and the next iteration is about to open again.
How strong is Lilly (Eli) (LLY)’s upcoming seasonal window?
Lilly (Eli) has risen in all 10 of the last midterm-election-year windows that start around Jul 26 and run for 291 trading days, averaging 20.76% gains for a long position. Shares finished Monday at 1,188.58, down 2.3% on the day and about 4.9% below their 52-week high of 1,249.45. The combination of a perfect historical record, a long-duration window and a stock sitting just off record territory gives this particular slice of the calendar unusual weight for traders watching the GLP-1 leader.
Grouping the data by the presidential election cycle matters here because this 291-day stretch runs from late in the midterm election year into the year before the presidential election, a phase that has often coincided with clearer policy visibility and stronger risk appetite across U.S. equities. For a mega-cap healthcare name tied to obesity and diabetes spending, that backdrop can influence everything from Medicare coverage debates to how aggressively institutions add or trim exposure.
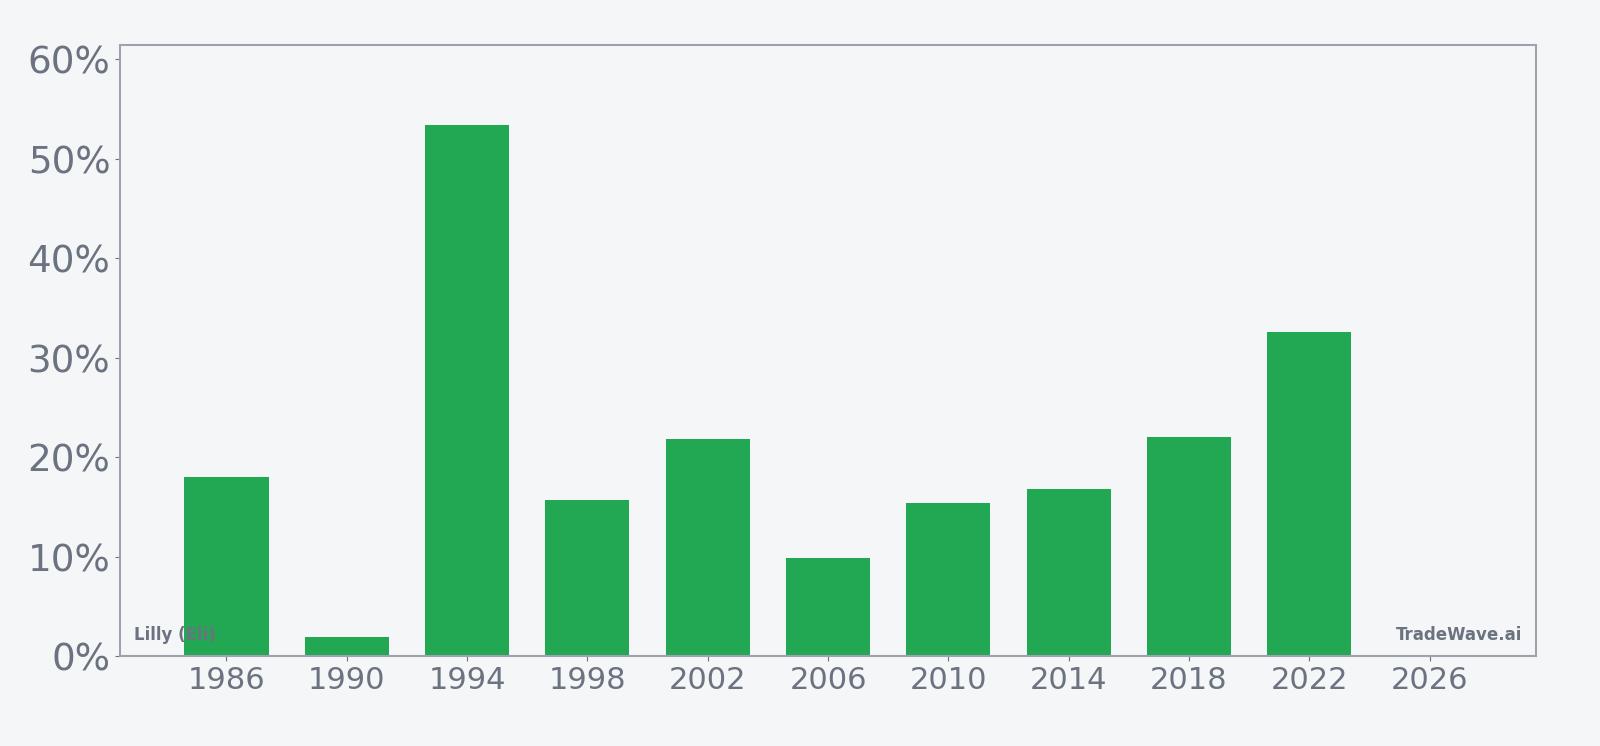
This seasonal window begins on Jul 26, 2026 and spans 291 trading days. Historically, during this period, Lilly (Eli) has shown a strong bullish tendency for long positions, with 10 winners and no losing years in the sample. Average gains of 20.76% sit alongside a median outcome of 17.42%, which tells you the pattern is not just about one or two outlier years but a cluster of solid double-digit advances.
The per-year breakdown shows how that strength has played out. The weakest outcome in the sample was 1.99% in 1990, while the strongest was a 53.42% surge in 1994. More recent cycles have also been robust, including a 32.57% gain in 2022 as Lilly’s GLP-1 franchise gained traction and the stock began its move into the current mega-cap tier.
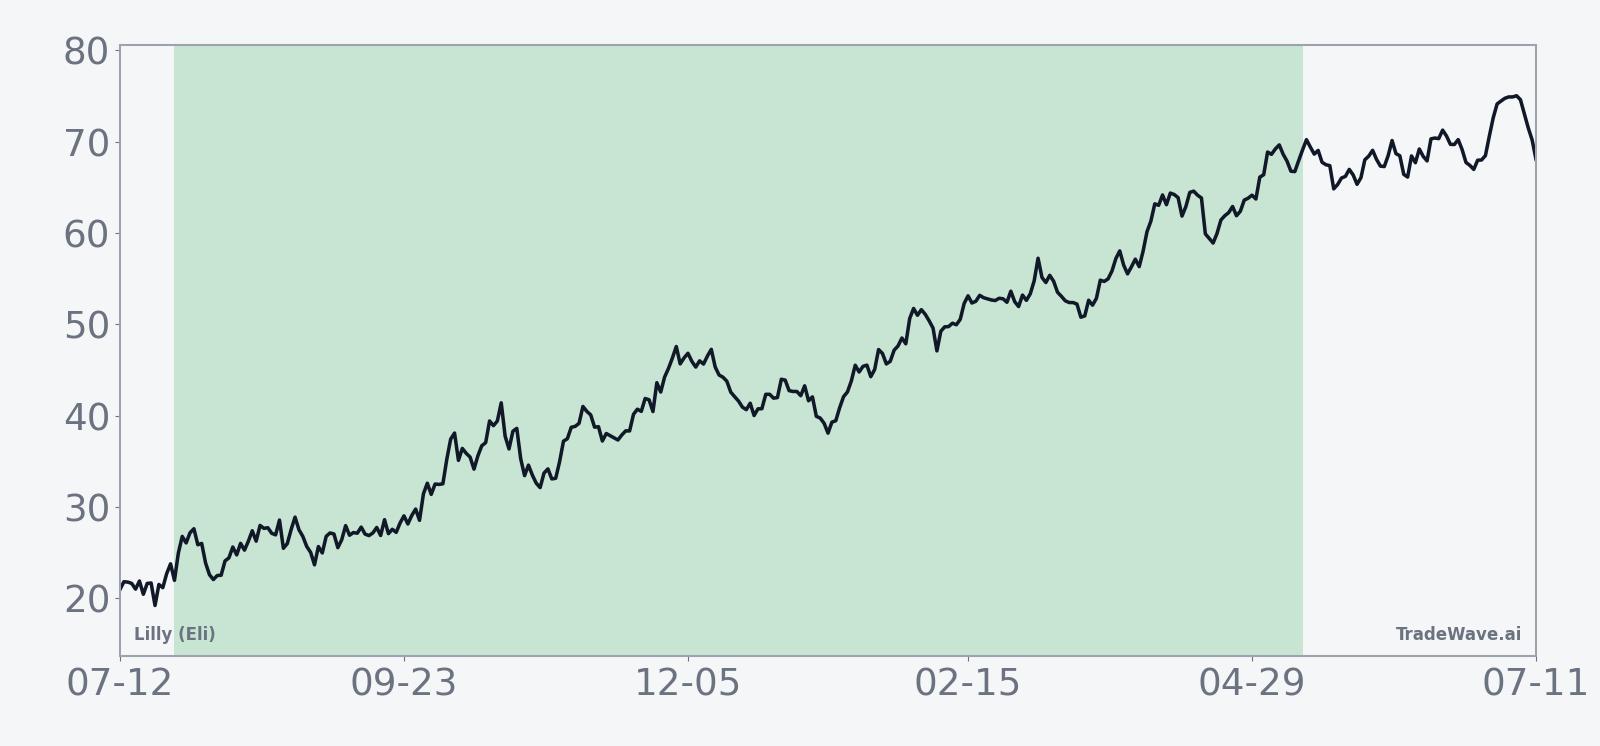
The historical seasonal average suggests that gains tend to build steadily across the window rather than arriving in a single burst. The curve climbs through the midterm year and continues into the pre-election year, which lines up with the broader pattern of stronger equity performance as policy uncertainty around the next presidential race starts to clear.
Yearly net and peak moves highlight how much Lilly (Eli) has typically traveled in both directions before finishing higher.
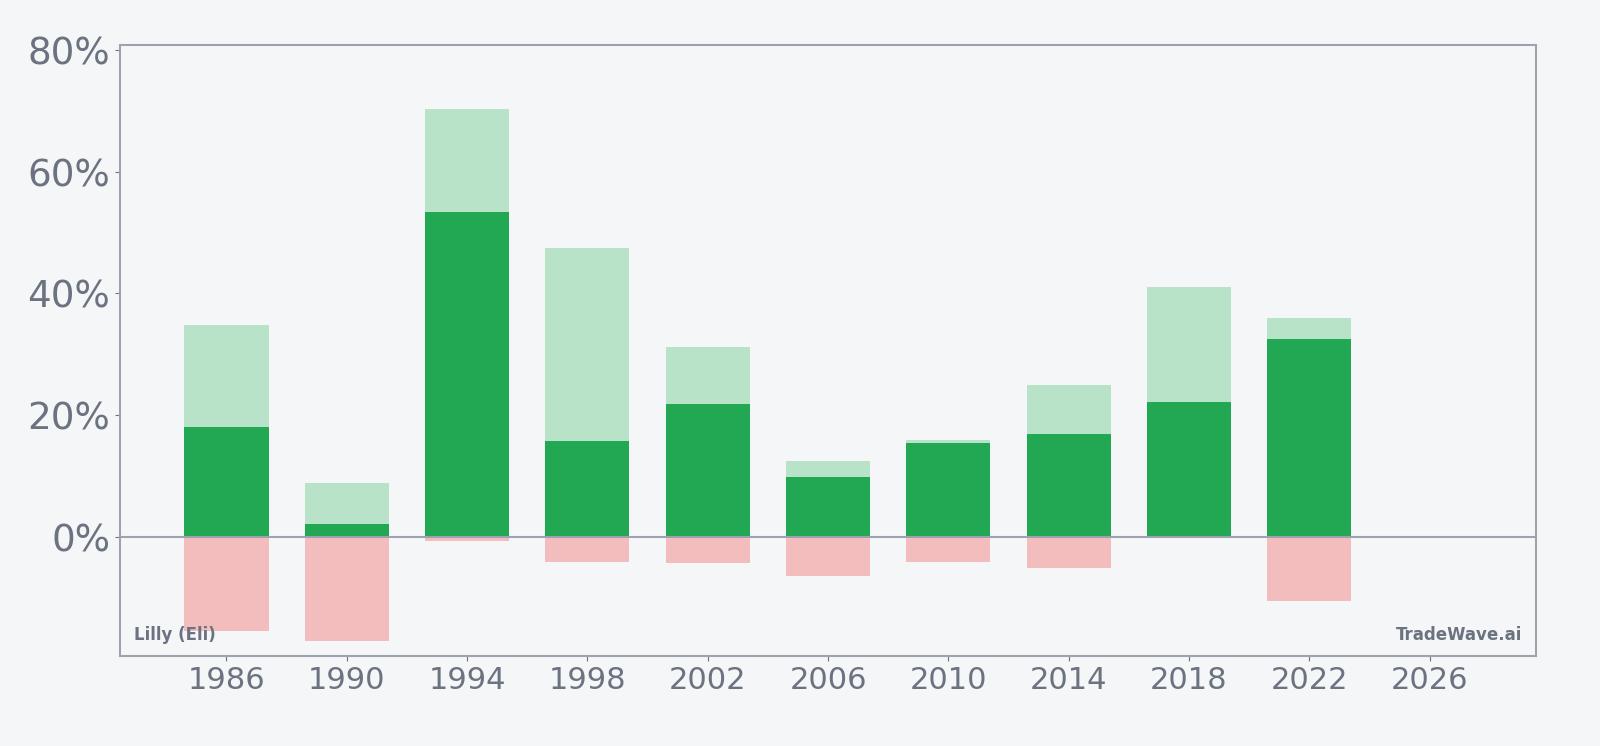
The bars with maximum favorable and adverse excursions show that even in winning years, the ride has not been smooth. In 1990, for example, the stock ultimately finished up 1.99% but saw a worst intraperiod drawdown of about 17.15% from the entry level, while 1994 delivered a 70.33% peak run-up with only a shallow 0.78% adverse move. That mix of large upside potential and sometimes deep interim pullbacks is exactly what the TradeWave Ratio of 1.58 is flagging: historically, Lilly has tended to travel meaningfully in the trade direction within this window, but traders have had to sit through real volatility to capture it.
History does not guarantee future results; adverse excursions (MAE) can be large even in winning windows.
The bottom line is simple: 10 for 10 with double-digit average gains is a rare seasonal record for a mega-cap stock, and this midterm-to-pre-election window has been one of Lilly’s most consistently favorable stretches on the calendar.
Why does Lilly (Eli) (LLY) follow this seasonal pattern?
This pattern may reflect how Lilly’s earnings calendar and guidance cadence line up with the political cycle, with key drug launches and reimbursement updates often clustering in the back half of the midterm year and into the year before the presidential election. Analysts have also pointed to institutional portfolio repositioning around healthcare policy and Medicare funding debates, which can drive steady inflows into perceived winners in obesity and diabetes care. For a company at the center of the GLP-1 story, those forces can combine to make this long midterm-year trading window unusually supportive for the stock.
What is driving Lilly (Eli) (LLY) today?
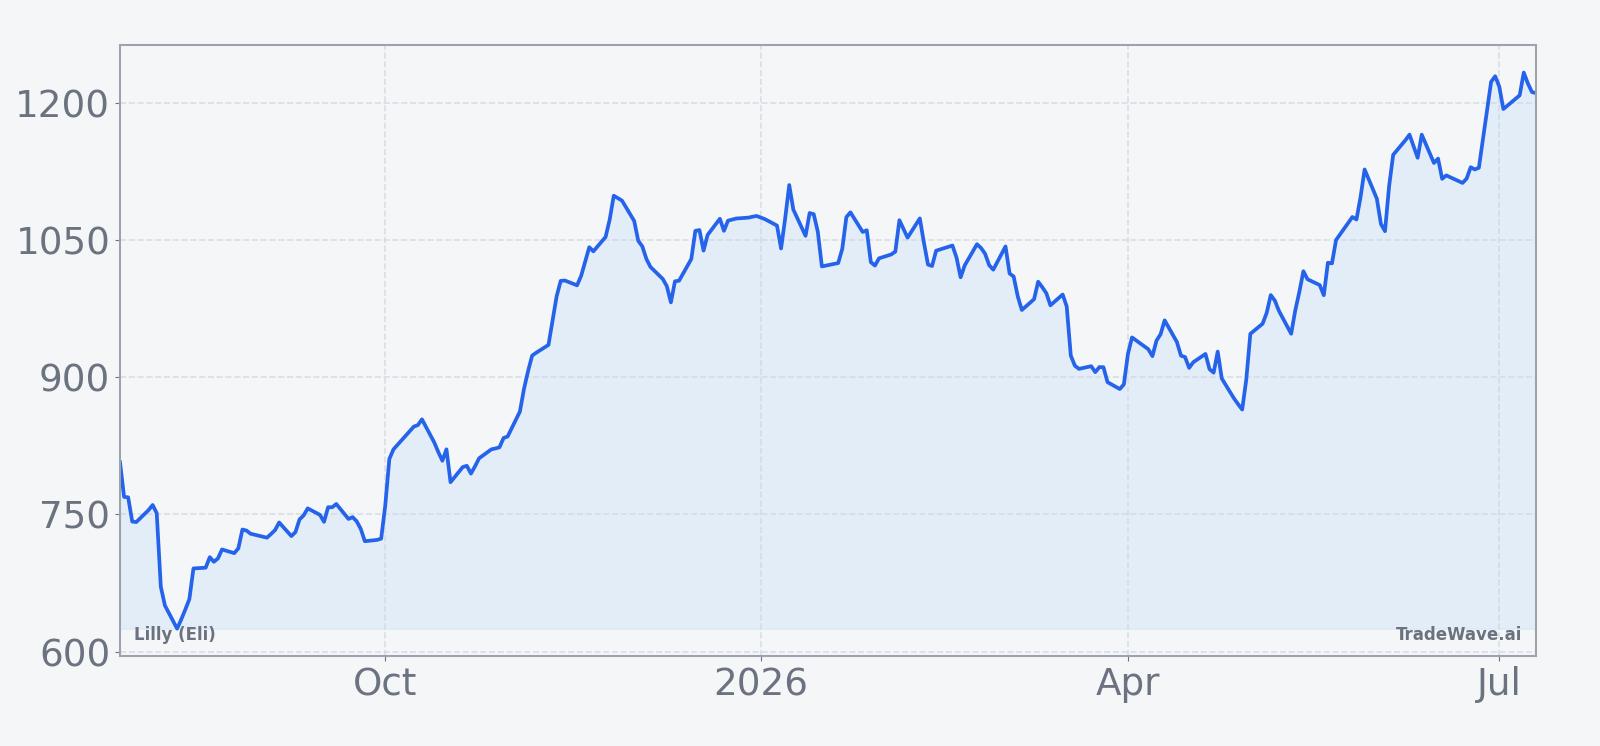
Lilly (Eli) closed Monday at 1,188.58, down 2.3% on the session, after trading between 1,178.32 and 1,212.96 on volume of about 2.0 million shares. The stock remains in a powerful uptrend, sitting well above its 50-day moving average of roughly 1,085.96 and more than 90% above its 52-week low, a reflection of how aggressively investors have repriced the company’s GLP-1 and obesity-drug opportunity over the past year.
Fundamentally, the story is still anchored in demand for Mounjaro and Zepbound, along with pipeline assets like the once-weekly obesity shot Foundayo and oral GLP-1 candidates. In 2025 coverage, analysts highlighted how Lilly’s guidance for 2025 earnings per share in the low-20s range depended heavily on continued uptake of these drugs and the company’s ability to expand manufacturing capacity to meet demand.[2][4] In November 2025, a Medicare agreement to begin covering GLP-1s for certain obesity patients was described as a landmark deal that could significantly expand the addressable market for Lilly’s therapies over time.[11]
Earlier reporting around mid-2025 also framed Lilly as a relative winner after a profit warning from rival Novo Nordisk, with analysts expecting strong quarters as the company leaned into its obesity franchise and raised its long-term growth profile.[2][4] Some investor commentary at the time noted that short interest in Lilly was low, around 0.86%, underscoring how few investors were willing to bet against the name even after a large run-up.[5] That backdrop of strong fundamentals, limited bearish positioning and policy tailwinds is the context in which the next seasonal window will open.
The chart below situates the latest pullback against Lilly’s powerful multi-month rally and the upcoming seasonal projection.
What should traders watch as this seasonal window approaches?
First, the calendar: the 291-day midterm-election-year window opens on Jul 26, 2026 and runs deep into the year before the presidential election. That means it will capture at least three earnings reports, including the back half of 2026 when investors will be watching for any signs that GLP-1 demand is plateauing or that pricing pressure is building.[2][4]
Second, policy milestones matter. Any follow-through on Medicare coverage for obesity drugs, or new reimbursement decisions from private insurers, will feed directly into how investors handicap Lilly’s long-term revenue runway.[11] Positive surprises on coverage or utilization during this window would line up with the historical pattern of strong performance, while negative headlines could be the kind of shocks that produce the deeper intraperiod drawdowns seen in years like 1990.
Third, price levels and volatility deserve close attention. Traders will be watching whether pullbacks toward the 50-day moving average continue to attract buyers, and whether volume spikes on down days hint at profit-taking after a long run. If the stock can hold above key support zones while the seasonal window is open, that would be consistent with the historical tendency for the stock to finish the period higher even after bouts of turbulence.
Finally, positioning and sentiment will be key tells. While earlier commentary pointed to low short interest and a crowded long trade,[5] any shift in that balance during the window could either amplify upside moves or deepen drawdowns. If options activity and short interest stay muted while fundamentals remain strong, the historical 10-for-10 seasonal record will look less like an anomaly and more like a structural feature of how investors treat Lilly in this phase of the election cycle.
Sources
- CNBC, "Eli Lilly earnings are coming Thursday. Here's what top analysts expect" (Aug 6, 2025)
- CNBC, "Eli Lilly will report first quarter earnings before the bell. Here's what Wall Street expects" (Apr 30, 2026)
- Forbes, "Eli Lilly: Sell LLY Stock Ahead of Its Earnings?" (Aug 5, 2025)
- Reuters, "Lilly set for strong quarter after Novo profit warning" (Jul 29, 2025)
- Seeking Alpha, "Eli Lilly: Competition Melts Away (NYSE:LLY)" (Jul 21, 2025)
- CNBC, "Leerink upgrades Eli Lilly following landmark deal with U.S. government" (Nov 10, 2025)
About this seasonal analysis
Seasonal pattern data is sourced from TradeWave.ai, which analyzes historical price behavior across annual calendar windows going back up to 30 years. Read the full data methodology or the book The 100-Year Pattern by Afshin Moshrefi (2026 edition). Past performance of seasonal patterns does not guarantee future results. This article is for informational purposes only and does not constitute investment advice.