10-for-10 Midterm Record: S&P Global (SPGI) Enters a 355-Day Window Averaging 22% Gains
S&P Global is heading into a historically powerful 355-day midterm-election-year seasonal window even as the stock trades well below its 52-week high and investors debate AI disruption and earnings guidance.
Price as of Jul 7, 2026: $443.46 (last close).
What is the seasonal pattern for S&P Global (SPGI)?
S&P Global has risen in 10 of 10 midterm-election-year windows starting around Jul 22, with an average gain of 22.05% in winning years.
- 10 for 10 in this window, with S&P Global averaging 22.05% gains across all winning years.
- Seasonal window begins Jul 22, 2026 and runs for 355 calendar days, covering the late midterm year into the year before the presidential election.
- Percent Profitable is 100%, with 10 winners and 0 losers across the last 10 midterm-election-year cycles.
- Median profit of 24.55% and annualized return of 21.76% point to a historically strong SPGI seasonal trend in this regime.
- TradeWave Ratio of 2.04 and Sharpe ratio of 2.03 indicate sizable directional moves with favorable risk-adjusted returns in prior windows.
- Some years still saw double-digit intraperiod drawdowns before finishing higher, so the ride has not always been smooth.
According to historical data from TradeWave.ai, this is one of the most consistent midterm-election-year windows on S&P Global’s calendar, and the next iteration is about to start.
How has S&P Global (SPGI) traded in this midterm-year window?
S&P Global has risen in 10 of the last 10 midterm-election-year windows that start around Jul 22 and run for 355 calendar days, averaging 22.05% gains for long positions. Shares finished Tuesday at $443.46, down 0.8% on the day and sitting about 13.0% below their 52-week high of $509.70, leaving room above if the historical pattern repeats.
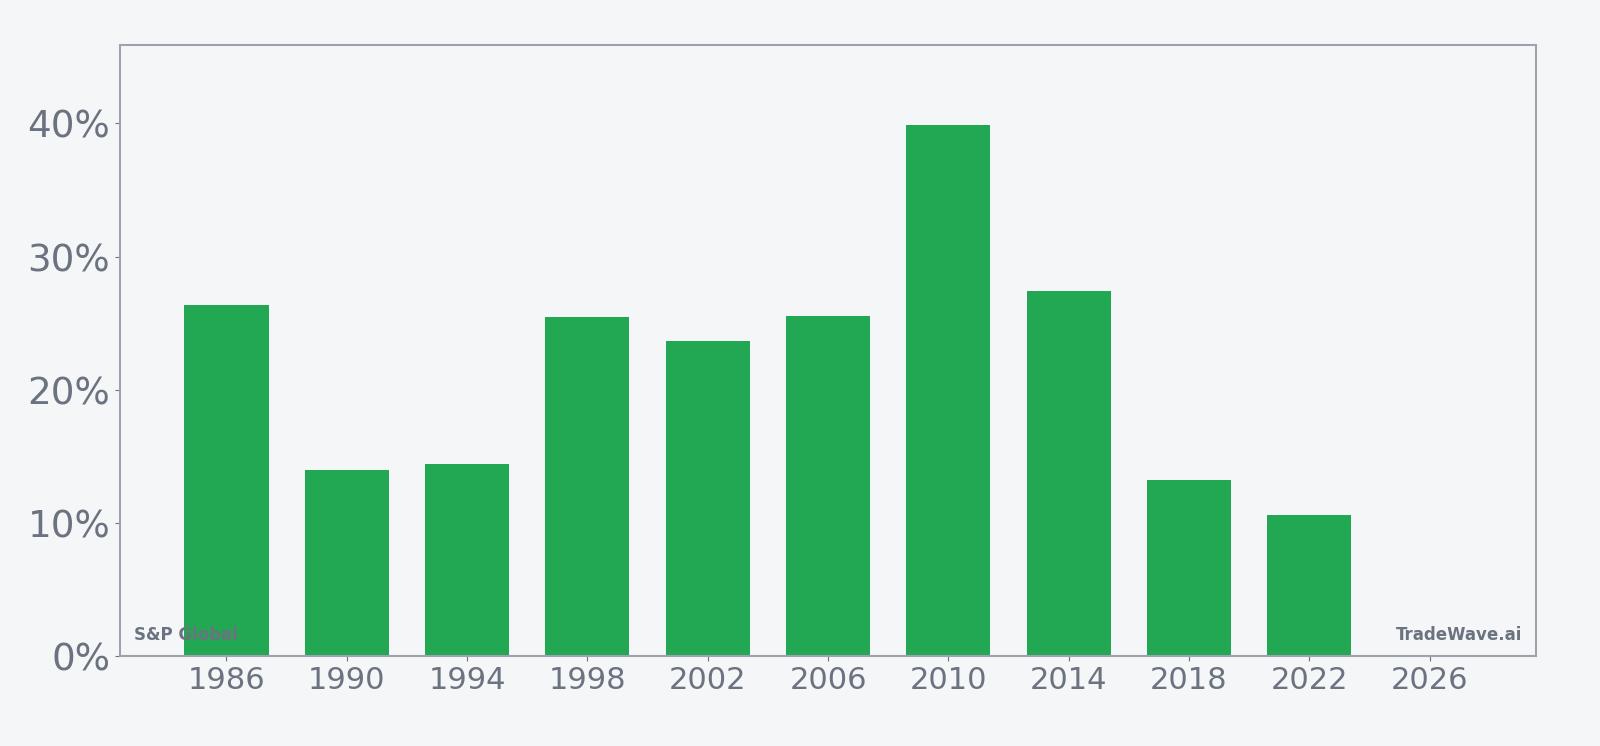
Grouping the data by the presidential election cycle matters here because this window straddles the late midterm year and the run-up to the year before the presidential election, a stretch when policy uncertainty often fades and risk appetite tends to rebuild. For a benchmark data and analytics name like S&P Global, that backdrop has historically lined up with stronger demand for ratings, indices and market intelligence as capital markets reopen after mid-cycle volatility.
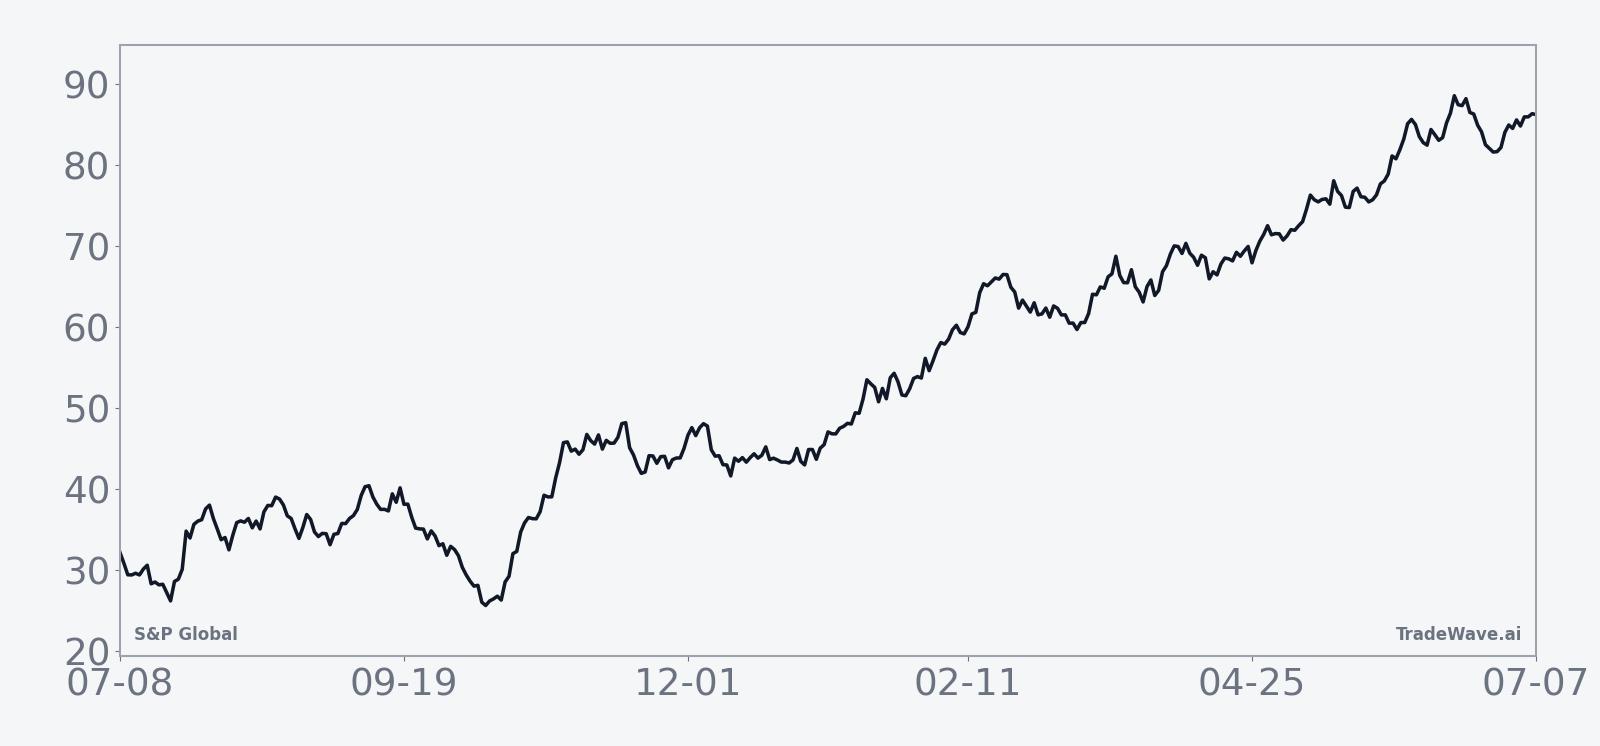
The historical seasonal average shows a fairly steady climb across the 355-day span, with much of the upside accruing after the first quarter of the window. That fits the broader election-cycle pattern in which midterm-year volatility gives way to a more persistent grind higher as markets look ahead to the year before the presidential election.
Year-by-year bars with maximum favorable and adverse moves show how much SPGI has typically swung inside this window before finishing higher.
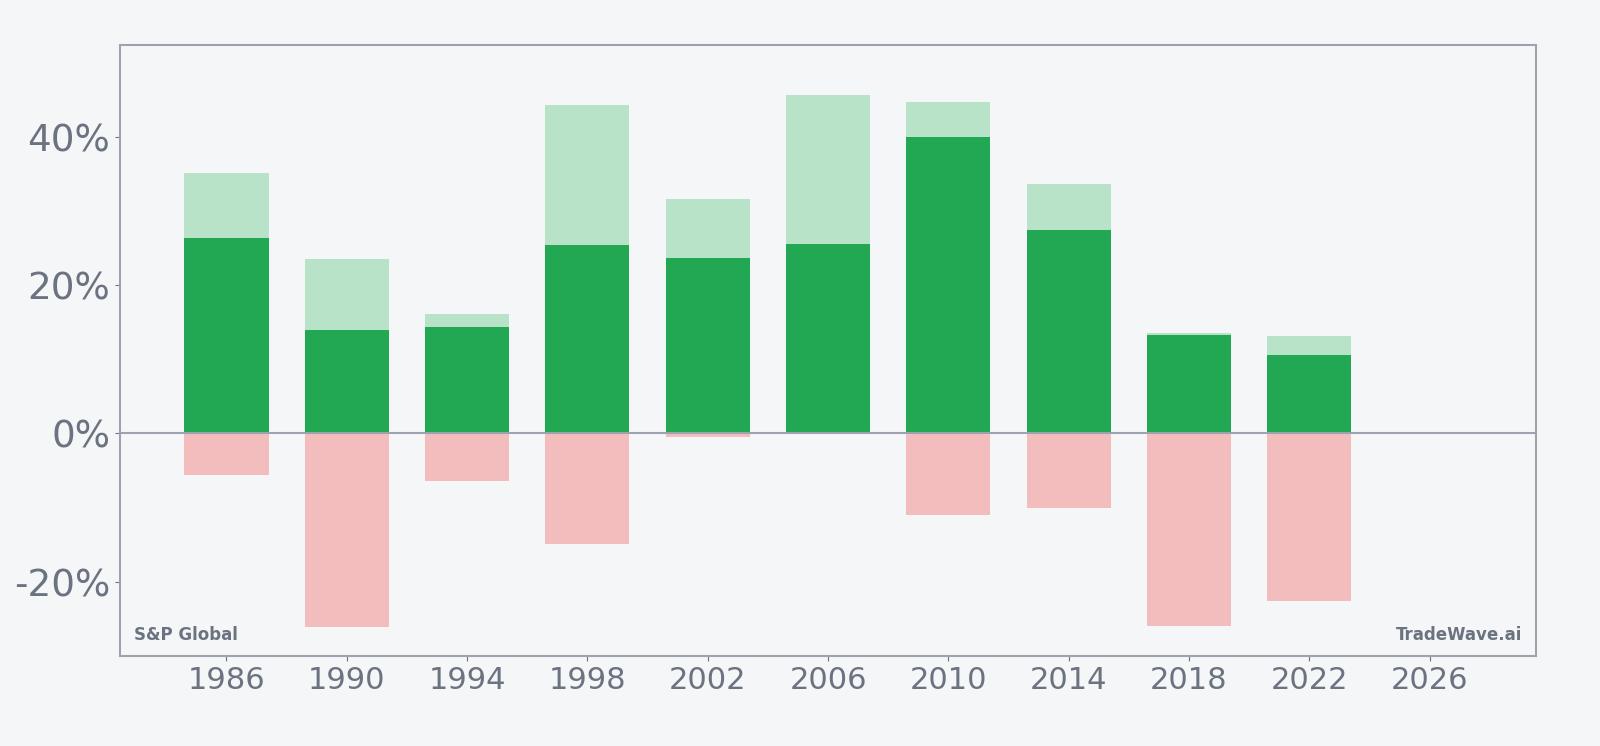
Across individual years, the strongest net gain came in 2010, when S&P Global returned 39.91% with a peak run-up of 44.74% from the entry price before giving back some ground by the exit. The weakest net gain was 10.6% in 2022, but even that year saw a maximum favorable move of 13.18% and a maximum adverse move of -22.65%, underscoring that sizeable drawdowns have sometimes preceded positive outcomes.
Other cycles tell a similar story. In 1998 the stock gained 25.44% in the window, with a best intraperiod rally of 44.23% and a worst drawdown of -14.97%. In 2018, S&P Global finished up 13.23% but endured a maximum adverse excursion of -26.01%, one of the deepest pullbacks in the sample. Add it up: the pattern has been consistently positive for long exposure, but the path has often involved double-digit swings in both directions.
The TradeWave Ratio of 2.04 captures how far price has typically traveled in the trade direction within the window, independent of the final close, and a Sharpe ratio of 2.03 points to historically strong risk-adjusted returns based on end-of-window outcomes. For traders who care about timing, the combination of a smooth average trend and chunky intraperiod excursions suggests that buying and holding through the full window has historically worked, but tactical entries and risk controls have mattered when volatility spikes.
History does not guarantee future results; adverse excursions can be large even in winning windows, and past seasonal strength does not ensure similar performance in the next cycle.
Why does S&P Global (SPGI) follow this seasonal pattern?
One likely driver is the way S&P Global’s business lines intersect with the election cycle, as debt issuance, deal-making and risk appetite often recover after midterm-year volatility and ahead of the year before the presidential election. Analysts have pointed to increased demand for analytics and ratings tools when markets reopen and geopolitical uncertainty stabilizes, which can cluster revenue strength in this part of the cycle.[4] The pattern may also reflect institutional portfolio rebalancing and sector rotation into quality compounders as policy visibility improves.
What is driving S&P Global (SPGI) today?
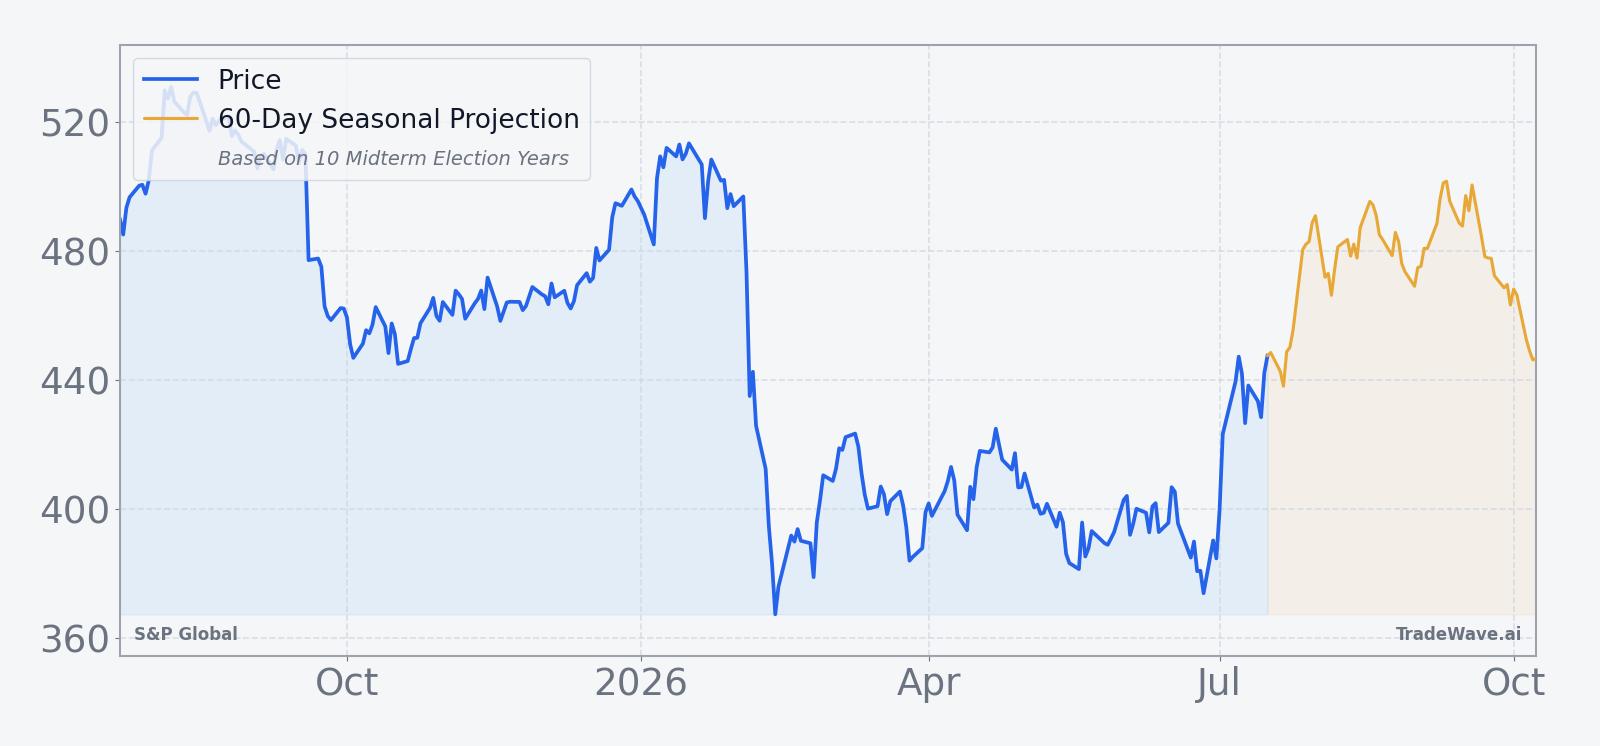
S&P Global closed the latest session at $443.46, down 0.8% on the day, after trading between $440.57 and $450.31 on volume roughly in line with its 20-day average of about 2.8 million shares. The stock is about 13.0% below its 52-week high of $509.70 and roughly 31.0% above its 52-week low of $338.40, leaving it mid-range after a sharp rebound over the past month.
That price action comes after a volatile first half of the year. On Feb 10, 2026, S&P Global cut investor expectations by guiding full-year 2026 adjusted EPS to $19.40 to $19.65, below the average analyst estimate, and the stock dropped as much as the mid-teens in premarket trading around the announcement, reflecting concern that AI-driven disruption could pressure growth even for data-rich incumbents.[3] The company followed with stronger Q1 numbers on Apr 28, reporting revenue up 10% to $4.17 billion and EPS of $4.69, with ratings revenue jumping about 13% as demand for analytics and risk tools stayed firm.[4]
Beyond earnings, S&P Global has tried to position itself on the right side of the AI story. On May 16, it launched StepForward, a $10 million initiative aimed at preparing workers for an AI-enabled workforce, tying the brand to long-term AI adoption and talent development rather than just near-term cost cuts.[6] Earlier this year, a Forbes analysis noted that the stock’s price-to-sales multiple had compressed to roughly 32% below the prior year, suggesting a valuation reset even as margins remained strong.[1]
The chart below situates the latest move in its recent multi-month context and overlays a short-term seasonal projection.
What should traders watch as this seasonal window approaches?
First, the calendar. The new 355-day window begins on Jul 22, placing the bulk of the pattern in the transition from the midterm election year into the year before the presidential election, a phase that has historically been friendlier to risk assets. How S&P Global behaves into that start date, especially after its recent rebound from February’s guidance shock, will shape how much “fuel” is left if the historical seasonality kicks in.
Second, key levels. On the upside, traders will be watching how the stock handles the low-$450s, where it has hesitated recently, and then the band toward the 52-week high near $510. On the downside, the 50-day moving average around $378.57 is a longer-term reference point; in prior midterm-year windows, some of the biggest winners still saw 20% to 25% drawdowns before recovering, so a retest of deeper support would not be unprecedented.
Third, the earnings and policy calendar. Any update to 2026 guidance or commentary on AI-related competitive pressure could either reinforce or challenge the historical pattern, especially if it shifts expectations for ratings and analytics demand.[3][4] At the same time, macro headlines around regulation, fiscal policy and credit conditions into the year before the presidential election will matter for issuance and deal flow, which are core drivers of S&P Global’s revenue mix.
Finally, volatility itself. The February guidance shock showed how quickly the stock can move when expectations reset, with premarket declines reported in the mid-teens to high-teens range around that single event.[3] If similar bursts of volume and price action appear inside the upcoming seasonal window, traders will be watching whether those spikes resolve in line with the historical long bias or mark a break from a 10-for-10 record that has held across four decades of midterm-election-year cycles.
Sources
- Forbes: "S&P Global Stock Now 32% Cheaper: Is It Time To Buy?" (Feb 12, 2026)
- Reuters: "S&P Global forecasts annual profit above estimates on strong demand" (Jul 31, 2025)
- Reuters: "S&P Global forecasts 2026 profit below estimates, shares plunge" (Feb 10, 2026)
- Reuters: "S&P Global reports higher first-quarter profit on demand for analytics products" (Apr 28, 2026)
- Yahoo Finance / Simply Wall St: "S&P Global’s StepForward Ties AI Workforce Push To Long Term Story" (May 16, 2026)
About this seasonal analysis
Seasonal pattern data is sourced from TradeWave.ai, which analyzes historical price behavior across annual calendar windows going back up to 30 years. Read the full data methodology or the book The 100-Year Pattern by Afshin Moshrefi (2026 edition). Past performance of seasonal patterns does not guarantee future results. This article is for informational purposes only and does not constitute investment advice.