ExxonMobil (XOM) Has Rallied in 13 of 14 Midterm Windows Starting Jul 21, Averaging 25.76%
ExxonMobil is heading into a historically powerful 283-day seasonal window even as the stock trades well below its 52-week high, giving energy traders a fresh election-cycle lens on the name.
Price as of Jul 8, 2026: $141.13 (last close).

What is the seasonal pattern for ExxonMobil (XOM)?
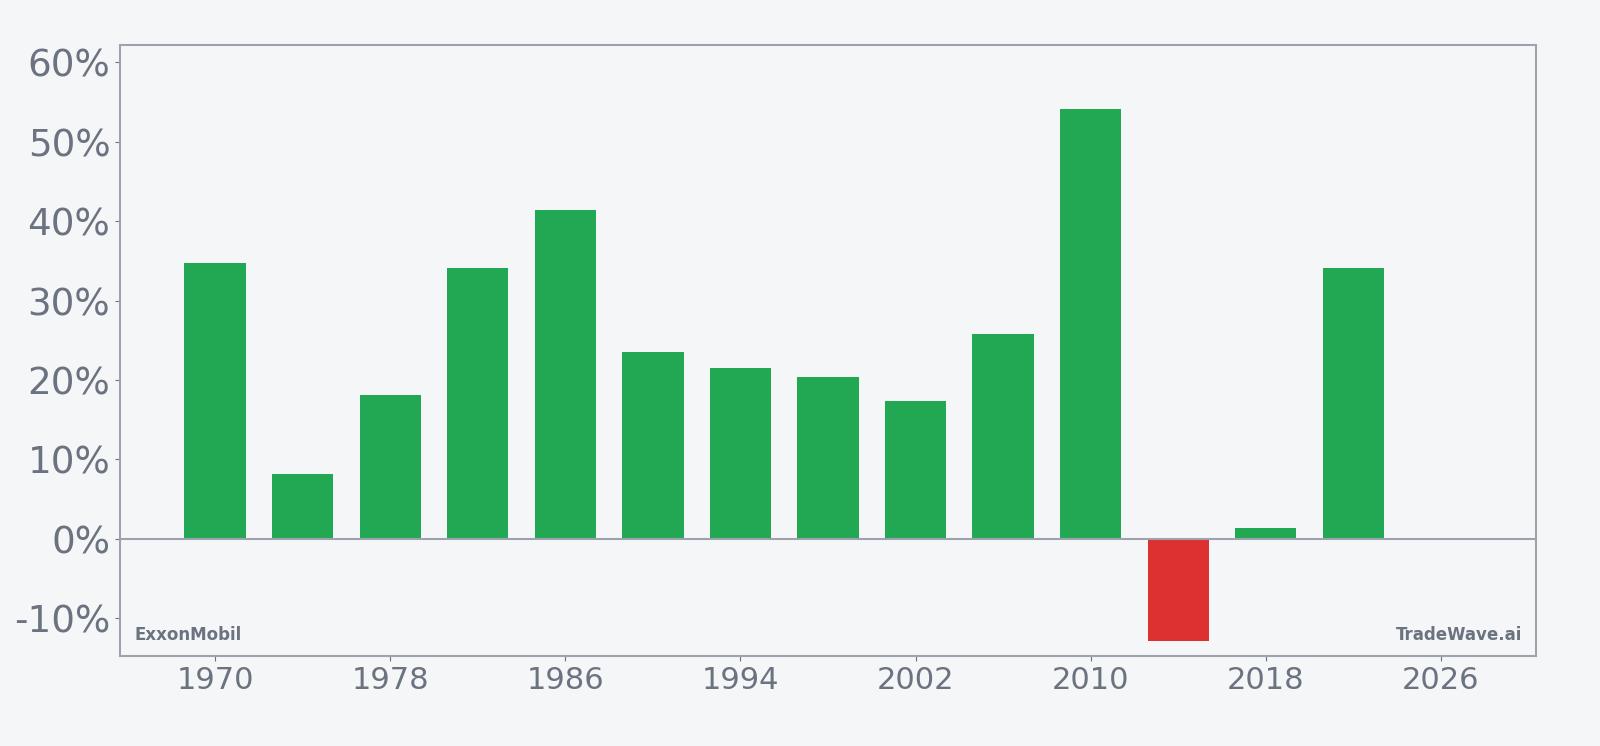
ExxonMobil has risen in 13 of 14 midterm-election-year windows starting around Jul 21, with an average gain of 25.76% in winning years.
Key seasonal stats for the upcoming XOM window
- 13-for-14 record in this window, with winning years averaging 25.76% gains and only one losing year.
- Percent Profitable is 93%, with 13 winners and 1 loser across the last 14 midterm election years.
- The 283-day window begins Jul 21 and historically aligns with late-midterm into pre-election year strength for ExxonMobil.
- Including all years, the average outcome is a 23% gain, reflecting how the single down year drags on otherwise strong results.
- The worst losing year saw a 12.89% decline, while several strong years posted net returns above 30%, highlighting both upside and drawdown risk.
- Trade Direction is long, with a TradeWave Ratio of 1.57 and a Sharpe ratio of 1.17, pointing to historically favorable risk-adjusted returns in this specific window.
According to historical data from TradeWave.ai, this midterm-election-year stretch has behaved very differently from an average calendar year for ExxonMobil. The next section walks through how that pattern has played out and where the risks have clustered.
How has ExxonMobil (XOM) traded in this midterm-year window?
ExxonMobil has risen in 13 of the last 14 midterm-election-year windows that start around Jul 21 and run for 283 calendar days, averaging 25.76% gains in the winning years. Shares finished the prior session at $141.13, about 18.9% below their 52-week high of $174.04, after sliding roughly 7.0% over the past month. That combination of a strong historical seasonal trend and a stock trading well off its highs is what has many energy traders circling this upcoming ExxonMobil trading window.
Because this pattern is grouped by the presidential election cycle, it only looks at ExxonMobil’s behavior in the last 14 midterm election years, not in every single calendar year. That matters in 2026 because the market is in a midterm election year today, and this 283-day stretch runs from late in that year into the pre-election year, a phase that has often coincided with shifting policy expectations and sector rotation in energy stocks.
Historically, the trade direction for this window is long. Percent Profitable sits at 93%, with 13 winners and just 1 loser, and the all-years average outcome is a 23% gain across the full 283-day span. The single losing year, 2014, saw a 12.89% decline, which is meaningful but still small relative to the strongest up years that posted net returns above 40%.
Looking at individual cycles, 2010 stands out with a 54.1% net return and a maximum favorable move of 54.53% from entry, while 1986 delivered 41.45% with a best intraperiod run-up of 53.1%. On the softer side, 2018 barely moved, finishing up 1.38% despite an 8.43% peak gain at one point, and 1998 still ended higher by 20.39% even after an 11.67% drawdown during the window. That mix shows how often ExxonMobil has managed to claw back from mid-window volatility to finish the period in positive territory.
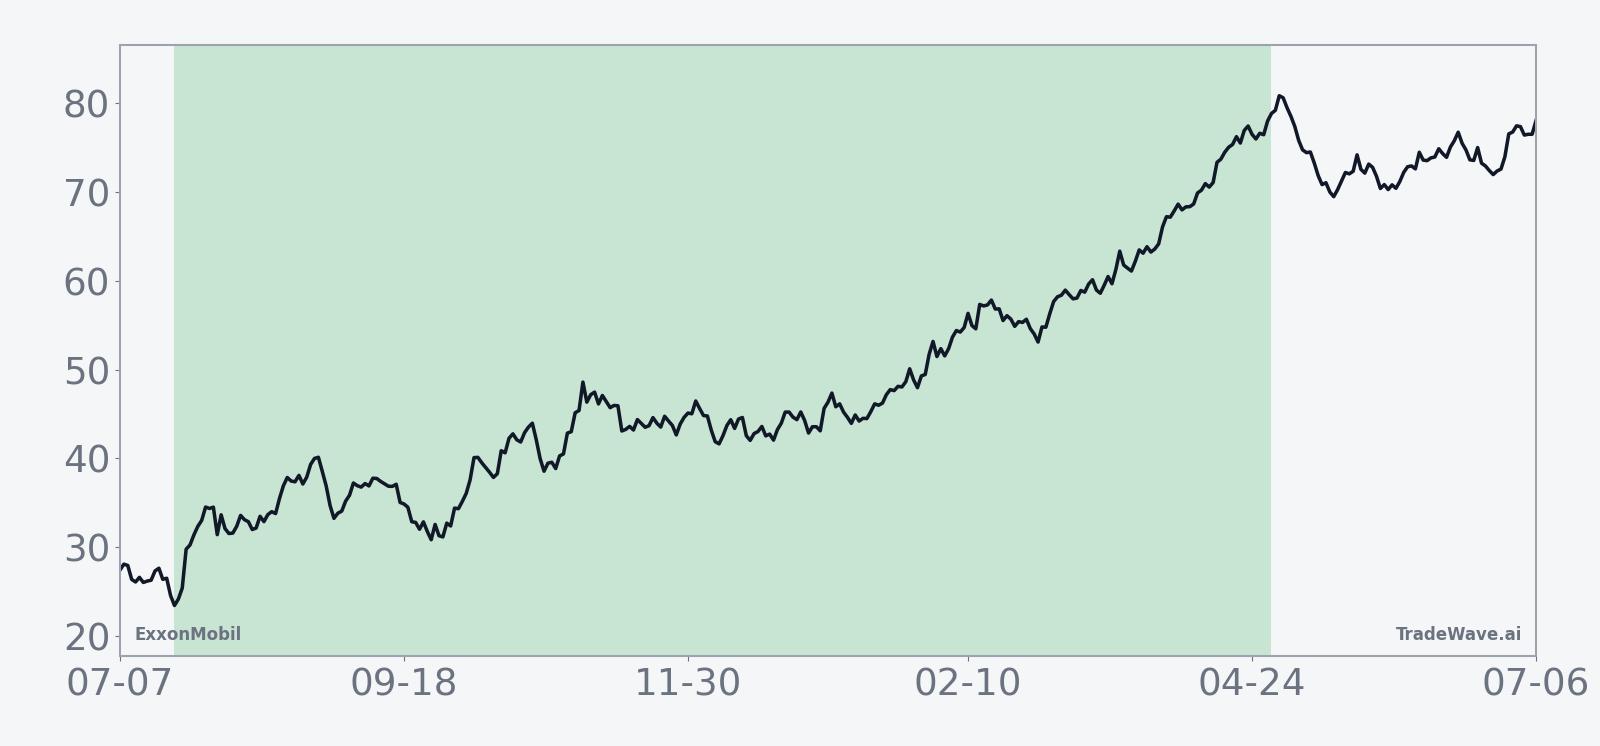
The historical seasonal average trend for this window tilts higher almost from the start, with gains tending to build steadily rather than in a single burst. The typical path shows early strength after the late-July entry, some choppiness in the middle of the window, and then another leg higher as the calendar transitions into the pre-election year, echoing the broader pattern of risk appetite often improving ahead of presidential votes.
Year-by-year net returns and intraperiod swings show how upside and downside have coexisted inside this bullish seasonal trend.
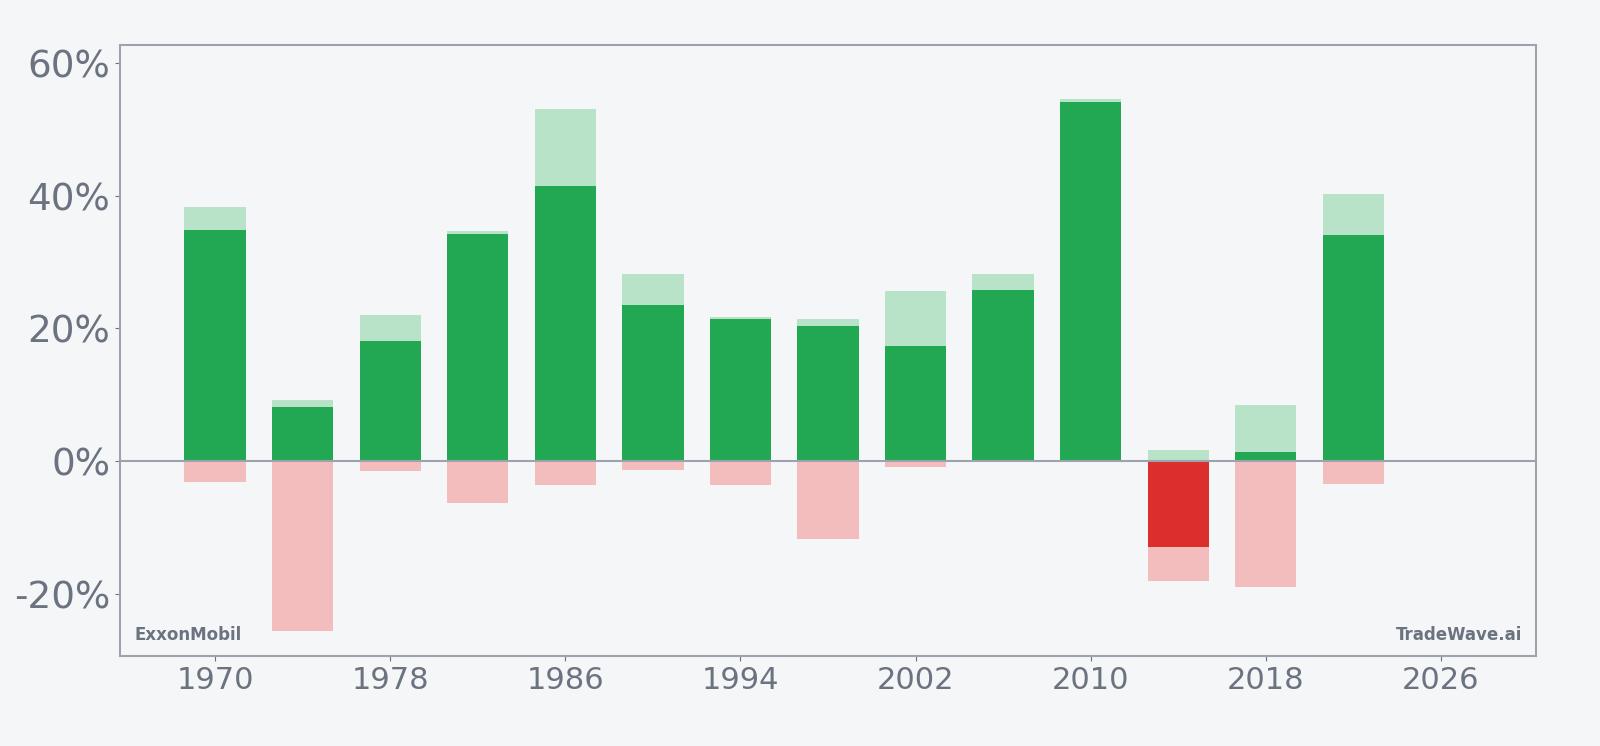
The combined net/MFE/MAE view shows that in most years ExxonMobil has enjoyed sizable peak run-ups while keeping worst drawdowns relatively contained, but there are exceptions. In 2014 and 2018, for example, the maximum adverse moves reached roughly 18% even though one of those years still finished slightly positive, underscoring that intraperiod downside can be sharp before the longer window plays out. The TradeWave Ratio of 1.57 captures how far price has typically traveled in the long direction during the window, while the Sharpe ratio of 1.17 points to historically favorable risk-adjusted returns for this specific seasonal setup.
Put simply, this has been a remarkably friendly window for long exposure in ExxonMobil: 13 winners out of 14, strong average gains, and a tendency for rallies to build as the midterm year gives way to the pre-election year.
Why does ExxonMobil (XOM) follow this seasonal pattern?
One likely driver is the way the presidential election cycle shapes expectations for energy policy, drilling permits and regulation, which can influence integrated oil and gas valuations as midterm years roll into pre-election years. Analysts have also pointed to the clustering of capital spending decisions, project ramp-ups in places like Guyana and the Permian, and year-end portfolio rebalancing that can favor large, cash-generative energy names in this phase of the cycle.[2] The pattern may also reflect how crude price expectations and OPEC+ production decisions often stabilize after early-cycle volatility, giving integrated majors a smoother backdrop later in the midterm year.[2]
History does not guarantee future results; adverse excursions (MAE) can be large even in winning windows.
What is driving ExxonMobil (XOM) today?
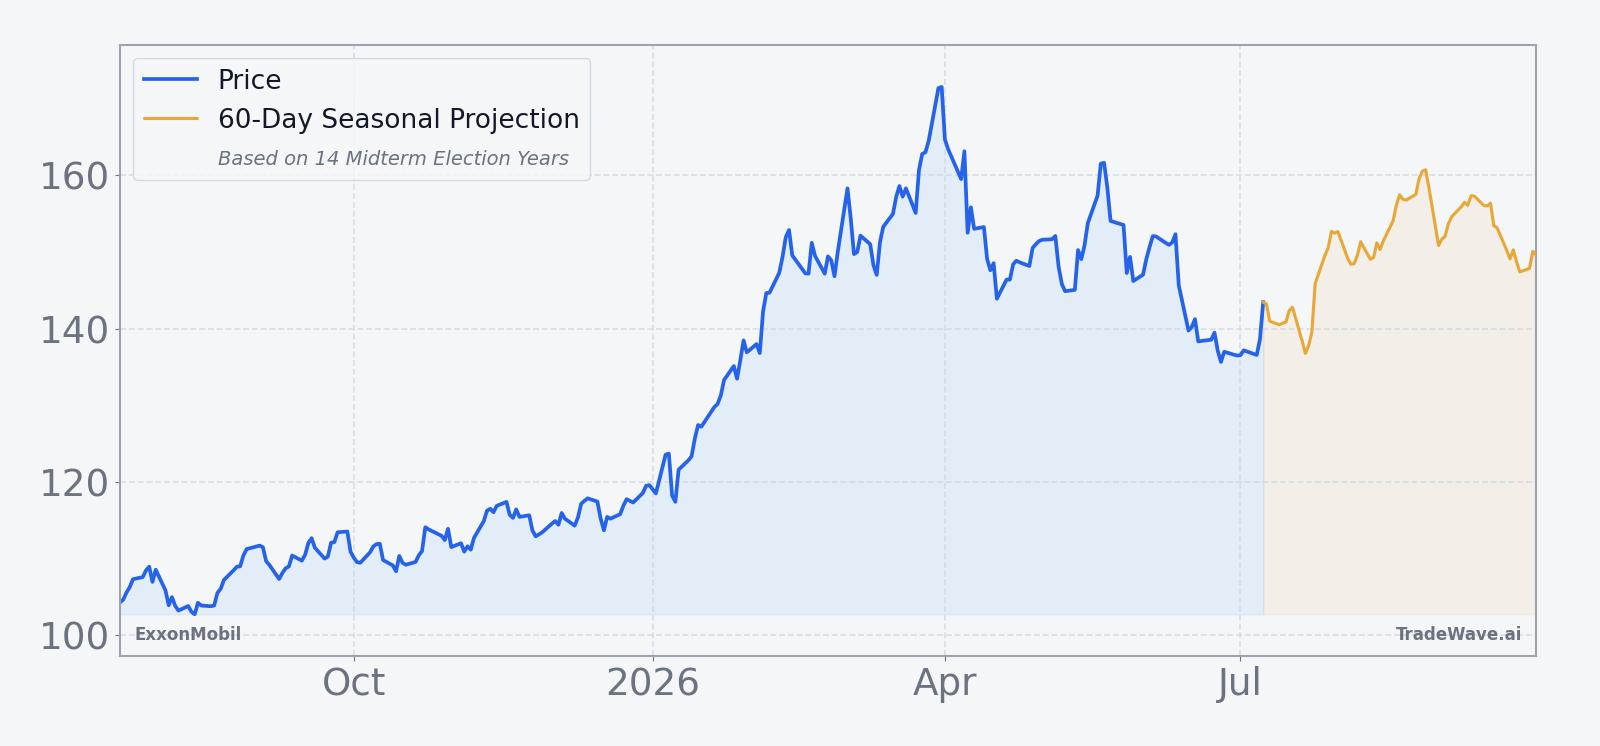
ExxonMobil closed the prior session at $141.13, down 0.4% on the day, extending a roughly 7.0% slide over the past month and leaving the stock about 18.9% below its 52-week high of $174.04. Trading volume of about 18.2 million shares was close to the 20-day average near 18.4 million, and the stock now sits under its 50-day moving average around $146.74, a sign that near-term momentum has cooled even as the longer-term uptrend from 2022 remains intact.
In Aug 2025, Exxon reported Q2 2025 earnings of $1.64 per share on $79.34 billion in revenue, beating EPS expectations even as lower oil and gas prices weighed on year-over-year profit comparisons.[1] By Oct 2025, Q3 results again topped adjusted EPS forecasts, helped by record production in Guyana and the Permian Basin, though headline earnings were still pressured by softer crude prices and higher OPEC+ output.[2] Those reports framed a story of an integrated major using cost cuts and high-quality upstream growth to offset a tougher price tape, a backdrop that still resonates as investors weigh how much of that execution is already in the stock.
Macro-wise, 2025 coverage from CNBC and Reuters highlighted how lower oil prices and increased OPEC+ production had pushed sector earnings to their lowest point since the pandemic, even for giants like Exxon.[2] Sector commentary also emphasized refining margins, structural cost savings and upstream growth as key drivers for integrated oil and gas performance, themes that remain central as traders look ahead to the next leg of the cycle.[1] With Exxon having raised its 2030 plan for earnings and cash flow growth in late 2025, the stock now sits at the intersection of cyclical commodity pressure and a more ambitious long-term capital return story.[1]
The chart below situates the latest pullback against ExxonMobil’s past year of trading and a short-term seasonal projection.
What should traders watch as this ExxonMobil seasonal window approaches?
First, the calendar: the 283-day window begins on Jul 21, so price action in the next couple of weeks will set the entry level for this historically strong midterm-year stretch. Traders will be watching whether XOM can reclaim its 50-day moving average and stabilize above the recent low near $139.81, or whether the stock continues to drift lower into the start of the window.
Second, the policy and macro calendar matters. As the midterm election year moves toward its back half and into the year before the presidential election, any shifts in rhetoric around drilling, emissions rules or windfall taxes could influence how closely this cycle tracks the historical pattern. Oil price headlines and OPEC+ production decisions will remain key tells for whether integrated oil and gas names can repeat the kind of double-digit gains seen in prior midterm-year windows.[2]
Third, behavior inside the window will be the real test of the historical seasonality. If ExxonMobil starts to build a series of higher highs and higher lows after late July, with pullbacks that resemble the typical intraperiod drawdowns seen in past cycles, that would be consistent with the long-biased seasonal trend. A deeper or more persistent slide, especially one that undercuts the prior 52-week low, would signal that this midterm-year pattern is breaking down and that macro or company-specific forces are overwhelming the usual election-cycle rhythm.
Finally, traders should keep an eye on upcoming earnings and capital allocation updates, since prior cycles have shown that strong cash generation, disciplined spending and visible shareholder returns can help ExxonMobil outperform even when crude prices are not at their peak.[1] Add it up, and this is a window where both the calendar and the company’s own execution history argue for elevated attention, even if the past 14 cycles cannot promise a repeat.
Sources
About this seasonal analysis
Seasonal pattern data is sourced from TradeWave.ai, which analyzes historical price behavior across annual calendar windows going back up to 30 years. Read the full data methodology or the book The 100-Year Pattern by Afshin Moshrefi (2026 edition). Past performance of seasonal patterns does not guarantee future results. This article is for informational purposes only and does not constitute investment advice.