Pilgrim's Pride (PPC) Has Fallen in 9 of 9 Midterm July Windows, Shorts Averaged 7.59%
Pilgrim's Pride is trading just above its 52-week low as it approaches a midterm-year July seasonal window that has historically favored short sellers with consistent downside moves.
Price as of Jul 15, 2026: $28.42 (last close).

What is the seasonal pattern for Pilgrim's Pride (PPC)?
Pilgrim's Pride has fallen in 9 of 9 midterm-election-year July windows during this 14-day stretch, with an average gain of 7.59% in winning short trades.
- 9 for 9 in this window, with short trades averaging 7.59% gains across the last nine midterm election years.
- The upcoming 14-day Pilgrim's Pride trading window starts Jul 23, 2026 and has historically favored downside moves.
- Percent Profitable is 100%, with 9 winners and 0 losers for the short-side seasonal pattern.
- Average winner profit of 7.59% comes with a TradeWave Ratio of 2.41, indicating meaningful travel in the trade direction inside the window.
- The Sharpe ratio of 1.46 reflects strong risk-adjusted returns for the pattern, even with intraperiod volatility.
- Historical drawdowns show that adverse moves against the short can still be sizable, so risk management has mattered even in this perfect record.
According to historical data from TradeWave.ai, this midterm-election-year July stretch has behaved very differently from an average month for Pilgrim's Pride, and the next iteration is just days away.
How has Pilgrim's Pride (PPC) traded in this midterm-year July window?
Pilgrim's Pride has delivered winning short trades in all 9 midterm-election-year July windows in this 14-day pattern, averaging 7.59% gains for bears. The stock finished the prior session at $28.42, up 0.7% on the day and sitting about 40.4% below its 52-week high of $47.70 while hovering 7.3% above its 52-week low of $26.50. That combination of a clean seasonal record and a stock already trading in the lower part of its yearly range makes this upcoming window a notable test of the PPC seasonal trend.
Grouping the data by the presidential election cycle matters here because midterm election years often bring shifting policy expectations, food-cost debates and positioning changes in consumer staples, which can all affect meat producers like Pilgrim's Pride. This pattern focuses specifically on the mid part of the midterm year, when Washington’s fiscal and regulatory agenda is clearer but the pre-election-year optimism has not yet kicked in.
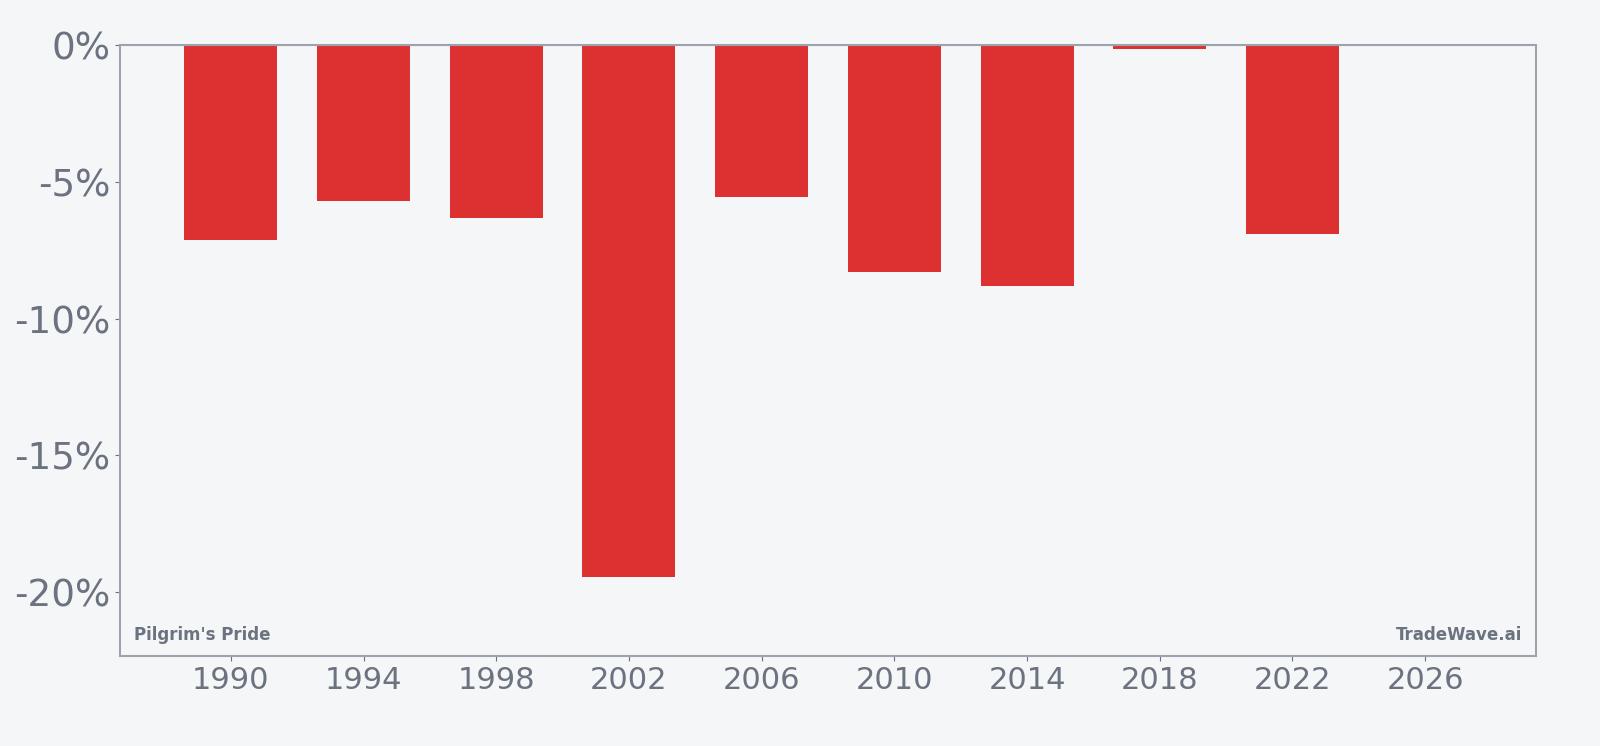
Across the last nine midterm election years, every instance of this 14-day July window has seen PPC finish lower, which is favorable for the short trade direction that this pattern tracks. Average winner profit of 7.59% sits alongside a median profit of 6.92%, suggesting the distribution of outcomes has been relatively tight around a solid downside move rather than driven by a single outlier year. The cumulative return across all nine cycles is 91%, and the annualized return of 7.49% reflects how this short window has stacked up over time when viewed as a repeating tactical trade.
The per-year table shows that 2002 was the standout for bears, with a net return of -19.43% for the stock and a maximum adverse move against the short of -19.43% as well, meaning the stock never staged a meaningful squeeze during that window. In contrast, 2018 was the mildest iteration, with PPC slipping just -0.17% by the close even though the maximum favorable move for shorts reached 2.66% at one point. Add it up and the pattern has not produced a single losing year for the short side, but the size of the swings has varied from modest drifts lower to double-digit drops.
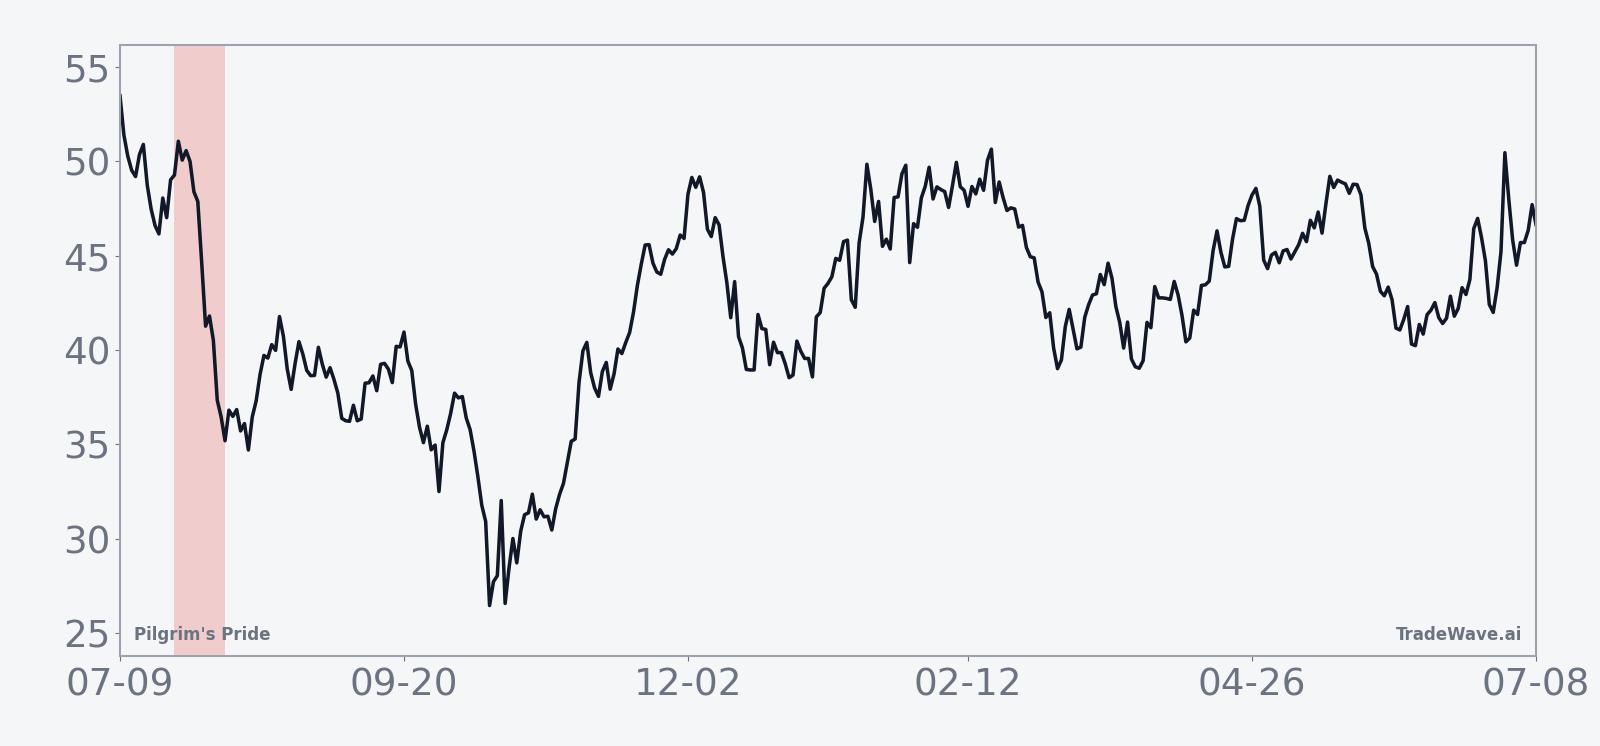
The historical seasonal average suggests that much of the downside for PPC in this window has tended to accrue fairly steadily rather than in a single gap move. The trend line slopes lower across the 14 days, which fits a picture of pressure building as the window progresses instead of a one-day shock that quickly reverses.
Year-by-year bars that include both peak favorable and worst adverse moves help show how much the stock has swung inside the window before settling at the final result.
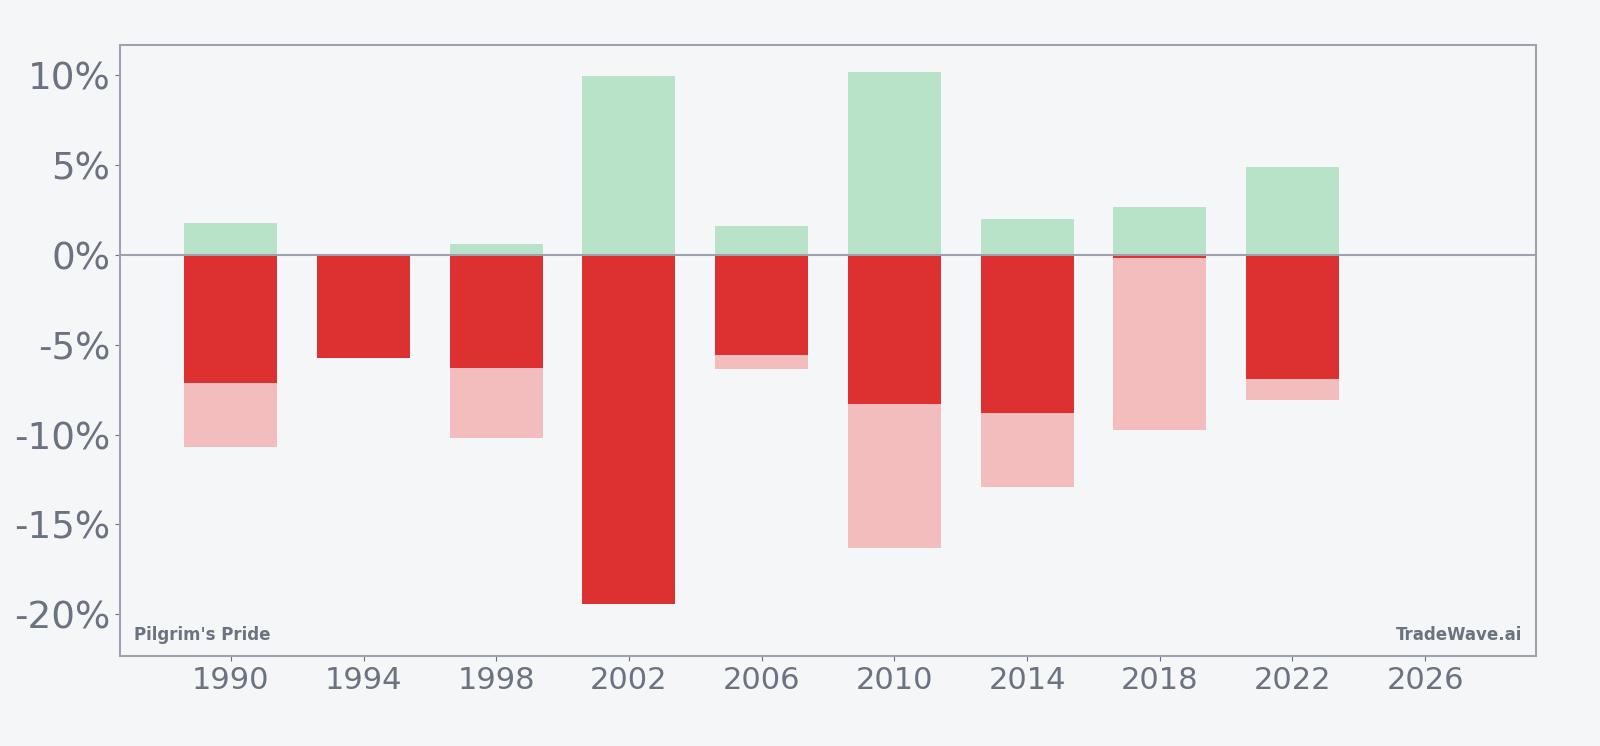
The stacked net, maximum favorable excursion and maximum adverse excursion bars show that even in winning short years, PPC has often moved sharply in both directions inside the window. In 2010, for example, the stock’s net move was -8.30%, but the maximum favorable move for shorts reached 10.16% while the worst drawdown against the position was -16.31%, underscoring that squeezes have been part of the story even when the final outcome favored bears. The Sharpe ratio of 1.46 and TradeWave Ratio of 2.41 capture this balance of strong directional edge with meaningful volatility along the way.
History does not guarantee future results; adverse excursions can be large even in winning windows, so traders using this pattern have historically needed to manage risk tightly.
Why does Pilgrim's Pride (PPC) follow this seasonal pattern?
One likely driver is the way midterm election years shape expectations for food costs, agricultural policy and consumer spending, which can all influence sentiment toward meat producers in midsummer. Analysts have pointed to shifting demand toward lower-cost proteins like chicken when budgets are tight, which can support fundamentals but still leave stocks vulnerable to position resets around policy headlines and earnings timing.[1] This midterm-year July window may reflect institutional portfolio repositioning in consumer staples and protein names as investors balance defensive demand with evolving views on regulation and input costs.
What is driving Pilgrim's Pride (PPC) today?
Pilgrim's Pride shares closed the prior session at $28.42, up 0.7% on the day, with roughly 2.1 million shares changing hands against a 20-day average volume of about 1.67 million. The stock is trading well below its 52-week high of $47.70 and only modestly above its 52-week low of $26.50, a backdrop that leaves plenty of room on either side of the current price as the seasonal window approaches.
Fundamentally, the most recent reported quarter showed Pilgrim's Pride benefiting from consumers favoring chicken as an affordable source of protein, which supported higher sales and profitability.[1] In that Q2 2025 report, the company logged profit of $355.5 million, or $1.49 a share, up from $326.3 million, or $1.37 a share, a year earlier, with adjusted earnings of $1.70 per share described as ahead of expectations.[1] The sector backdrop has been similar, with demand shifting toward lower-cost proteins like chicken, helping the company’s margins even as broader food inflation and consumer budget pressures remain in focus.[1]
The chart below situates the latest move in its recent multi-month context and overlays a 60-day seasonal projection for additional perspective.
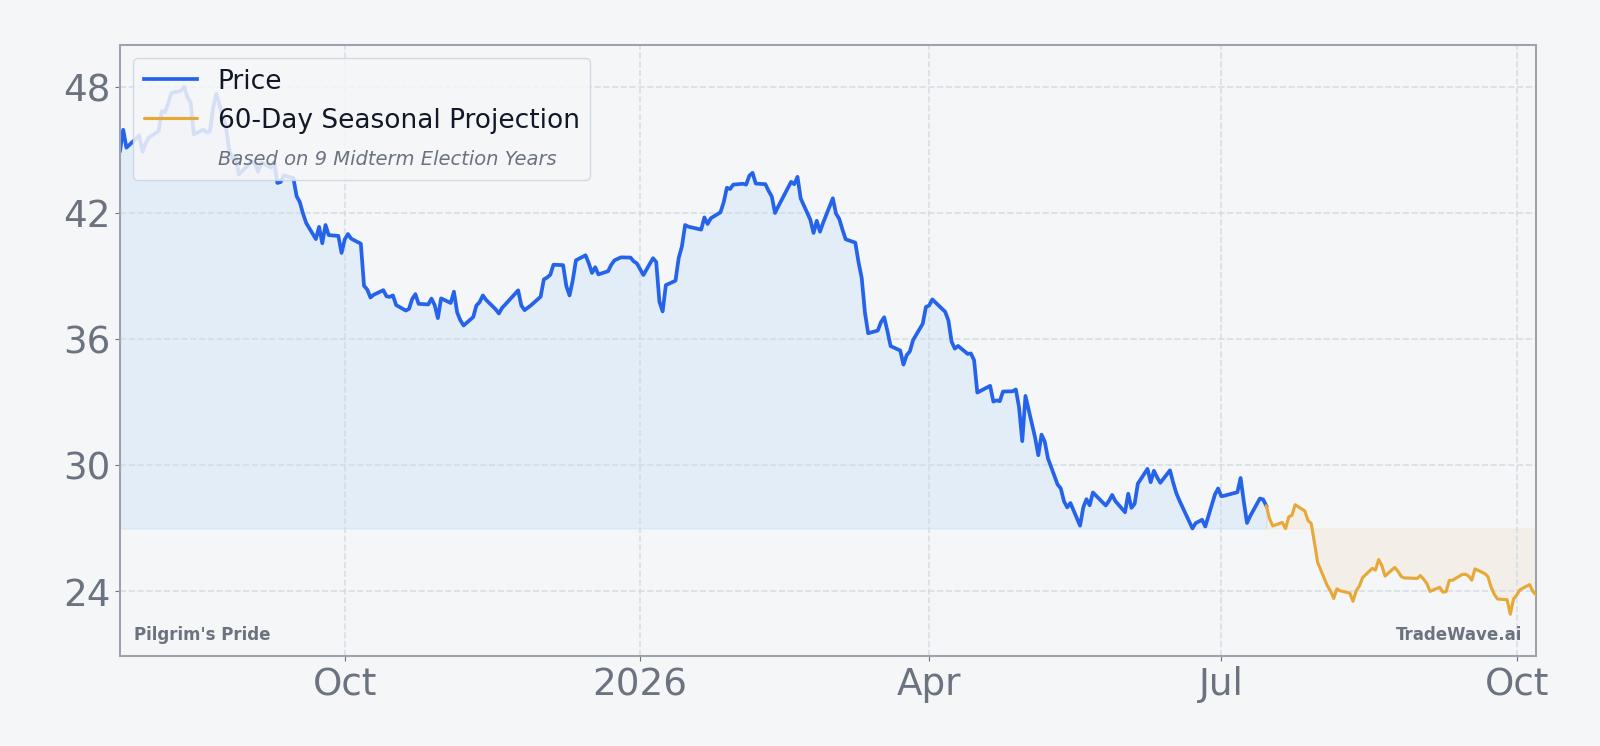
From a trading perspective, PPC’s 50-day simple moving average sits near $28.65, almost exactly in line with the latest close, which suggests the stock is consolidating after a pullback rather than trending strongly in either direction. One-month performance of -2.13% fits that picture of a gentle drift lower rather than a sharp breakdown, leaving the upcoming seasonal window as a potential catalyst for either renewed downside or a challenge to the historical pattern. With average daily volume elevated relative to longer-term norms and the stock sitting in a value zone compared with its 52-week high, how traders respond to any fresh macro or protein-demand headlines around late July could determine whether this midterm-year pattern extends its perfect record.
Sources
About this seasonal analysis
Seasonal pattern data is sourced from TradeWave.ai, which analyzes historical price behavior across annual calendar windows going back up to 30 years. Read the full data methodology or the book The 100-Year Pattern by Afshin Moshrefi (2026 edition). Past performance of seasonal patterns does not guarantee future results. This article is for informational purposes only and does not constitute investment advice.