Intuit (INTU) Has Rallied in 7 of 7 Midterm Windows From Jul 18, Averaging 20.06% Gains
Intuit is heading into a historically powerful 332-day midterm-year seasonal window just as the stock trades more than 60% below where it started 2026, raising the stakes for a bruised software heavyweight.
Price as of Jul 15, 2026: $279.70 (last close).

What is the seasonal pattern for Intuit (INTU)?
Intuit has risen in 7 of 7 midterm-election-year windows starting around Jul 18, with an average gain of 20.06% in winning years.
- 7 for 7 in this window, with winning years averaging 20.06% gains across a 332-day stretch.
- Seasonal window begins Jul 18, 2026 and runs roughly through mid-June 2027, covering the late midterm year into the pre-election year.
- Percent Profitable is 100%, with 7 winners and 0 losers across the last seven midterm-election-year cycles.
- Cumulative return across those seven windows totals 251%, with a Sharpe ratio of 1.58 for the long setup.
- The TradeWave Ratio of 2.01 signals that price has typically traveled meaningfully in the trade direction within the window, even before final outcomes.
- Individual years have seen sharp swings, including maximum adverse moves as deep as about 59.62% before finishing higher.
According to historical data from TradeWave.ai, this upcoming stretch for Intuit behaves very differently from an average year on the calendar. The next section walks through how that election-cycle pattern has played out in prior midterm years.
How has Intuit (INTU) traded in this midterm-year seasonal window?
Intuit has posted gains in all seven prior midterm-election-year windows that start around Jul 18 and run for 332 trading days, averaging 20.06% per cycle. Shares finished Thursday at $279.70, down 1% on the day and roughly 61% lower year to date as investors digest restructuring and a sharp reset in software valuations.[2][4]
Because this pattern is grouped by the presidential election cycle, it only looks at midterm-election years, which tend to feature policy uncertainty, shifting tax expectations and heavier regulatory noise for financial software names. The current calendar year is a midterm election year, so the upcoming window sits in the late part of that phase and stretches into the year before the presidential election, when risk appetite has often improved for growth stocks.
Historically, the trade direction for this Intuit trading window has been long, and the record is unusually clean. Percent Profitable is 100%, with 7 winners and 0 losers, and the cumulative gain across those seven midterm-year windows is 251%. Average profit of 20.06% means that in a typical winning year, Intuit has added roughly one-fifth to its value between late July of the midterm year and the end of the window in the following pre-election year.
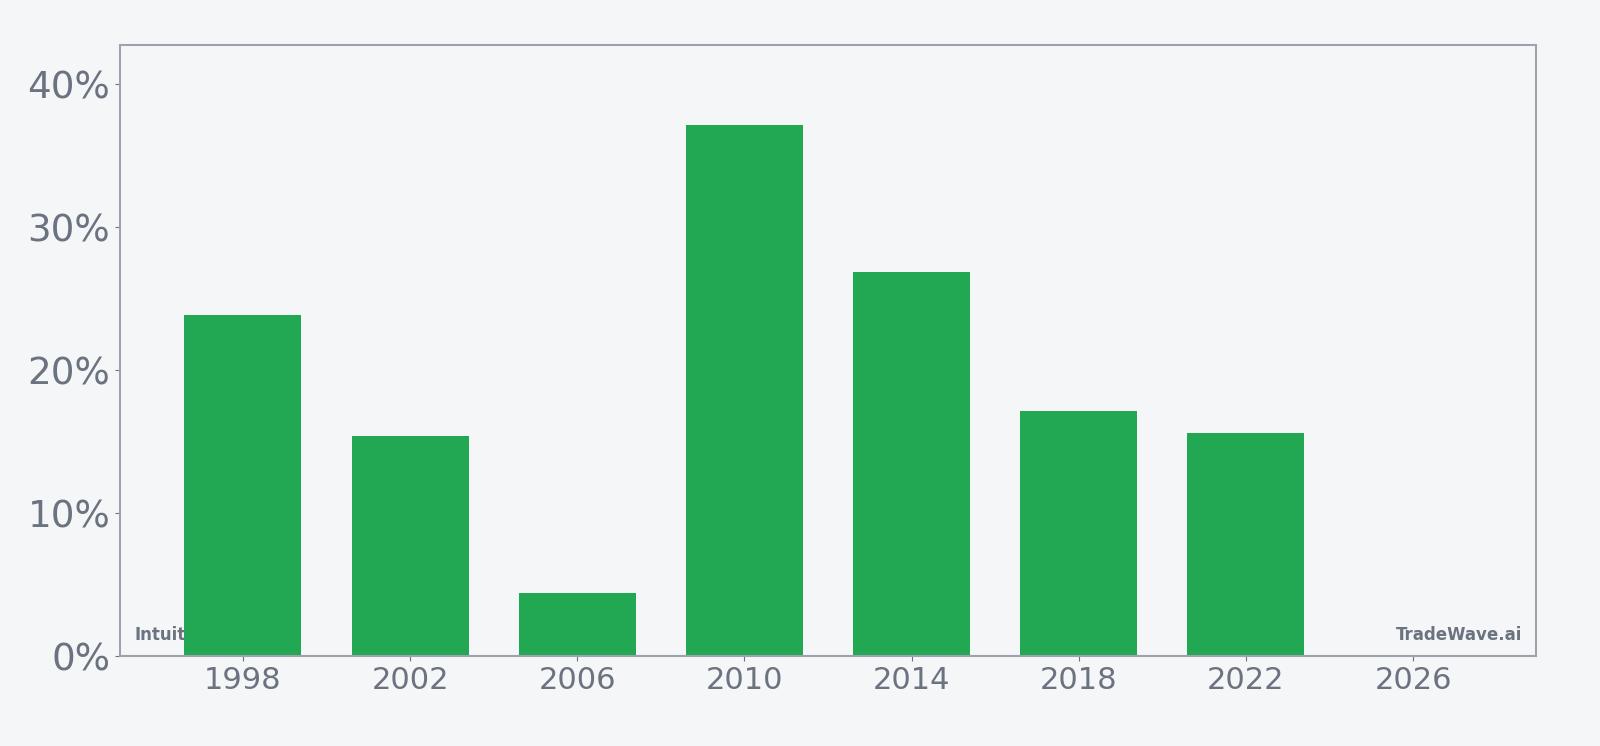
The per-year table shows how that has played out in individual cycles. The weakest outcome in this sample was 4.40% in 2006, while the strongest was a 37.14% gain in 2010, with other years like 1998, 2014 and 2022 landing in the mid-teens to mid-20s. Add it up and the pattern has favored patient long exposure in this specific midterm-to-pre-election stretch.
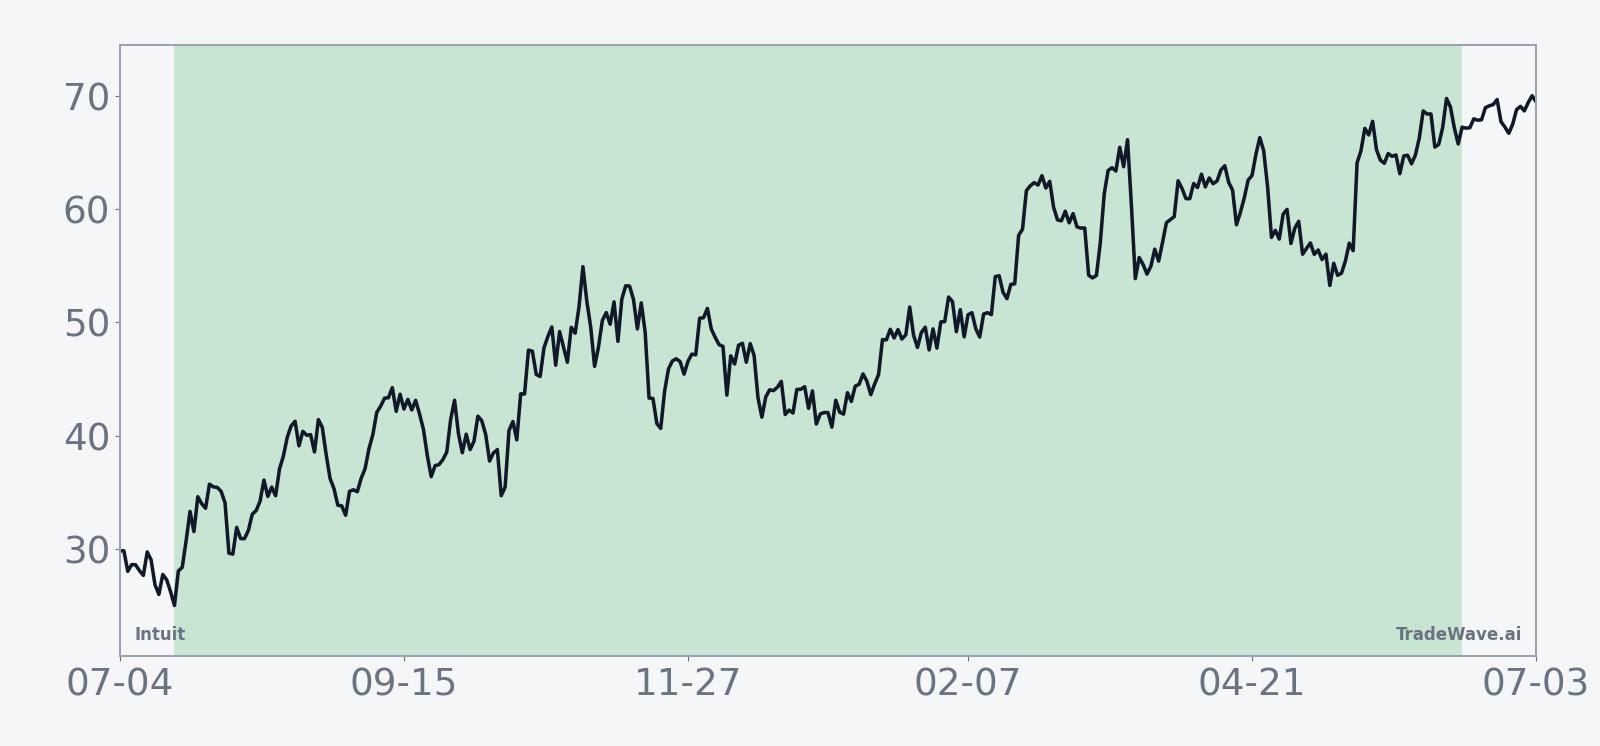
The historical seasonal trend chart suggests that gains have not arrived in a straight line. In several cycles, Intuit has chopped sideways early in the window before building momentum later in the period, especially as the calendar transitions from the midterm year into the year before the presidential election. That profile fits the broader pattern in U.S. equities, where late-midterm to pre-election periods have often been friendlier to risk assets than the first half of the midterm year.
A second view that layers in best and worst intraperiod swings shows how much room Intuit has historically had to run or stumble inside this window.
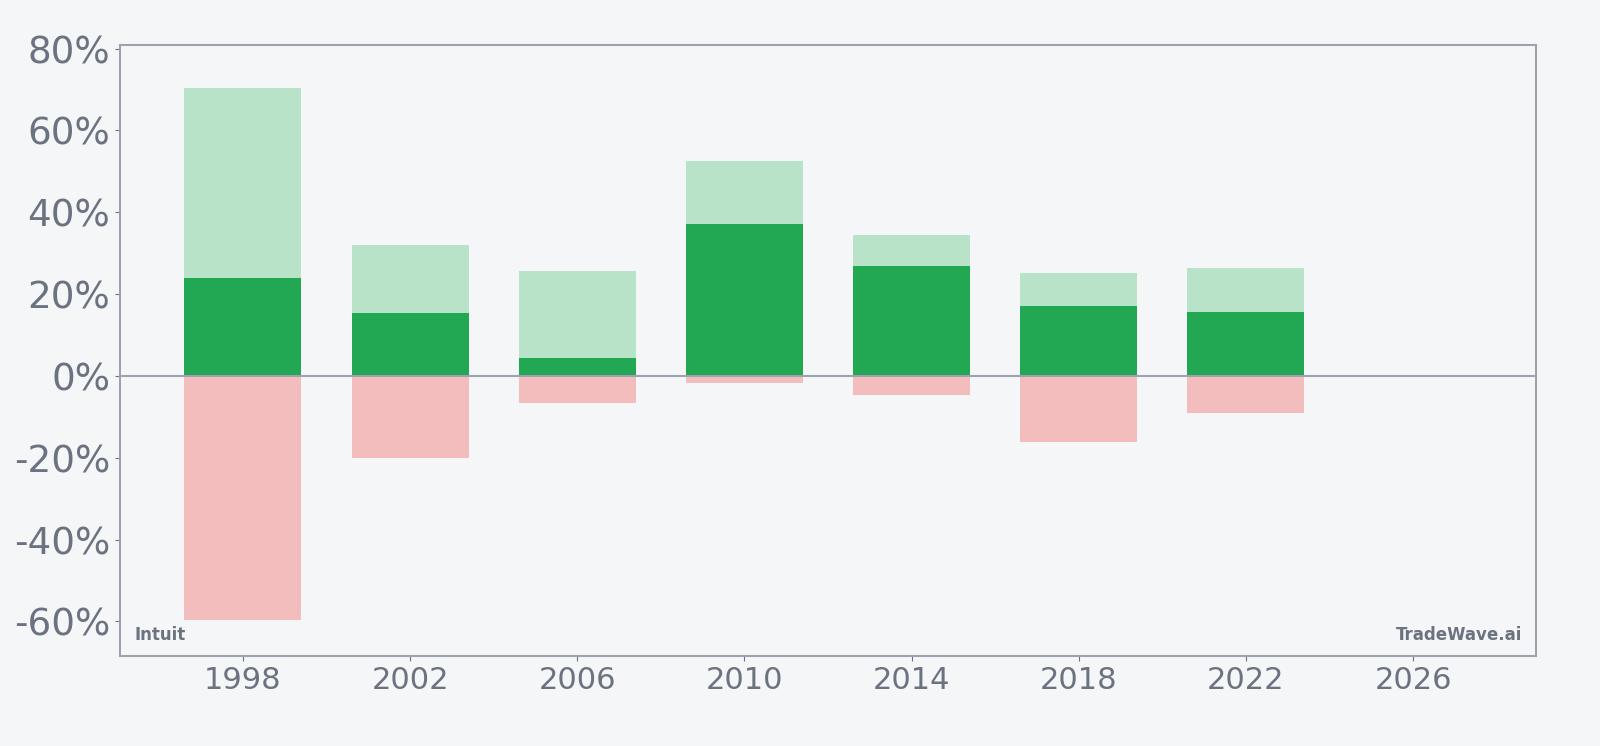
The stacked net, maximum favorable move and maximum adverse move bars underline how volatile this Intuit seasonal trend can be even when it finishes higher. In 1998, for example, the stock ultimately gained 23.85% in the window, but at one point had rallied as much as 70.39% from the entry and at another point had been down 59.62% from that same starting level. Other years show more modest swings, with adverse moves closer to 4% to 20% and favorable runs in the mid-20s to low-50s, but the message is clear: this has been a long-biased window with room for both sharp rallies and deep drawdowns along the way.
History does not guarantee future results; adverse excursions can be large even in winning windows, and traders should treat this seasonal pattern as context rather than a forecast.
Why does Intuit (INTU) follow this seasonal pattern?
One likely driver is the clustering of Intuit’s fiscal-year milestones and tax-season dynamics around this part of the presidential election cycle. The company’s fiscal year and product cadence tie key guidance updates and TurboTax trends to the late midterm and pre-election years, when policy debates on taxes and small-business regulation often intensify.[4][5] This pattern may also reflect institutional portfolio repositioning as investors lean back into quality software and fintech names once early-midterm volatility has passed and the macro backdrop for growth stocks stabilizes.
What is driving Intuit (INTU) today?
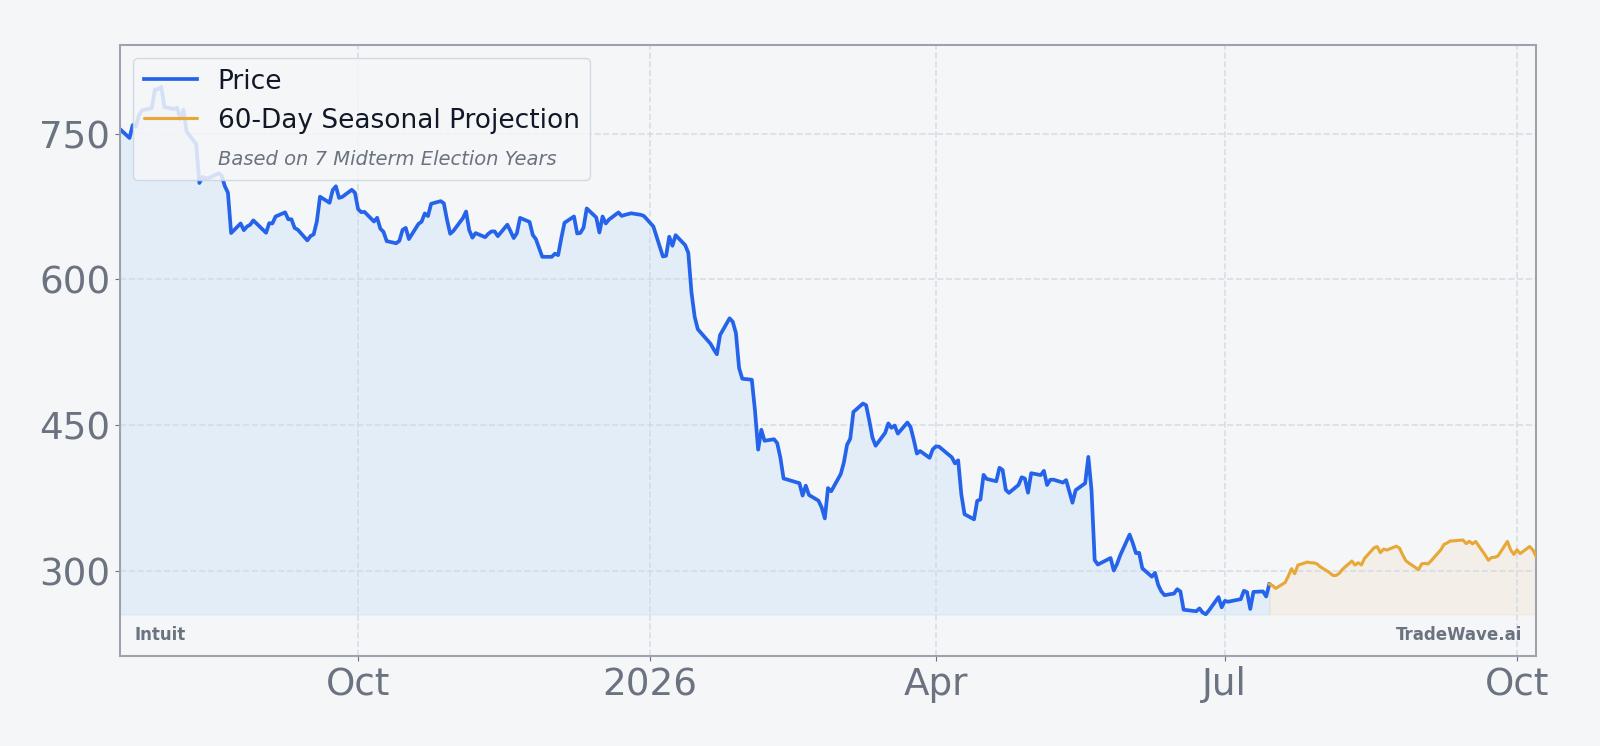
Intuit closed Thursday at $279.70, down 0.97% on the session, after trading between $278.73 and $289.50 on volume of about 3.4 million shares. That leaves the stock roughly 61% lower for 2026, a steep reset for a name that entered the year as a premium software and fintech franchise.[2][4]
The slide has come despite solid fundamental execution. On May 22, Intuit reported fiscal Q3 revenue of $8.56 billion, up about 10.4% year over year and slightly ahead of estimates, with adjusted EPS of $12.80 topping expectations and full-year adjusted EPS guidance raised to a midpoint of $23.83.[2][4] Management also lifted full-year revenue guidance, signaling confidence in the core franchise even as TurboTax growth slowed and investors fretted about AI-driven substitution risk for consumer tax prep.[2][3][5]
At the same time, the company announced a workforce reduction of roughly 3,000 employees, or about 17% of staff, as part of a restructuring aimed at sharpening its focus on AI-driven platforms and higher-margin growth areas.[1][2][4][5] That move, along with reports of insider selling of about $0.5 million in shares over the past three months, has reinforced the sense that Intuit is in the middle of a strategic pivot rather than a steady-as-she-goes expansion phase.[1]
Sector headwinds have added pressure. Software and SaaS names have wrestled with slowing enterprise budgets, tougher comparisons and investor rotation away from richly valued growth stories, a backdrop that has weighed on Intuit even as its small-business and credit platforms continue to grow.[1][2] Concerns that cheaper filing alternatives and AI tools could erode TurboTax’s pricing power have also featured prominently in commentary around the stock’s 2026 slide.[3][5]
The chart below situates the latest move in its recent multi-month context and overlays a short-term seasonal projection.
What should traders watch as this Intuit seasonal window opens?
The immediate catalyst is the calendar itself: the 332-day midterm-year window begins on Jul 18, placing Intuit’s battered share price inside a historically strong seasonal regime just as investors look toward the year before the presidential election. Traders will be watching whether the stock can stabilize above the recent lows and start to mirror the typical pattern of late-window strength seen in prior cycles.
Fundamentally, any updates on the restructuring plan, AI product roadmap and TurboTax engagement will matter, especially given the workforce cuts and concerns about competitive pressure from lower-cost and AI-enabled filing options.[1][2][3][5] Signs that revenue growth and margins can hold up despite the headcount reduction would help validate the long-biased historical seasonality, while fresh disappointments on tax or small-business trends would test it.
On the tape, volume and volatility around earnings or major product announcements will be key tells. The historical maximum favorable and adverse moves inside this window show that when Intuit starts to trend, the swings can be large in both directions, so traders will be looking for whether early-window price action is choppy and sideways or begins to build a more persistent trend.
Finally, positioning and insider behavior bear watching. The recent insider selling was modest in dollar terms but came against a backdrop of restructuring and a sharp share-price reset.[1] If that activity fades and management leans into buybacks or more constructive messaging, it would align more closely with the stock’s long-biased historical seasonal trend. If insider selling or cautious commentary accelerates instead, it would raise the odds that this midterm-year window breaks from its 7-for-7 record.
Sources
- GuruFocus: Intuit Plans Significant Workforce Reduction Ahead of Earnings (May 20, 2026).
- GuruFocus: Intuit (INTU) Cuts Workforce and Adjusts Price Target Amid Mixed Q3 Performance (May 22, 2026).
- Yahoo Finance: INTU Q1 Deep Dive: Workforce Reduction and Assisted Tax Growth Amid Market Contraction (May 22, 2026).
- Yahoo Finance: Intuit shares drop despite Q3 beat on TurboTax weakness (May 21, 2026).
About this seasonal analysis
Seasonal pattern data is sourced from TradeWave.ai, which analyzes historical price behavior across annual calendar windows going back up to 30 years. Read the full data methodology or the book The 100-Year Pattern by Afshin Moshrefi (2026 edition). Past performance of seasonal patterns does not guarantee future results. This article is for informational purposes only and does not constitute investment advice.