Johnson & Johnson (JNJ) Has Rallied in 10 of 10 Aug. 5 Midterm Windows, Averaging 8.99% Gains
Johnson & Johnson is trading around $247 as it heads toward an Aug. 5 seasonal window that has never been negative in midterm election years, giving traders a clear historical backdrop against a busy policy and earnings calendar.
Price as of Jul 15, 2026: $247.02 (last close).

What is the seasonal pattern for Johnson & Johnson (JNJ)?
Johnson & Johnson has risen in 10 of 10 midterm election years during this Aug. 5–125-day window, with an average gain of 8.99% in winning years.
- 10 for 10 in this window, with Johnson & Johnson averaging 8.99% gains across winning years.
- Seasonal window starts Aug. 5 and runs 125 trading days, covering the late midterm year into the approach of the pre-election year.
- Percent Profitable is 100%, with 10 winners and 0 losers across the last 10 midterm election years.
- Median profit of 9.88% and cumulative return of 135% highlight a strong historical bullish bias for this JNJ seasonal trend.
- TradeWave Ratio of 2.35 and Sharpe ratio of 2.44 point to sizable directional moves with favorable risk-adjusted returns in this Johnson & Johnson trading window.
- Individual years still saw meaningful drawdowns inside the window, so timing and risk management have mattered even in an all-winner sample.
According to historical data from TradeWave.ai, this upcoming stretch for Johnson & Johnson behaves very differently from an average quarter in midterm election years, and the next iteration is less than a month away.
How has Johnson & Johnson (JNJ) traded in this midterm-year window?
Johnson & Johnson has risen in all 10 of the last midterm election years during the 125-day window that begins on Aug. 5, posting an average gain of 8.99% and a cumulative return of 135% for long positions. Shares finished Thursday at $247.02, about 8.3% below their 52-week high of $269.43, after a 2.7% drop in the prior session. That combination of a clean 10-for-10 historical record and a stock trading off its highs gives this late-summer seasonal pattern unusual weight for traders mapping the next quarter.
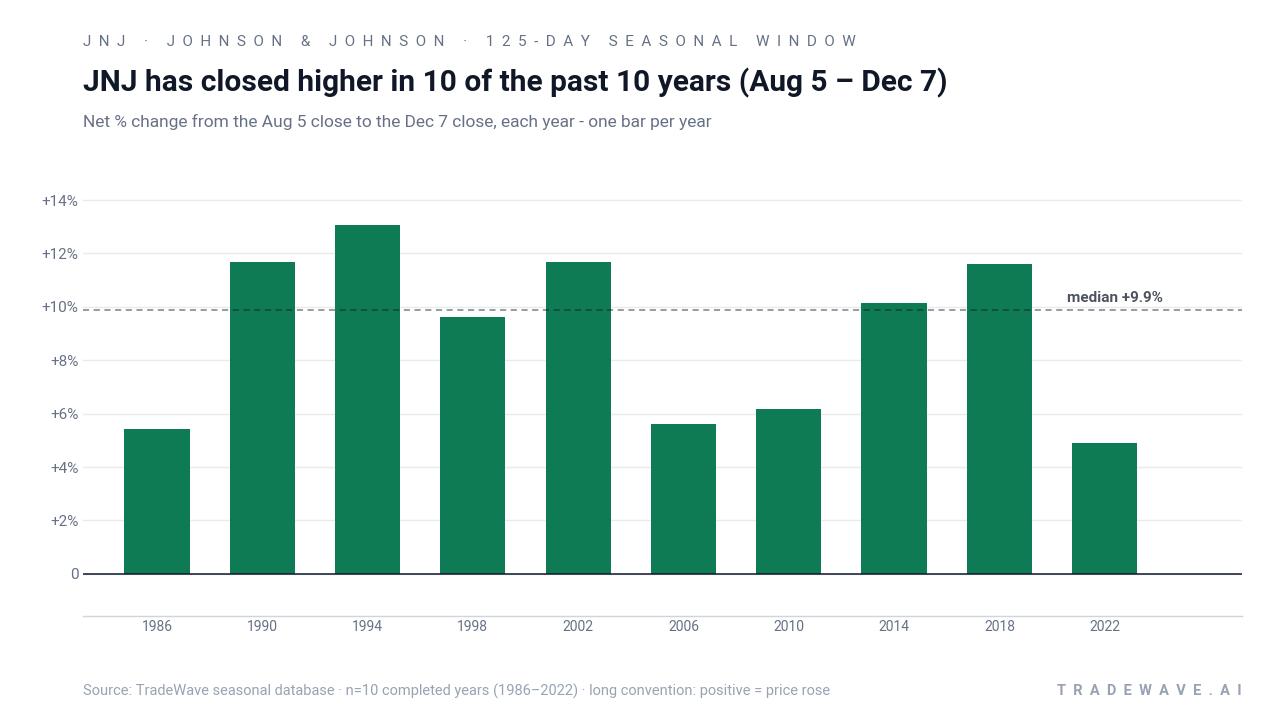
The pattern is built on the last 10 midterm election years, a phase of the presidential cycle that often brings policy noise and sector rotation. Grouping by this cycle matters for a defensive healthcare name like Johnson & Johnson because drug pricing debates, tariff shifts and reimbursement decisions tend to cluster in midterm years, shaping how investors treat large-cap pharma and medtech exposure.
Across those 10 midterm-year windows, every single iteration finished positive for a long JNJ position. The weakest year in the sample, 2022, still delivered a 4.91% net gain, while stronger years such as 1994 and 1998 posted double-digit returns of 13.05% and 9.61% respectively. Add it up: 135% cumulative gains across these ten late-summer-to-year-end windows, all in the same election-cycle phase.
The average winner gained 8.99%, with a median outcome of 9.88%, which tells you the distribution is not being skewed by one monster outlier. Instead, the Johnson & Johnson seasonal trend in this window has been consistently constructive, with most years clustering in a mid- to high-single-digit to low-double-digit range. For a defensive stock, that is a meaningful tailwind layered on top of whatever the broader market is doing.
Intraperiod swings have still been real. Maximum favorable moves, or MFE, ranged from 6.59% in 2022 to 22.8% in 2002, showing that in strong years the stock has often pushed well beyond the final close at some point in the window. Maximum adverse moves, or MAE, which capture the worst drawdown from entry, have run as deep as about -10.55% in 1986 and -8.79% in 1998, even though those years ultimately finished higher. That mix of sizable run-ups and occasional sharp dips is what you would expect from a long pattern with a TradeWave Ratio of 2.35 and a Sharpe ratio of 2.44.
The per-year table also hints at how the pattern behaves inside the window. Several of the stronger years, including 1994 and 2014, show relatively modest MAE alongside solid MFE, suggesting a grind higher with limited downside once the move starts. Others, like 1986 and 1998, saw deeper early drawdowns before recovering into positive territory, a reminder that even a strong historical seasonality can involve uncomfortable volatility along the way.
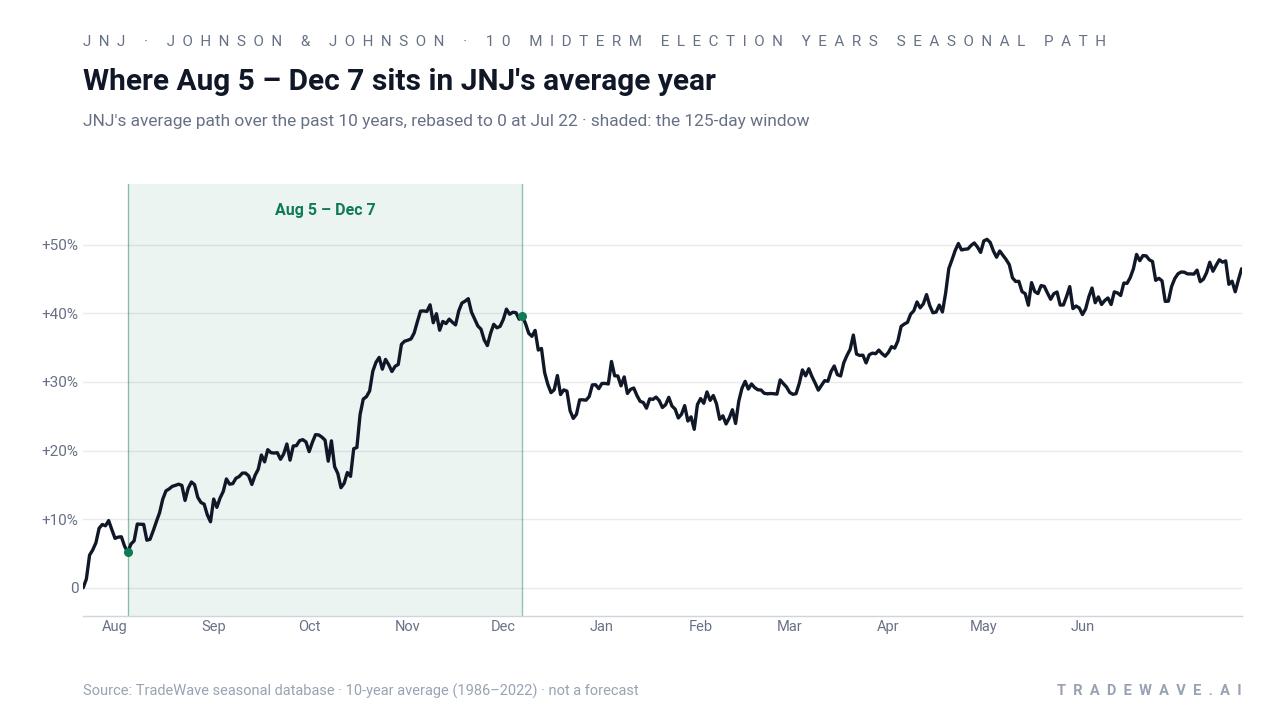
The historical seasonal average curve for this Johnson & Johnson trading window slopes steadily higher, with gains tending to accrue across the full 125 days rather than in a single burst. That profile fits a classic defensive stock pattern: investors gradually add exposure as macro and policy headlines evolve into year-end, rather than chasing a short-lived spike.
A closer look at yearly net returns alongside peak rallies and worst drawdowns shows how consistently the pattern has favored longs while still demanding risk discipline.
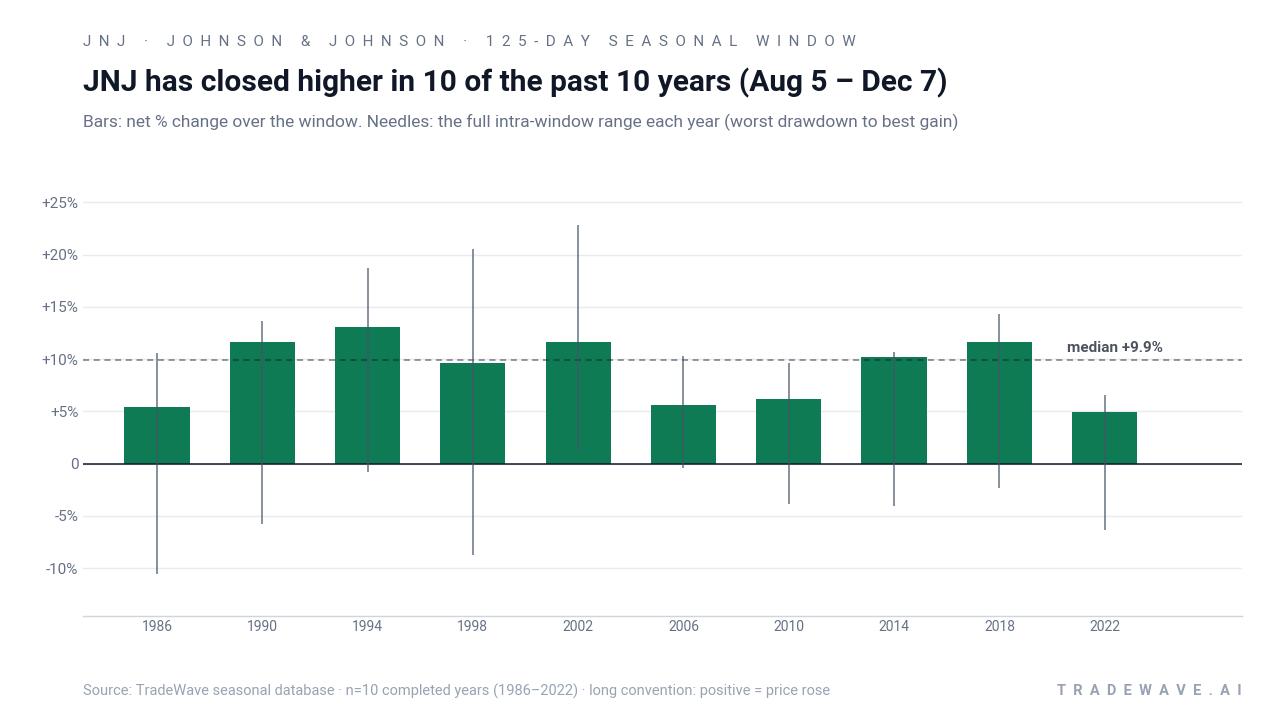
The stacked view of net returns with peak rallies and worst drawdowns makes the pattern’s character clear: every bar finishes above zero, but MAE often stretches several percentage points below the entry before the trade works. In other words, the historical JNJ seasonal pattern has rewarded patience in this window, yet it has not spared traders from interim volatility.
History does not guarantee future results; adverse excursions can be large even in winning windows, so position sizing and risk controls remain critical.
Why does Johnson & Johnson (JNJ) follow this seasonal pattern?
One likely driver is the way healthcare policy and drug pricing debates intensify in midterm election years, prompting institutional investors to rebalance exposure to large, diversified names like Johnson & Johnson as the year progresses. Analysts have also pointed to the company’s earnings calendar, with late-summer and autumn updates often clarifying guidance and pipeline momentum after early-year uncertainty. This pattern may reflect a blend of policy risk fading, portfolio repositioning into defensives, and steady pharma and medtech demand as the market transitions from the midterm year toward the historically stronger pre-election year.
What is driving Johnson & Johnson (JNJ) today?
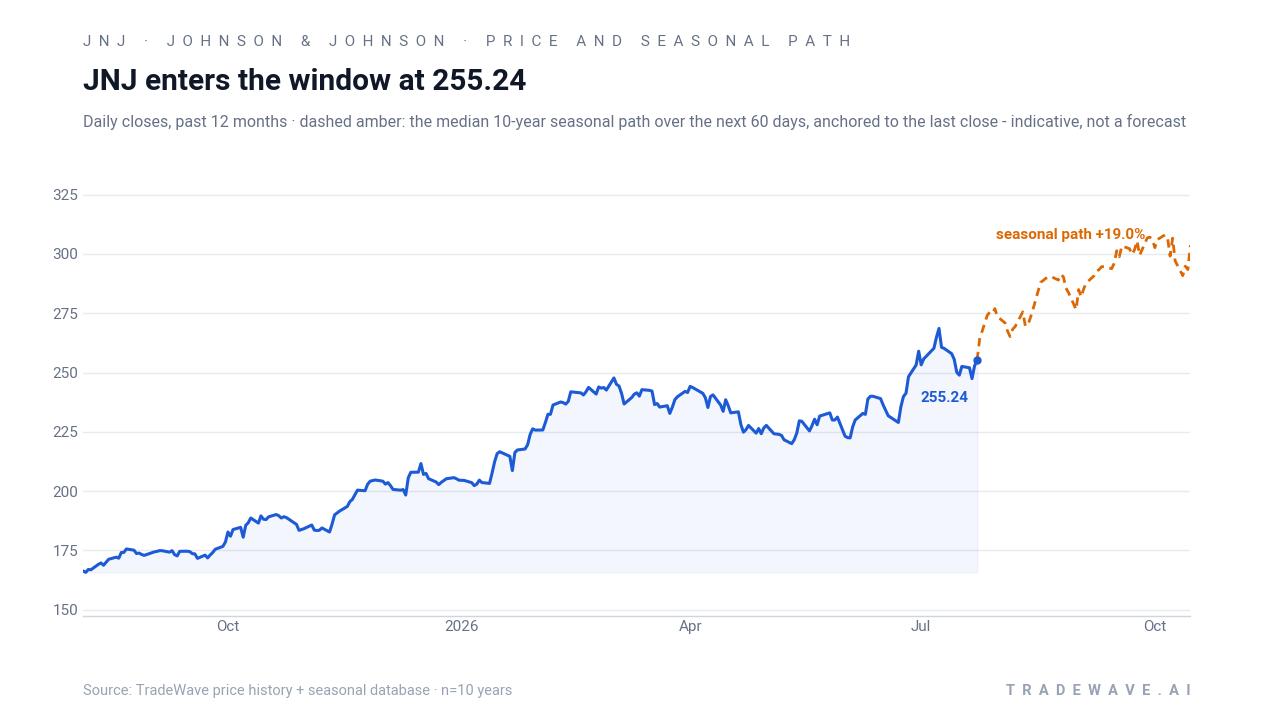
Johnson & Johnson closed the latest session at $247.02, down 2.7% on the day, after trading between $246.05 and $256.83 on volume of about 10.0 million shares. The stock is up 4.82% over the past month and sits about 8.3% below its 52-week high of $269.43, with 20-day average volume around 9.1 million shares and a 50-day moving average near $236.80.
Fundamentally, the story has been about execution in pharmaceuticals offsetting pockets of weakness elsewhere. On Jan. 21, 2026, Johnson & Johnson reported fourth-quarter 2025 results that modestly beat Wall Street estimates and guided 2026 operational sales to roughly $99.5 billion to $100.5 billion, with earnings per share above consensus at the time.[1] In February 2026, analysis highlighted strong growth from oncology and autoimmune drugs such as Darzalex, Carvykti and Tremfya, which have been filling in for Stelara as it faces patent erosion.[2]
More recently, on Jul 15, 2026, the company delivered another earnings beat, posting adjusted second-quarter EPS of $2.90 versus $2.85 expected and pharmaceutical sales of $16.38 billion, ahead of forecasts.[3] Management raised full-year 2026 sales guidance to a midpoint of about $101.1 billion and lifted adjusted EPS guidance to $11.68 at the midpoint, signaling confidence in the growth trajectory despite tariff pressures and a deal with the U.S. administration to cut some drug prices.[3][7] At the same time, the medtech unit underperformed, with sales of roughly $8.93 billion coming in below estimates even as procedural volumes in orthopedics, vision and surgery were described as stable.[3]
Litigation remains a structural overhang. In January 2026, a court-appointed special master recommended allowing expert testimony that links some talc products to ovarian cancer, keeping legal risk in focus for investors even as earnings and guidance have surprised to the upside.[1] For a stock that many investors treat as a core defensive holding, that mix of steady pharma growth, uneven medtech performance and ongoing legal uncertainty sets the stage for how traders may respond as the historically strong late-summer seasonal window opens.
The chart below situates the latest pullback and the 52-week range against a 60-day seasonal projection for the upcoming window.
What should traders watch as this Johnson & Johnson seasonal window approaches?
First, the calendar. The 125-day window starting Aug. 5 runs through much of the remaining midterm election year and into the doorstep of the pre-election year, a phase that has historically seen investors rotate toward stable cash generators. If Johnson & Johnson continues to trade below its 52-week high as the window opens, the historical pattern suggests that dips inside the range have often been followed by multi-month recoveries rather than prolonged breakdowns.
Second, the policy tape. Tariff headlines and drug pricing negotiations have already been flagged as headwinds, even as guidance has moved higher.[7] Any fresh signals from Washington on reimbursement, Medicare negotiations or broader healthcare reform could influence whether this midterm-year seasonal strength repeats or stalls. Traders will be watching how quickly the stock absorbs such news relative to the typical grind higher seen in prior cycles.
Third, the earnings and product pipeline cadence. The latest results showed Tremfya and Darzalex driving pharmaceutical growth while medtech lagged expectations.[3] Follow-through in prescription trends, new trial data and any updates on medtech recovery will help determine whether fundamental momentum lines up with the bullish historical seasonality or introduces friction.
Finally, behavior inside the window itself will be the real test of this JNJ seasonal trend. If the stock quickly reclaims recent losses and begins to track a steady upward path with only modest drawdowns, it would echo the smoother years in the historical sample. A deeper early drawdown followed by a late-window recovery would look more like 1986 or 1998. A sustained failure to gain traction, especially in the face of supportive earnings and policy clarity, would be the clearest sign that this midterm-year pattern is losing some of its edge.
Sources
- Reuters: Johnson & Johnson forecasts 2026 profit above Wall Street estimates (Jan 21, 2026).
- Forbes: Does JNJ Stock Still Offer Value? (Feb 23, 2026).
- Reuters: J&J quarterly earnings beat Wall Street estimates on strength in medicines unit (Jul 15, 2026).
- The Wall Street Journal: J&J’s Sales and Profit Rise on Strong Cancer and Autoimmune Drug Sales (Jan 21, 2026).
About this seasonal analysis
Seasonal pattern data is sourced from TradeWave.ai, which analyzes historical price behavior across annual calendar windows going back up to 30 years. Read the full data methodology or the book The 100-Year Pattern by Afshin Moshrefi (2026 edition). Past performance of seasonal patterns does not guarantee future results. This article is for informational purposes only and does not constitute investment advice.