Annaly Capital Management (NLY) Has Rallied in 6 of 6 Midterm Summer Windows
Annaly Capital Management is nearing a midterm-year seasonal window that has never been negative in this sample, just as the stock trades near a 52-week high in a rate-sensitive market.
Price as of Jul 14, 2026: $23.01 (last close).

What is the seasonal pattern for Annaly Capital Management (NLY)?
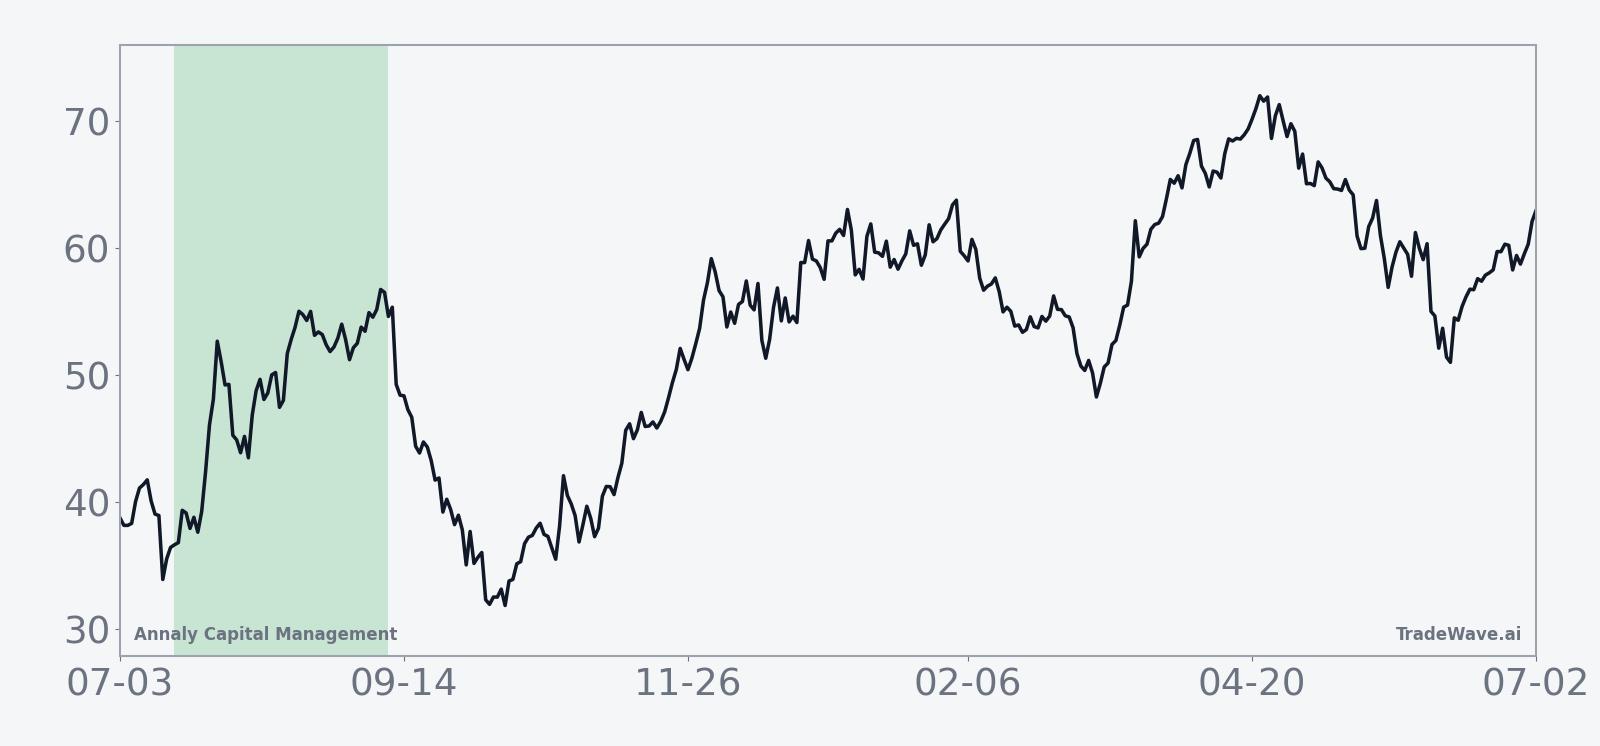
Annaly Capital Management has risen in 6 of 6 midterm-year summer windows during this 56-day stretch, with an average gain of 4.97% in winning years.
Key takeaways
- 6 for 6 in this window, with average gains of 4.97% across all winning years.
- Seasonal window runs from Jul 17 and spans 56 trading days across the last 6 midterm election years.
- Percent Profitable is 100%, with 6 winners and 0 losers in the historical sample.
- Trade Direction is long, supported by a Sharpe ratio of 1.45 and a TradeWave Ratio of 1.91.
- Individual years have seen maximum favorable moves as high as 13.65% but also adverse swings down to about -22.56% inside the window.
- Today’s price near the 52-week high means any repeat of this NLY seasonal trend would be starting from an elevated base.
According to historical data from TradeWave.ai, this midterm-year stretch has behaved differently from a typical summer for Annaly Capital Management, and the next iteration begins in days.
How has Annaly Capital Management (NLY) traded in this midterm-year summer window?
Annaly Capital Management has risen in all six midterm election years during this 56-day summer window, averaging a 4.97% gain with no losing cycles. The next iteration begins on Jul 17, with shares last changing hands at 23.01, about 0.4% below their 52-week high of 23.10 and well above the 52-week low near 14.91. That combination of a clean historical win streak and a price sitting near the top of its recent range makes this upcoming Annaly Capital Management trading window unusually important for income-focused investors watching historical seasonality.
Because this pattern is grouped by the presidential election cycle, it reflects how Annaly has behaved specifically in the midterm election year, not just any random summer. Midterm years often bring shifting expectations for fiscal policy, regulation and the path of interest rates, which can matter a lot for a mortgage REIT like Annaly that lives and dies by funding costs and spread income.
Year-by-year bars with both peak rallies and worst drawdowns show how much NLY has swung inside this window even when it finished higher.
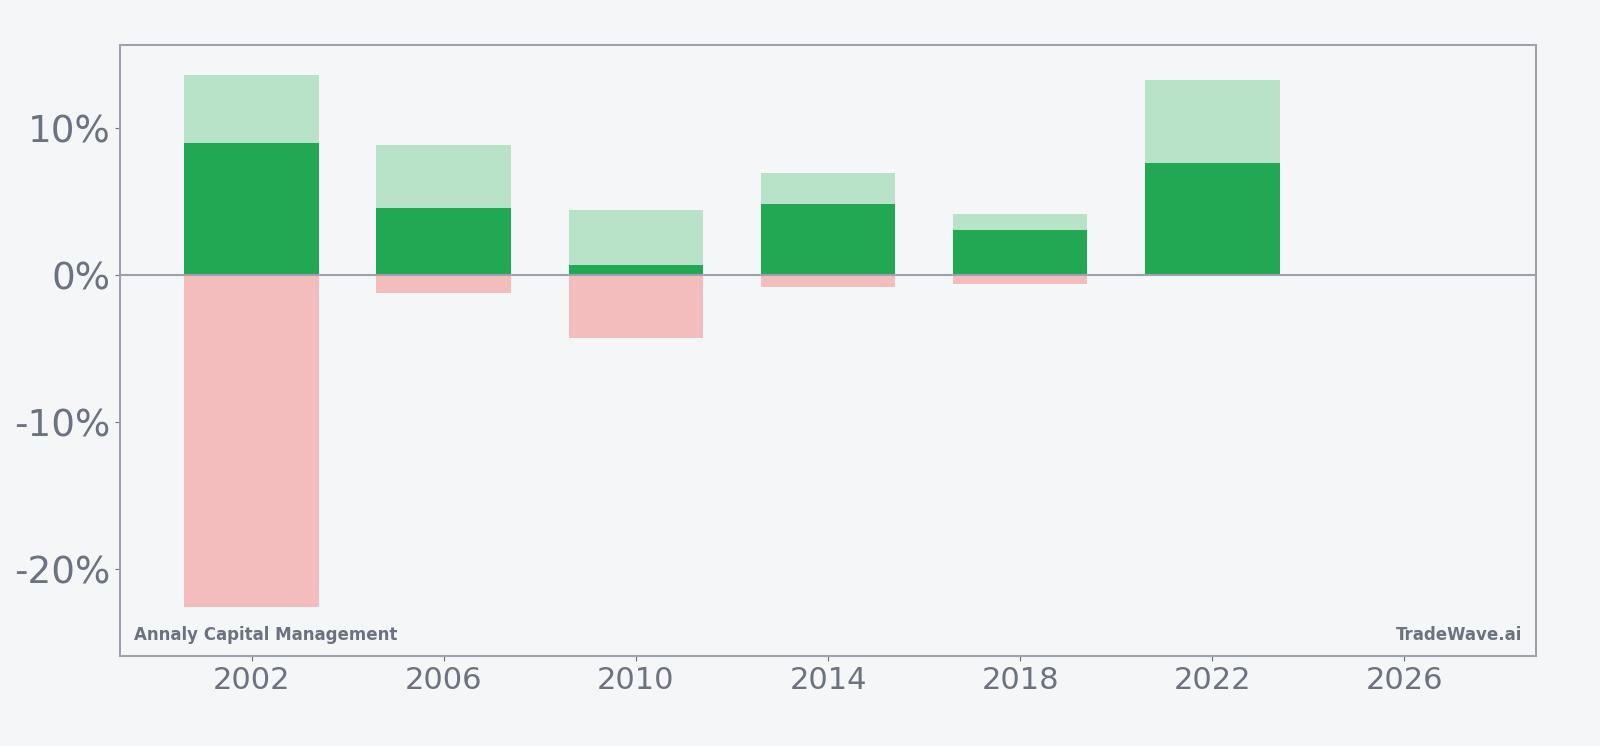
Across the six historical midterm-year samples, the long setup has been consistently positive at the finish, but the ride has not always been smooth. Average profit of 4.97% masks a wide range of outcomes, from a modest 0.69% gain in 2010 to a 9.03% jump in 2002. In several years the maximum favorable move inside the window reached double digits, with peaks of 13.65% in 2002 and 13.29% in 2022, underscoring how strong the upside bursts can be when the pattern is working.
The flip side is the adverse side of the ledger. In 2002, Annaly’s worst intraperiod drawdown during the window was about -22.56%, even though the trade ultimately finished positive. Other years saw more contained downside, with maximum adverse moves closer to -1% to -4%. That mix of large potential rallies and sometimes deep temporary pullbacks is exactly what the MFE/MAE profile is flagging: this has been a high-variance but ultimately positive stretch for longs in the sample.
The cumulative return view across all six midterm election years adds up to a 33% gain for this specific 56-day slice, with an annualized return of 4.94%. The Sharpe ratio of 1.45 suggests that, based on end-of-window outcomes, the reward has historically been attractive relative to volatility. Trend metrics also lean bullish, with “Trend Long” readings far outweighing “Trend Short,” which lines up with the 100% win rate in this NLY seasonal trend.
History does not guarantee future results; even in a window with no losing years so far, adverse excursions can be large and fast before any recovery.
Why does Annaly Capital Management (NLY) follow this seasonal pattern?
One likely driver is the way midterm election years cluster policy and rate expectations into the middle of the year, which can reshape mortgage REIT funding costs and portfolio positioning. Analysts often point to institutional rebalancing and sector rotation around this point in the cycle, as investors adjust exposure to rate-sensitive financials ahead of the stronger pre-election year that typically follows. For Annaly, that may translate into a recurring window where capital flows and spread expectations line up in its favor, even if the path inside the window is volatile.
What is driving Annaly Capital Management (NLY) today?
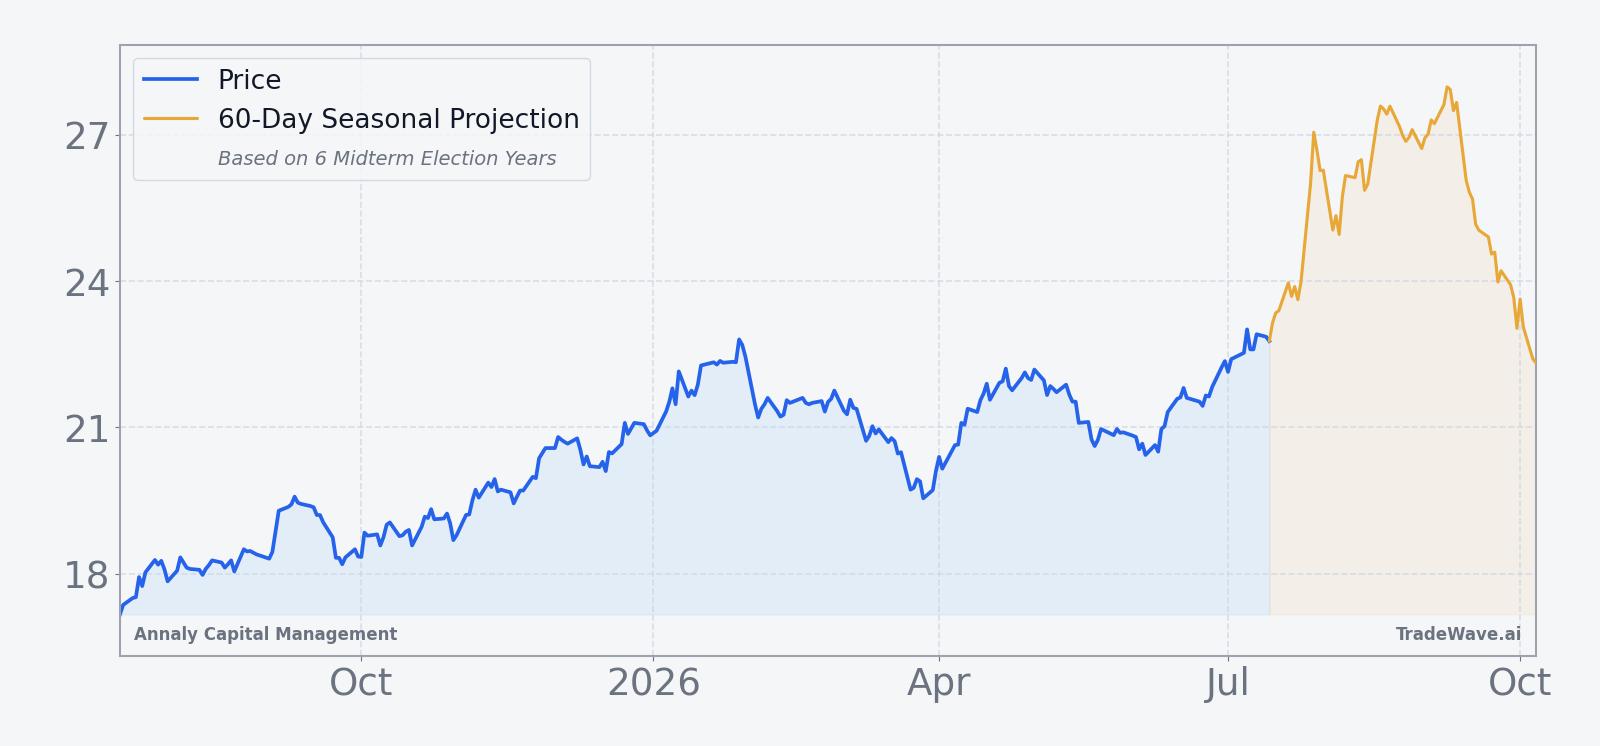
Annaly Capital Management closed the latest session at 23.01, up 2.13% on the day, after trading between 22.56 and 23.09. The stock is sitting just below its 52-week high of 23.10 and well above its 52-week low near 14.91, with a one-month return of 11.71% and 20-day average volume around 8.53 million shares. That puts Annaly in a firm short-term uptrend heading into the midterm-year seasonal window, with the 50-day moving average down at roughly 20.99 acting as a reference line for any pullbacks.
The chart below shows how that recent climb lines up with the 60-day seasonal projection for this midterm-year window.
With no near-term earnings date or major company-specific catalyst on the calendar, the backdrop for Annaly is dominated by the broader rate and policy environment rather than stock-specific headlines. Mortgage REITs tend to trade as leveraged plays on the shape of the yield curve and expectations for central bank policy, so any shift in rate-cut odds or term premium can quickly feed into book value assumptions and dividend sustainability. Against that macro backdrop, the fact that NLY is entering a historically strong midterm-year seasonal window from a position of strength near its highs will be on the radar of traders who track stock pattern analysis and sector seasonal outlooks.
What should traders watch in this Annaly Capital Management seasonal window?
First, watch how NLY behaves around the Jul 17 start date relative to its 50-day moving average near 20.99. In prior midterm election years, some of the strongest seasonal gains came after early-window dips, so whether the stock holds recent support or shakes out first will say a lot about how closely this iteration tracks the historical seasonality.
Second, monitor intraperiod swings rather than just end-of-window performance. Past cycles have seen maximum favorable moves north of 13% and, in at least one case, a temporary drawdown worse than -20% before finishing higher. If volatility spikes but the stock continues to respect key support levels, that would be consistent with the high-variance, ultimately positive pattern seen in the bars chart.
Third, keep an eye on the policy calendar and rate expectations as the market moves from the midterm election year toward the year before the presidential election. Historically, that transition has been associated with a more constructive risk backdrop, which may help explain why this specific midterm-year summer window has leaned bullish for Annaly. If incoming data or central bank commentary shifts the rate path meaningfully, it could either reinforce or overwhelm the usual NLY seasonal trend.
Finally, traders who lean on historical seasonality will be looking for confirmation in volume and price behavior early in the window. A firm tape with healthy liquidity and contained drawdowns would line up with the long-biased pattern, while a sharp break below the recent range with heavy selling would signal that this cycle is diverging from the last six midterm election years.
Sources
About this seasonal analysis
Seasonal pattern data is sourced from TradeWave.ai, which analyzes historical price behavior across annual calendar windows going back up to 30 years. Read the full data methodology or the book The 100-Year Pattern by Afshin Moshrefi (2026 edition). Past performance of seasonal patterns does not guarantee future results. This article is for informational purposes only and does not constitute investment advice.