Wells Fargo (WFC) Has Dropped in 10 of 10 Midterm Windows Starting Aug. 4, Shorts Averaged 7.35%
Wells Fargo is trading just below its 52-week high as it heads toward an August seasonal window that has delivered consistent downside in past midterm election years.
Price as of Jul 13, 2026: $87.67 (last close).

What is the seasonal pattern for Wells Fargo (WFC)?
Wells Fargo has fallen in 10 of 10 midterm election years during this August-to-October window, with an average 7.35% gain for short positions in winning years.
- 10 for 10 in this window, with short trades averaging 7.35% gains in winning years across the last 10 midterm election cycles.
- Seasonal window starts Aug. 4 and runs 69 trading days, covering the late-summer to early-fall stretch of the midterm election year.
- Percent Profitable is 100%, with 10 winners and 0 losers for the short-side pattern in this Wells Fargo trading window.
- Avg Profit of 7.35% reflects the mean outcome across all years in the sample, since every year was profitable for the short direction.
- The TradeWave Ratio of 1.72 signals that price has typically moved meaningfully in the trade direction within the window, while a Sharpe ratio of 1.08 points to solid risk-adjusted results.
- Individual years have still seen sizable intraperiod swings, with some windows showing double-digit peak drawdowns before finishing as profitable shorts.
According to historical data from TradeWave.ai, this midterm-year stretch has behaved very differently from an average late-summer for Wells Fargo, and the next iteration is about to open again.
How has Wells Fargo (WFC) traded in this midterm-year August window?
Wells Fargo has declined in every one of the last 10 midterm election years during the 69-day window that begins on Aug. 4, with short positions averaging a 7.35% gain. Shares finished Monday at $87.67, up 0.6% on the day and about 8.4% below the stock’s 52-week high of $95.71. With the bank in a midterm election year and the calendar just weeks away from this historically weak slice, the setup puts a clean seasonal pattern directly against a stock that has been grinding higher.
Because this pattern is grouped by the presidential election cycle, it reflects how Wells Fargo has behaved in the last 10 midterm election years rather than in 10 consecutive calendar years. That matters in 2026, which is itself a midterm election year, as policy debates around regulation, capital rules and rate cuts can reshape expectations for big banks in ways that repeat from cycle to cycle.
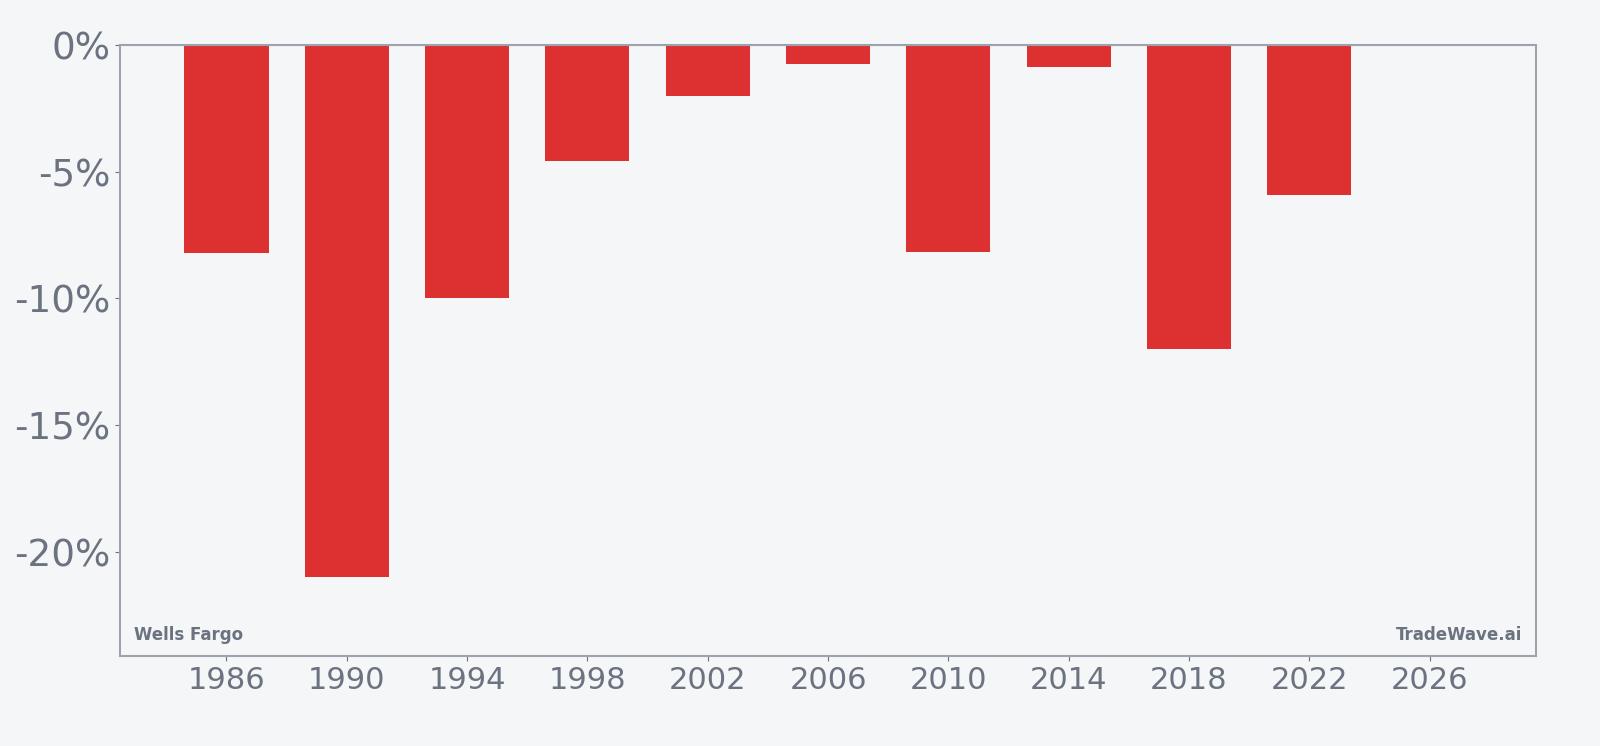
Historically, this midterm-year window has favored the short side. Percent Profitable sits at 100%, with 10 winners and 0 losers, and the average profit for those short trades is 7.35%. For a short pattern, those negative net returns for the stock represent “good” years, since Wells Fargo has tended to drift or break lower across the window rather than squeeze higher.
The per-year table shows how that has played out in practice. The strongest year for the short side was 1990, when Wells Fargo fell 20.98% from entry to exit during the window, while the weakest outcome for shorts came in 2006, when the stock slipped just 0.77%. Even in softer years like 2002 and 2010, the stock still finished the window lower, preserving the clean 10-for-10 record for the pattern.
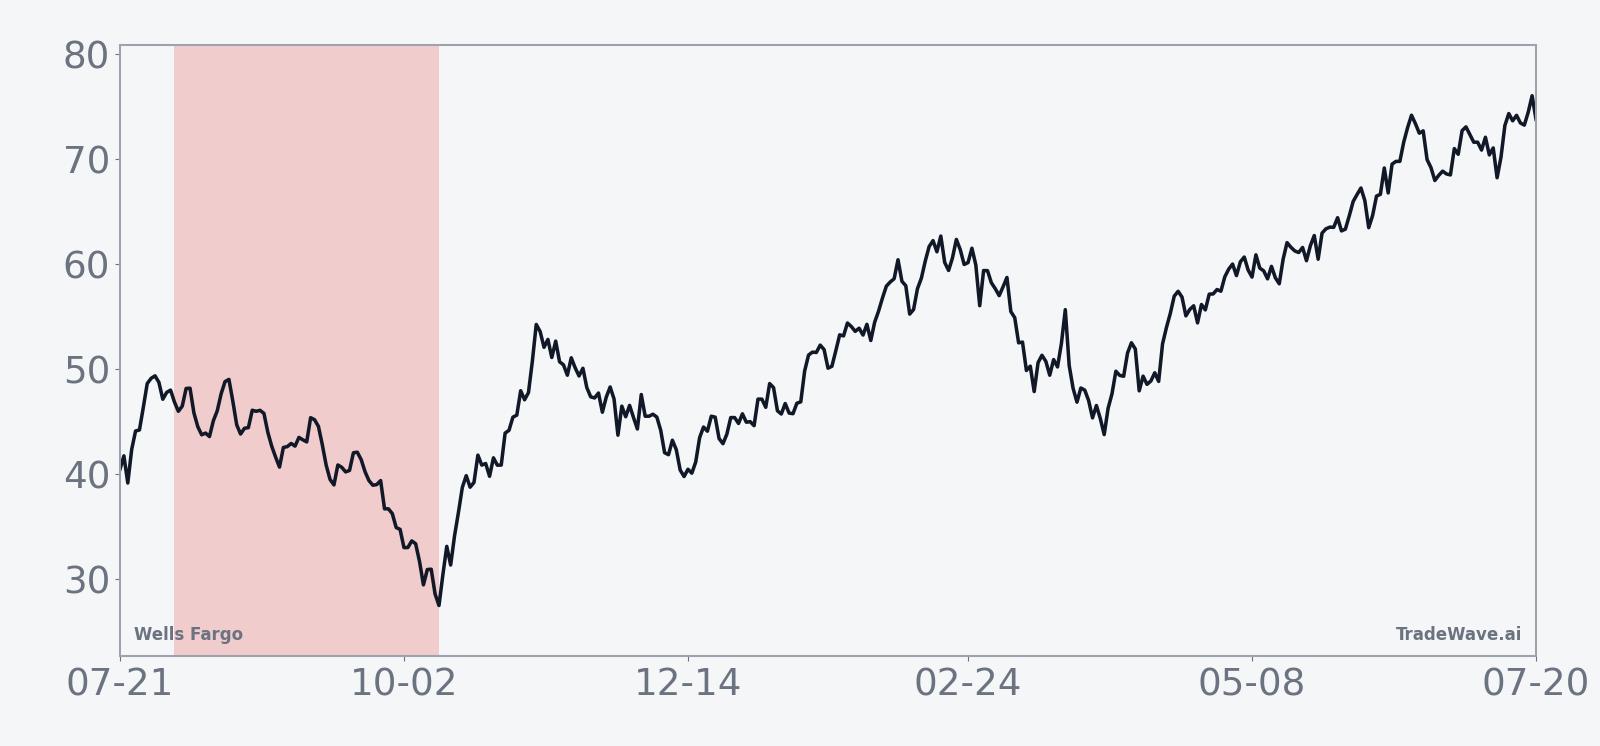
The historical seasonal average suggests that weakness has not been a straight line. The trend chart shows periods of early choppiness followed by more persistent downside later in the window, which runs into the heart of the autumn policy and earnings season. That profile fits a backdrop where investors reassess bank earnings power and regulatory risk as the midterm year matures.
Year-by-year net returns and intraperiod swings underline how often this window has rewarded patience on the short side while still demanding tolerance for volatility.
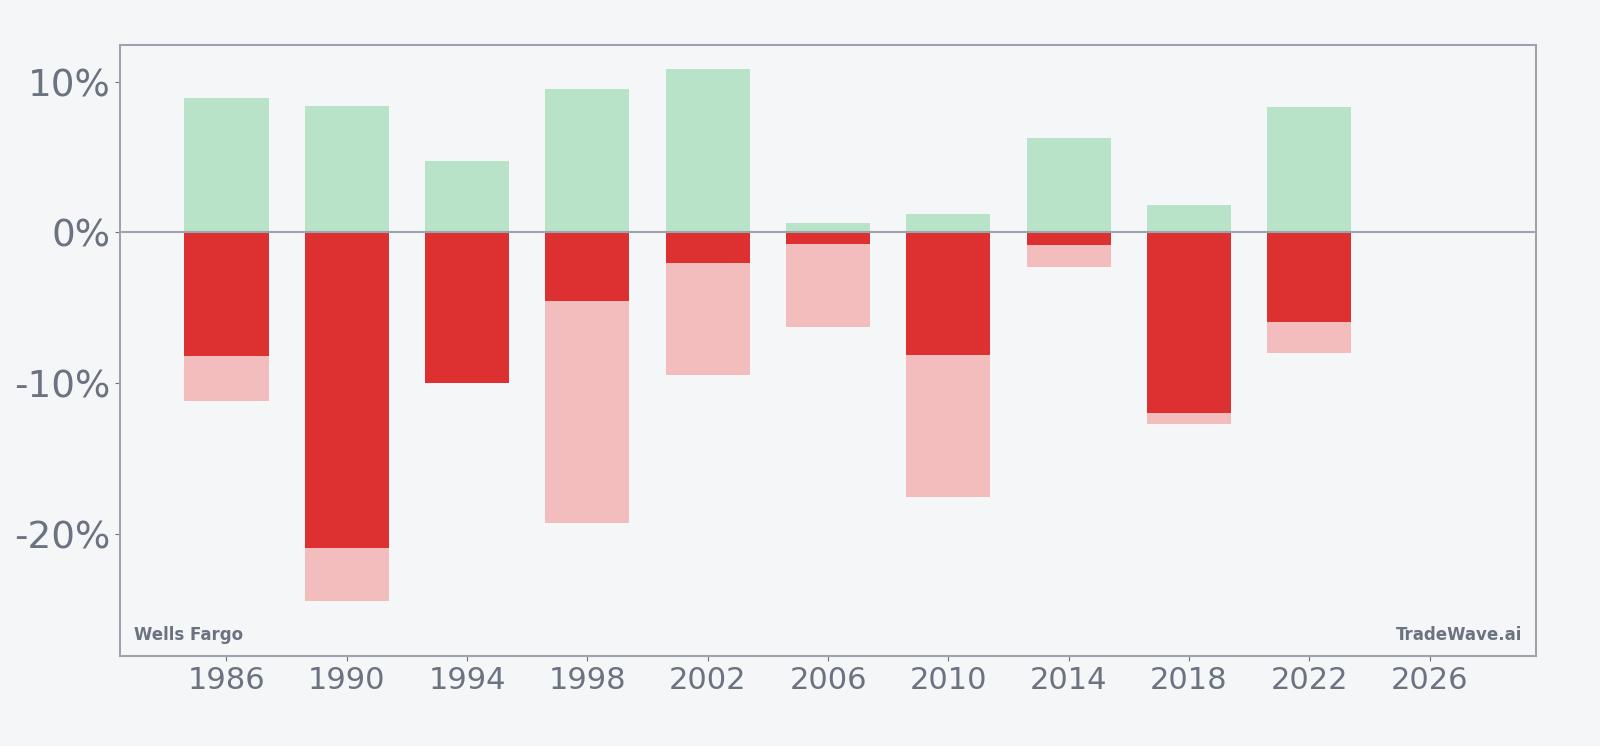
The combined net, maximum favorable move and maximum adverse move view shows why this pattern has mattered for risk management. In strong short years like 1990 and 2018, the maximum favorable excursion for the short side reached into double digits, but the worst intraperiod drawdowns also ran as deep as about 24.5% against the position in 1990 and 19.3% in 1998 before the trade finished profitable. That mix of sizable peak gains and meaningful temporary reversals is exactly what the TradeWave Ratio of 1.72 and Sharpe ratio of 1.08 are capturing: a window that has historically offered real edge for shorts, but only for traders prepared to sit through swings.
History does not guarantee future results; adverse excursions can be large even in winning windows, and past midterm-year patterns may not repeat in 2026.
Why does Wells Fargo (WFC) follow this seasonal pattern?
One likely driver is the way midterm election years cluster regulatory headlines and policy debates that matter for big banks, from capital rules to consumer protection. Analysts have also pointed to late-summer and early-fall earnings pre-announcements and guidance resets as moments when investors reassess net interest income and credit costs, often pressuring financial stocks. This pattern may also reflect institutional portfolio repositioning around the policy calendar, as managers trim exposure to rate-sensitive names like Wells Fargo ahead of potential shifts in Federal Reserve communication.
What is driving Wells Fargo (WFC) today?
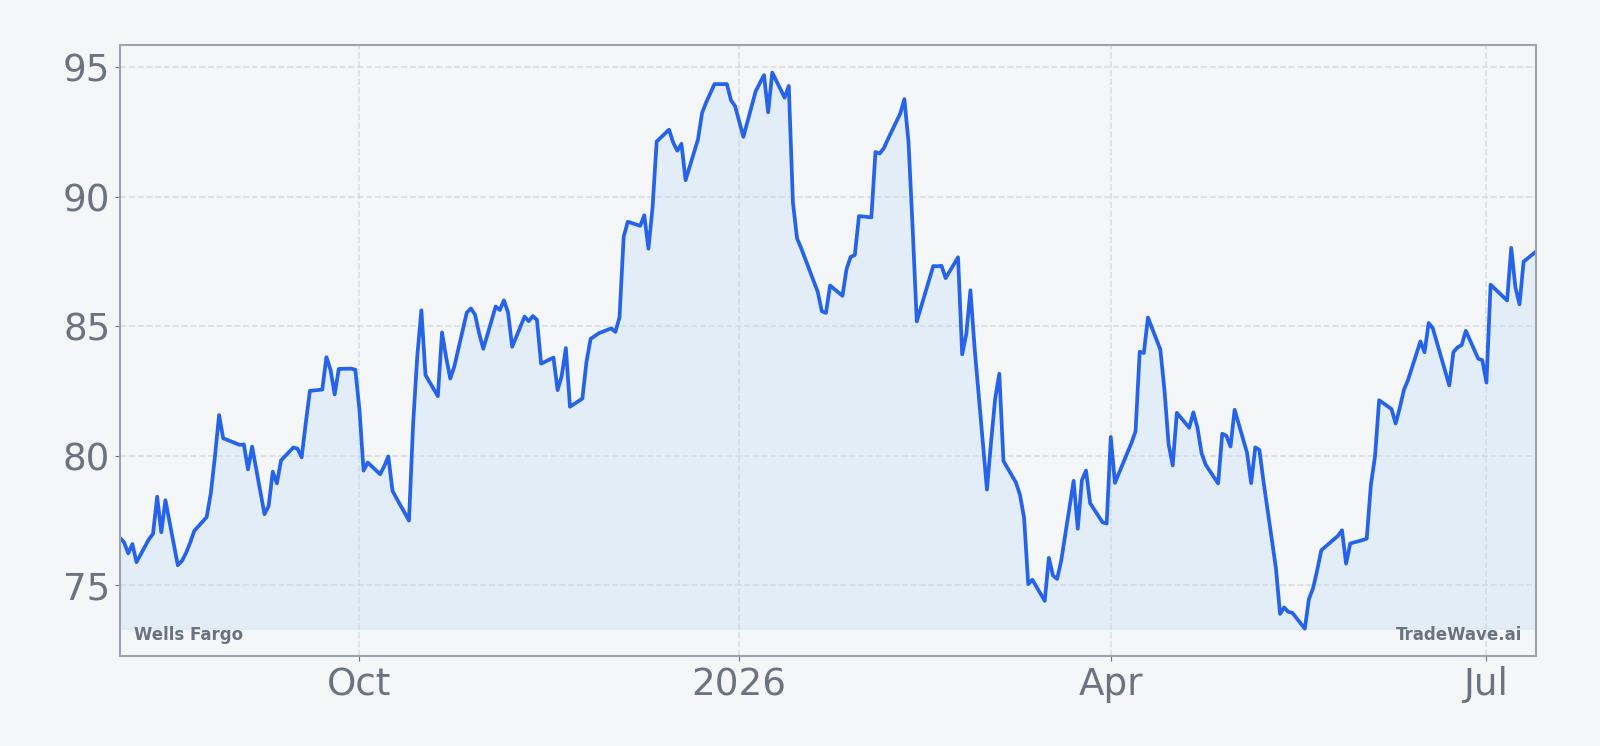
Wells Fargo closed Monday at $87.67, up 0.51 on the day, as the stock continued to trade in a tight band between an intraday low of $86.11 and a high of $88.01. That leaves the shares about 8.4% below their 52-week high of $95.71 and well above the 52-week low of $72.78, with the 50-day moving average down at $80.61 and 20-day average volume around 14.96 million shares.
Fundamentally, the bank is coming off a run of solid earnings. In Q4 2025, reported on Jan. 14, 2026, Wells Fargo posted net income of $5.36 billion and adjusted earnings per share of $1.76, topping analyst estimates even as net interest income came in a bit light versus forecasts.[3] In Q1 2026, net profit was $5.25 billion, helped by higher interest income and a 19% jump in markets revenue to $2.17 billion, underscoring the bank’s push into trading and investment banking fees.[6]
Management has been leaning into that story. In June 2026, Wells Fargo’s research arm raised its S&P 500 target on the back of a stronger earnings outlook, signaling confidence in the broader profit cycle that large banks help drive.[5] Around the same time, the bank’s chief financial officer flagged a “step up” in interest income for the second quarter, reinforcing the idea that rate dynamics and loan growth are still working in Wells Fargo’s favor even as the Federal Reserve edges toward easier policy.[7]
Macro conditions remain a swing factor. Fed rate cuts and expectations for further easing have shaped how investors think about banks’ net interest income, while geopolitical shocks and oil volatility have supported trading desks, as seen in the Q1 2026 results.[6] For a stock that has already rerated higher on better profitability and the removal of its long-standing asset cap in 2025,[4] the question for traders is how much of that good news is already in the price as the midterm-year seasonal window approaches.
The chart below situates the latest move in its recent multi-month context, alongside a 60-day seasonal projection.
What should traders watch as the Aug. 4 window opens?
First, the calendar. The 69-day window starting Aug. 4 drops Wells Fargo into a stretch that has historically been unfriendly to longs in midterm election years, even when the broader earnings story looked solid. Traders will be watching whether the stock stalls or reverses as that date approaches, especially if it retests the $95 area that marked the 52-week high.
Second, the policy and earnings tape. Any shift in Fed communication on the pace of rate cuts, or fresh commentary from Wells Fargo executives on net interest income and expense trends, could either reinforce or blunt the historical seasonal pattern.[7] A strong Q3 outlook update or continued upside in markets revenue would test how much weight investors are willing to give to the midterm-year stock pattern analysis versus the current fundamental story.[6]
Third, price behavior inside the window. If Wells Fargo begins to roll over after Aug. 4 and spends the bulk of the window below its 50-day moving average, that would be consistent with the historical seasonality that has seen the stock finish lower in all 10 prior midterm-year iterations. A decisive break higher that holds above the 52-week peak, by contrast, would mark the first clear “losing” year for the short-side pattern and signal that this cycle is trading differently from the last decade of midterm election years.
Finally, volatility. The history of large maximum adverse moves within otherwise profitable short windows is a reminder that even if the pattern continues to work, the path is unlikely to be smooth. Traders focused on this Wells Fargo seasonal trend will be watching intraday swings and volume closely for signs that positioning is building into the window or that the market is fading the pattern this time around.
Sources
- CNBC, "Wells Fargo quiets the skeptics with strong earnings and a reinvigorated outlook" (Oct 14, 2025)
- CNBC, "Why an analyst downgrade of Wells Fargo does not change our conviction in the stock" (Sep 29, 2025)
- Reuters, "Wells Fargo profit climbs on interest income boost" (Jan 14, 2026)
- Reuters, "Wells Fargo tops profit estimates, raises return target after asset cap lifted" (Oct 14, 2025)
- Reuters, "Wells Fargo raises S&P 500 target on stronger earnings outlook" (Jun 16, 2026)
- Reuters, "Wells Fargo profit rises on interest income boost" (Apr 14, 2026)
- Reuters, "Wells Fargo CFO signals 'step up' in interest income in second quarter" (Jun 9, 2026)
- CNBC, "Wells Fargo says a market ‘short squeeze’ is coming. Here are the stocks to target for a trade" (Jan 6, 2026)
About this seasonal analysis
Seasonal pattern data is sourced from TradeWave.ai, which analyzes historical price behavior across annual calendar windows going back up to 30 years. Read the full data methodology or the book The 100-Year Pattern by Afshin Moshrefi (2026 edition). Past performance of seasonal patterns does not guarantee future results. This article is for informational purposes only and does not constitute investment advice.