Cattle Shortage Squeezes Tyson Foods (TSN) Margins Into a Historically Weak July-August Stretch
Tyson Foods is heading toward a short midterm-year seasonal window that has been consistently bearish, even as the stock trades well below its 52-week high and investors focus on shifting protein margins.
Price as of Jul 14, 2026: $57.48 (last close).

What is the seasonal pattern for Tyson Foods (TSN)?
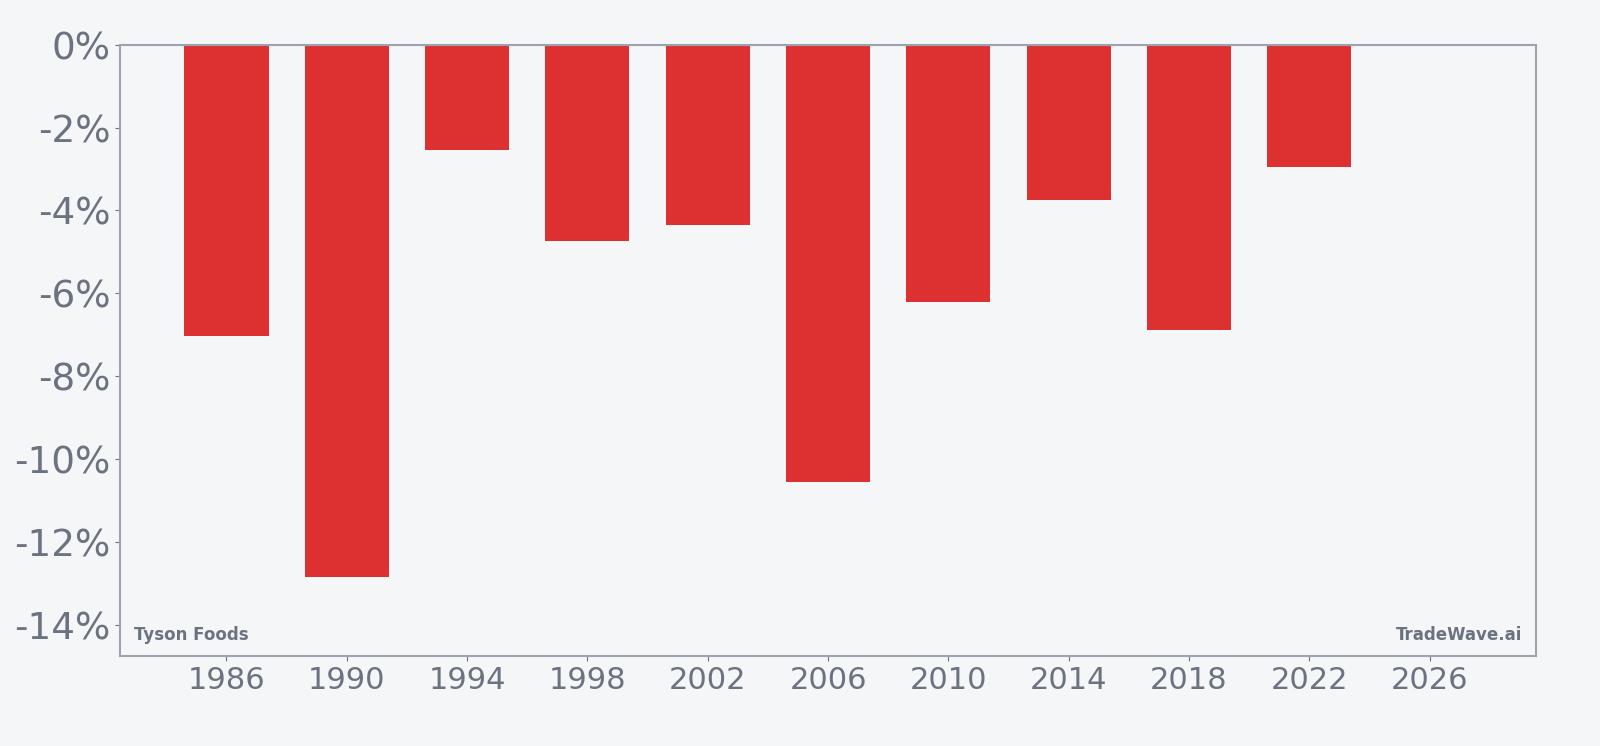
Tyson Foods has fallen in 10 of 10 midterm-year summer windows during this 21-day stretch, with an average gain of 6.19% in winning years for the short side.
- 10 for 10 in this window for shorts, with an average profit of 6.19% across winning years.
- Seasonal direction is bearish for the stock, with a 21-trading-day window starting Jul 20, 2026.
- Percent Profitable is 100%, with 10 winners and 0 losers for the short trade setup.
- TradeWave Ratio of 2.33 indicates price has typically moved meaningfully in the trade direction within the window.
- Sharpe ratio of 1.79 reflects strong risk-adjusted returns for this specific short pattern.
- Historical intraperiod swings include sizable drawdowns and rallies, so timing and risk control have mattered even in a perfect win record.
According to historical data from TradeWave.ai, this midterm-year slice of the calendar has behaved very differently from an average summer for Tyson Foods, and the next iteration is only days away.
How has Tyson Foods (TSN) traded in this midterm-year summer window?
Tyson Foods has declined in all 10 of the last midterm election years during this 21-day July–August window, with shorts averaging a 6.19% profit. Shares finished Tuesday at $57.48, down 0.8% on the day and about 15.9% below the 52-week high of $68.32. That combination of a clean 10-for-10 bearish seasonal record and a stock already trading well off its highs gives this upcoming window unusual weight for traders watching the TSN seasonal trend.
Grouping the data by the presidential election cycle matters here because this pattern only looks at midterm election years, a phase that often brings policy uncertainty, shifting farm and food regulation debates, and portfolio repositioning across defensives like consumer staples. In this context, Tyson’s 21-day window starting Jul 20 sits in the middle of the midterm year, just before markets historically begin to pivot toward the more risk-on pre-election year that follows.
The trade direction for this setup is explicitly short. In other words, the “good” years in this pattern are the ones where TSN fell, and the “bad” years are the ones where it squeezed higher. Across the last 10 midterm election years in this specific window, there have been 10 winners and 0 losers for the short side, with an annualized return of 6.14% and a cumulative return of 81% for the strategy.
Average profit of 6.19% reflects the mean gain on those winning short trades, while the median profit of 5.48% shows that results have been fairly clustered rather than driven by a single outlier. The standard deviation of 3.33% and a Sharpe ratio of 1.79 point to a relatively consistent pattern of downside for the stock during this stretch when viewed through a risk-adjusted lens.
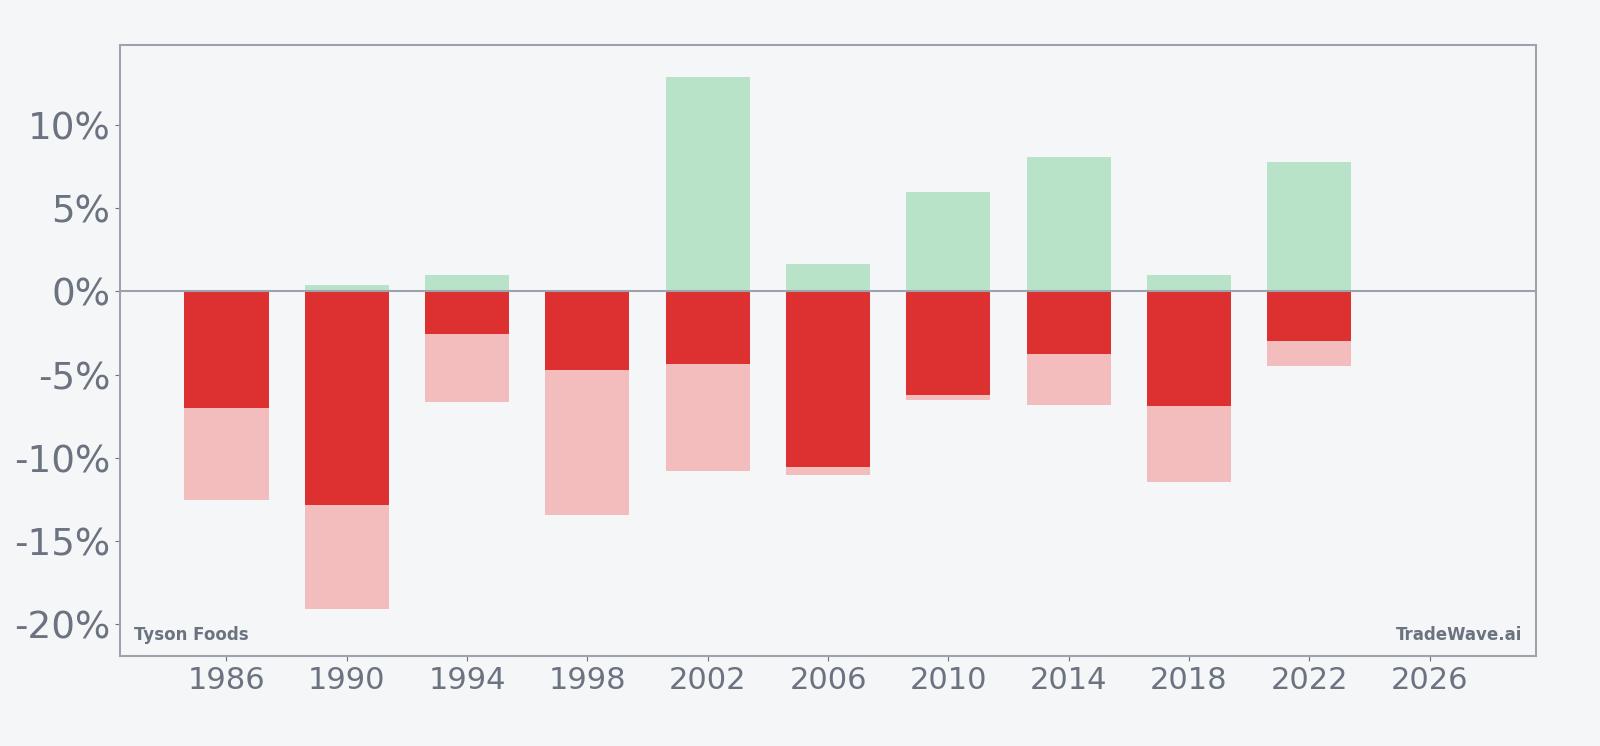
Looking at individual years, 1990 stands out as the strongest outcome for shorts, with a net return of -12.84% for the stock over the window as TSN slid from an entry price of 6.621 to 5.7708. On the other side of the spectrum, 1994 and 2022 were the softest wins, with net returns of -2.55% and -2.95% respectively, still profitable for shorts but far less dramatic than the double-digit declines seen in some cycles.
Intraperiod swings have been meaningful. Maximum favorable moves for shorts, measured as the best point-to-peak decline from entry, reached as much as 12.89% in 2002, while maximum adverse moves, the worst drawdowns against the short, hit -19.07% in 1990 and -13.42% in 1998. That mix of large favorable and large adverse excursions shows that even in a perfect 10-for-10 record, traders have had to sit through sharp countertrend rallies at times.
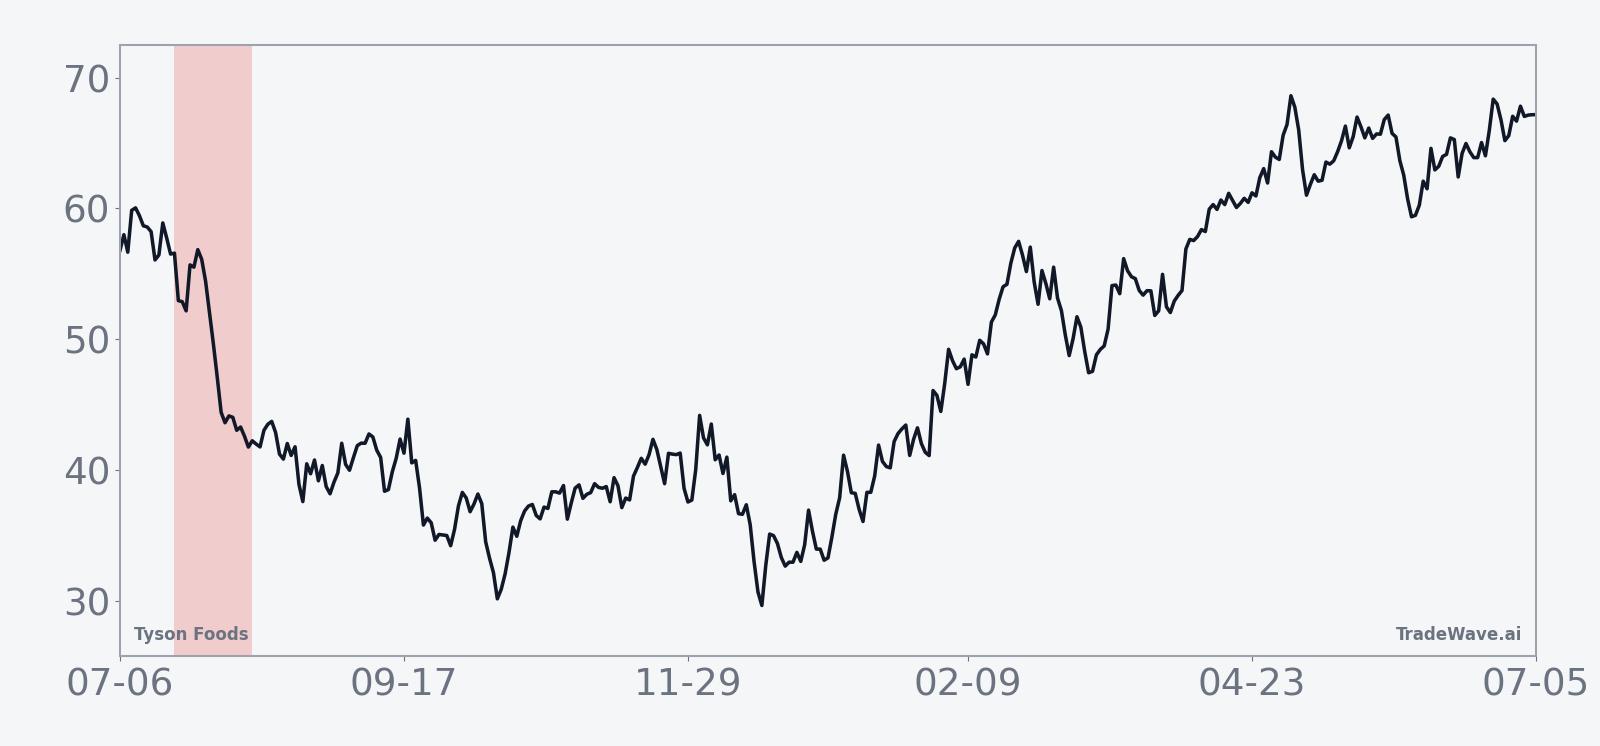
The historical seasonal trend chart for this window shows that most of the downside for TSN has tended to accrue in the middle of the 21-day stretch rather than in a straight line from day one. Early days often see choppy price action, followed by a more decisive drift lower into the back half of the window, which has been where shorts historically picked up the bulk of their gains.
A combined view of net returns, best-case runs and worst drawdowns shows how far TSN has tended to move in both directions during this stretch.
History does not guarantee future results; adverse excursions can be large even in winning windows, and past patterns may not repeat.
Why does Tyson Foods (TSN) follow this seasonal pattern?
One likely driver is the way Tyson’s fiscal calendar and earnings cadence line up with midyear, when investors reassess protein margins and cattle cost guidance ahead of the fall. Analysts have also pointed to midterm-year policy debates around agriculture, trade and food regulation, which can shift sentiment toward meatpackers in short bursts. This pattern may also reflect sector rotation as portfolio managers rebalance consumer staples exposure in the middle of the midterm election year before leaning back into risk ahead of the pre-election year.
What is driving Tyson Foods (TSN) today?
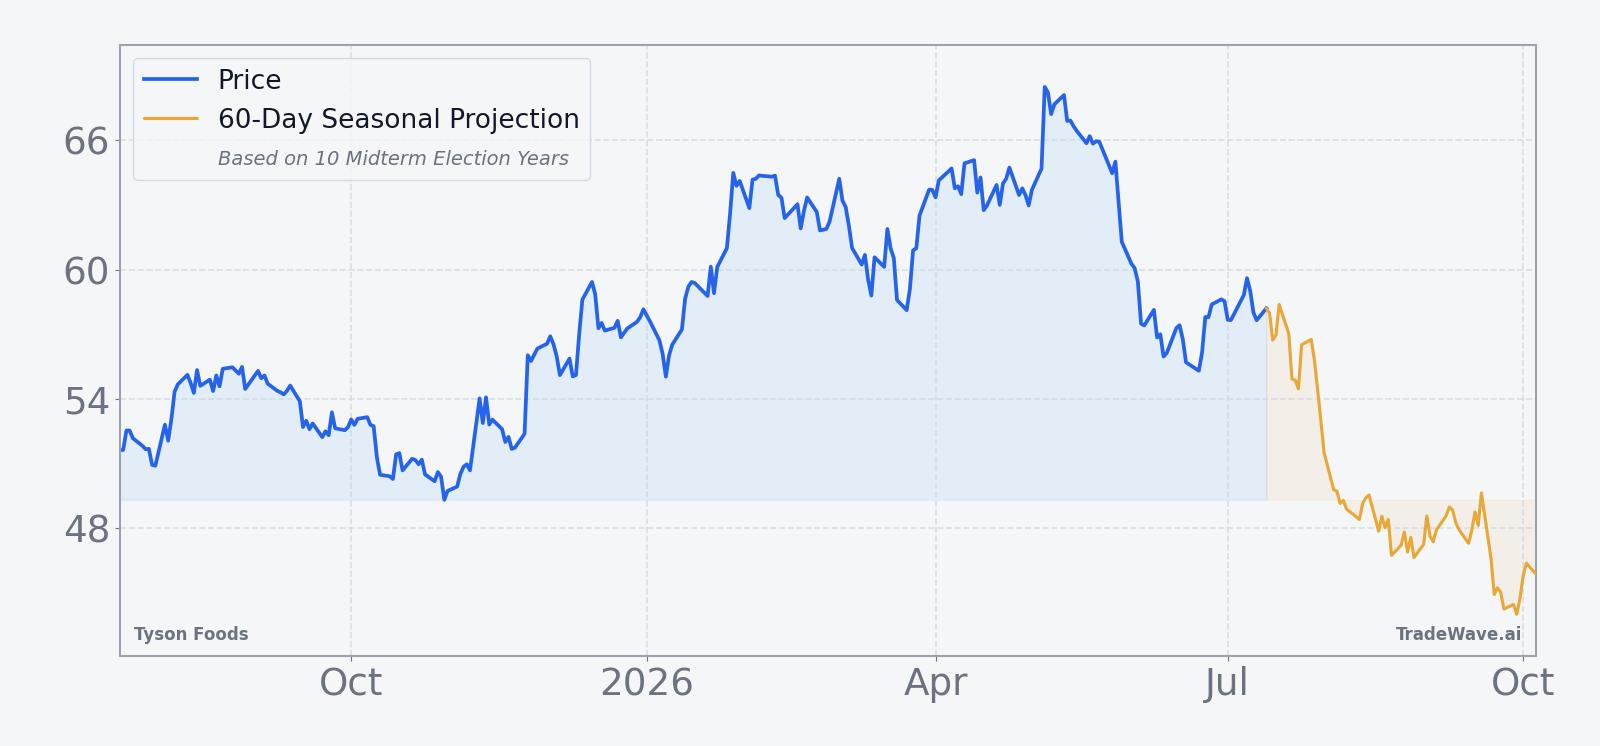
Tyson Foods closed at $57.48 on Tuesday, down 0.44 on the day, with the stock trading about 15.9% below its 52-week high of $68.32 and modestly above the 52-week low of $48.07. The share price sits under its 50-day moving average of $60.72, even after a 4.1% gain over the past month, underscoring how the recent bounce has not yet broken the broader consolidation pattern.
In May 2026, Tyson reported fiscal second-quarter adjusted earnings of $0.87 per share on $13.65 billion in sales, topping estimates and prompting the company to raise its adjusted operating income outlook for fiscal 2026, driven largely by strength in its chicken business.[1] That followed a series of 2025 quarters where resilient chicken demand and improved prepared foods margins offset pressure in beef, allowing management to lift revenue guidance despite a tougher cattle backdrop.[2][3][5]
In November 2025, Tyson also announced the closure of a beef plant in Lexington, Nebraska, citing U.S. cattle supplies at nearly 75-year lows and signaling that tight cattle supply would remain a multi-year headwind for its beef operations.[11] Around the same time, coverage from Forbes and others highlighted how consumers were trading down from high-priced beef toward cheaper proteins like chicken, a shift that has supported Tyson’s poultry and prepared foods segments even as beef margins compressed.[4]
The chart below situates the latest move in its recent multi-month context, alongside a 60-day seasonal projection path.
What should traders watch as this Tyson Foods seasonal window approaches?
First, the calendar: the 21-day midterm-year window begins on Jul 20 and runs into mid-August, a period that has historically delivered consistent downside for TSN in this election-cycle phase. How the stock behaves into that start date will matter; a continued drift below the 50-day moving average would keep the technical backdrop aligned with the bearish historical seasonality, while a sharp squeeze higher would echo some of the more volatile years in the sample.
Second, watch protein margin commentary and any updates on cattle supply or plant utilization, especially around any mid-summer industry conferences or company appearances. Prior cycles show that shifts in expectations for chicken profitability versus beef headwinds have been key drivers of Tyson’s stock pattern, and fresh headlines on that front could either reinforce or blunt the typical midterm-year seasonal trend.[1][2][3][4][11]
Third, levels matter. On the downside, traders will be watching how TSN behaves if it moves back toward the 52-week low near $48, a zone that has not been revisited since earlier in the year. On the upside, any sustained reclaiming of the 50-day moving average around $60.72 during the window would mark a clear departure from the historical pattern, especially if accompanied by rising volume.
Finally, because this window sits late in the midterm election year and just ahead of the historically stronger pre-election year, behavior in this stretch could shape how investors position Tyson within consumer staples for 2027. If the stock once again weakens into the window, it would fit the 10-for-10 record and keep TSN aligned with its established midterm-year seasonal profile. A decisive break from that script would be a signal that the election-cycle pattern for this name may be evolving as protein demand, cattle supply and policy dynamics shift.
Sources
- Reuters: Tyson Foods profit beats estimates on strength in chicken business (May 4, 2026)
- Reuters: Meatpacker Tyson Foods raises annual revenue forecast on resilient chicken demand (Aug 4, 2025)
- Reuters: Tyson Foods forecasts annual revenue rise as chicken demand offsets beef woes (Nov 10, 2025)
- Forbes: Tyson Warns Of Plummeting Consumer Beef Purchases—As Chicken Sales Soar (Nov 10, 2025)
- The Wall Street Journal: Tyson Foods Raises Revenue Outlook (Aug 4, 2025)
- Reuters: Tyson Foods to close US beef plant as cattle supplies dwindle (Nov 21, 2025)
About this seasonal analysis
Seasonal pattern data is sourced from TradeWave.ai, which analyzes historical price behavior across annual calendar windows going back up to 30 years. Read the full data methodology or the book The 100-Year Pattern by Afshin Moshrefi (2026 edition). Past performance of seasonal patterns does not guarantee future results. This article is for informational purposes only and does not constitute investment advice.