Amphenol (APH) Has Gained in All 8 Midterm Windows Since 1998, Averaging 17.65%
Amphenol is trading near $156 after a pullback, just as a historically powerful midterm-year seasonal window that has never produced a loss comes back into focus for the stock.
Price as of Jul 13, 2026: $155.99 (last close).

What is the seasonal pattern for Amphenol (APH)?
Amphenol has risen in 8 of 8 midterm-year windows starting around Jul 11 and lasting 273 trading days, with an average gain of 17.65% in winning years.
- 8 for 8 in this window, with Amphenol averaging 17.65% gains across all winning years.
- The seasonal window begins around Jul 11 and runs for 273 trading days, spanning late midterm year into the following pre-election year.
- Percent Profitable is 100%, with 8 winners and 0 losers across the last eight midterm election years.
- Average winner gains of 17.65% stack into a 257% cumulative return across the full sample.
- The TradeWave Ratio of 1.59 signals that price typically travels meaningfully in the long direction within the window, while the Sharpe ratio of 1.49 reflects strong risk-adjusted returns.
- Individual years have still seen sizable drawdowns inside the window, with some maximum adverse moves deeper than 20% before finishing higher.
According to historical data from TradeWave.ai, Amphenol’s behavior in midterm election years has followed a remarkably consistent seasonal script that most investors never see in standard research.
How strong is Amphenol’s (APH) midterm-year seasonal window?
Amphenol has posted gains in every single one of the last eight midterm-year seasonal windows starting in July, averaging 17.65% returns over a 273-day stretch. Shares finished Monday at $155.99, down 1.9% on the day and sitting between their 50-day moving average near $147 and a 52-week high around $178.52, leaving the stock about 12.6% below its peak over the past year. That combination of a clean 8-for-8 seasonal record and a pullback from highs gives traders a clear historical backdrop as they weigh the next phase of Amphenol’s AI and connectivity story.
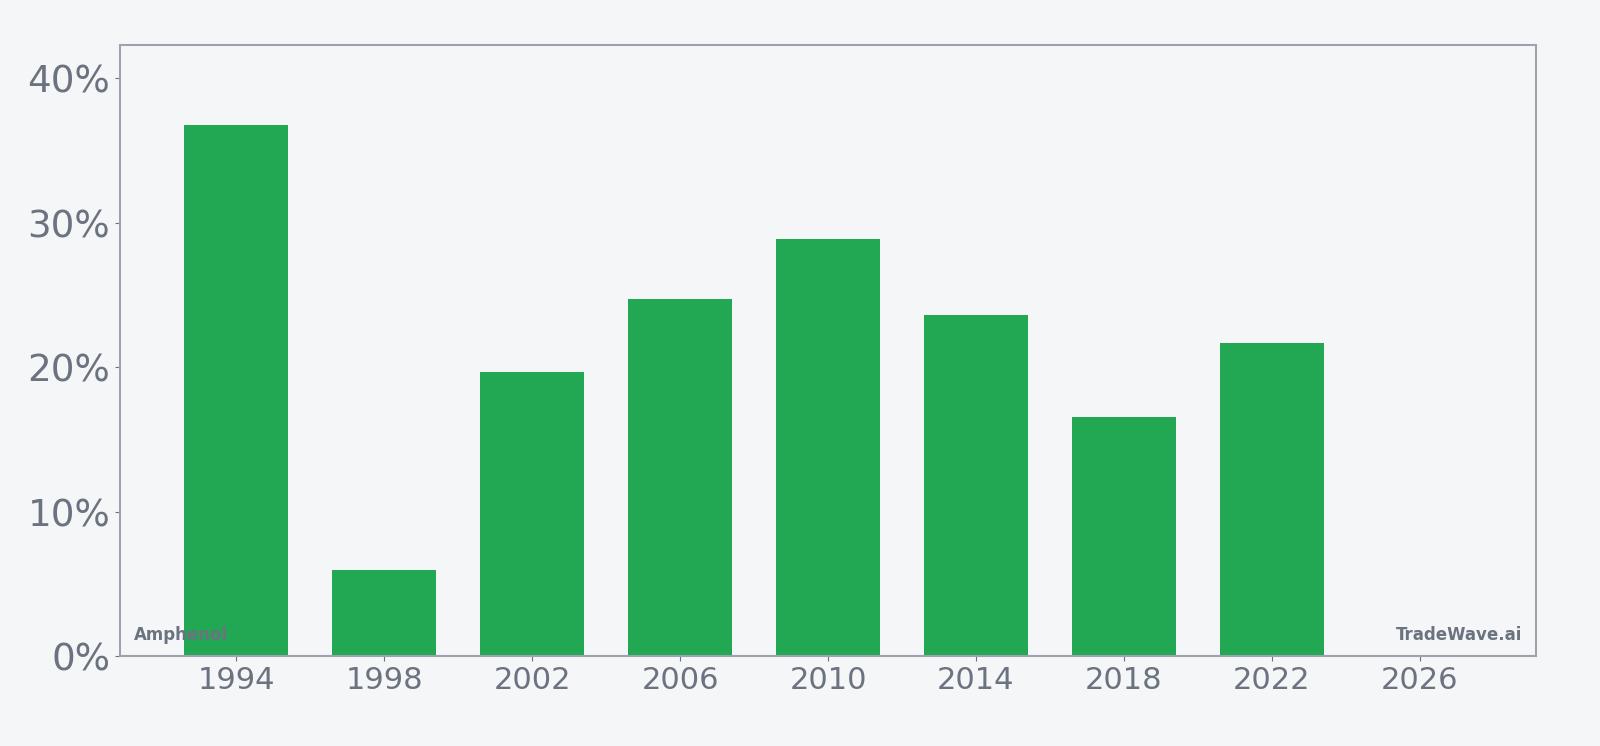
Grouping the data by the presidential election cycle matters here because this window sits in the midterm election year, a phase that often brings policy uncertainty early in the year but historically sets up a stronger risk-on tone as markets look ahead to the pre-election year. For Amphenol, that midterm-to-pre-election bridge has lined up with multi-quarter spending cycles in data centers, broadband and defense, which can amplify the stock’s seasonal trend when capital expenditure plans firm up.
This seasonal window is currently underway, spanning 273 trading days from Jul 11 and historically favoring long exposure in Amphenol. Across the last eight midterm election years in the sample, the stock finished higher every time, with a 257% cumulative gain and no losing windows. Average gains of 17.65% per window sit well above typical single-year returns for a mature industrial, and the median outcome of 20.68% shows that the strength is not just about one or two outlier years.
The per-year breakdown shows that even the weakest midterm-year window, in 1998, still delivered a 5.97% net gain, while stronger cycles such as 2010 and 2014 posted returns of 28.87% and 23.64% respectively. In 2022, a year that was difficult for many growth and hardware names, Amphenol still logged a 21.7% gain across this same calendar slice. That consistency across very different macro backdrops is what makes this APH seasonal trend stand out.
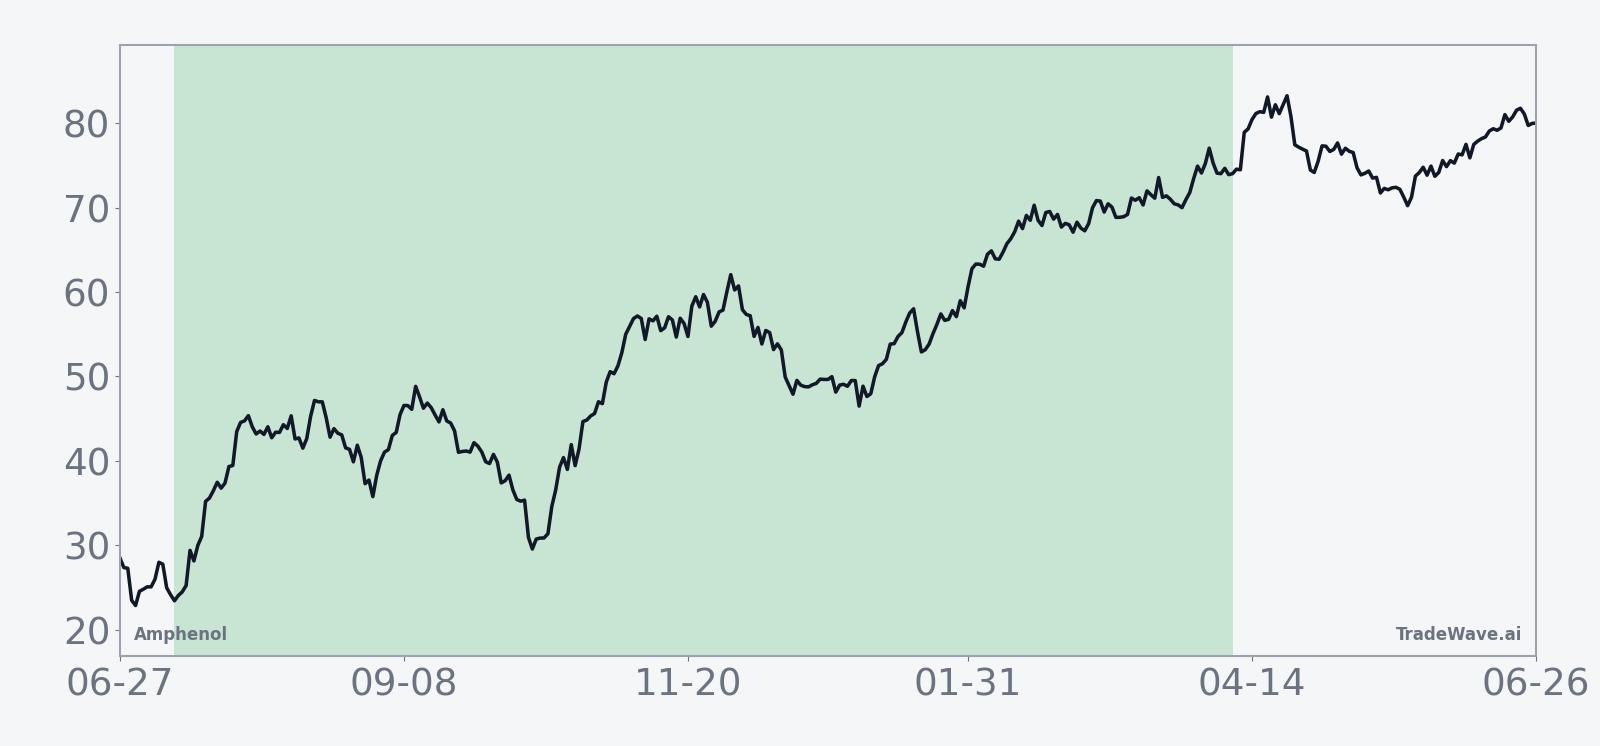
The historical seasonal average trend suggests that gains tend to build steadily rather than in a single burst. In several years, the strongest part of the move has come after the first third of the window, which lines up with the period when midterm political noise fades and corporate spending plans for the following year become clearer. For traders, that pattern implies that patience inside the window has historically been rewarded more often than not.
Year-by-year net returns and intraperiod swings show how upside and drawdowns have coexisted inside this bullish window.
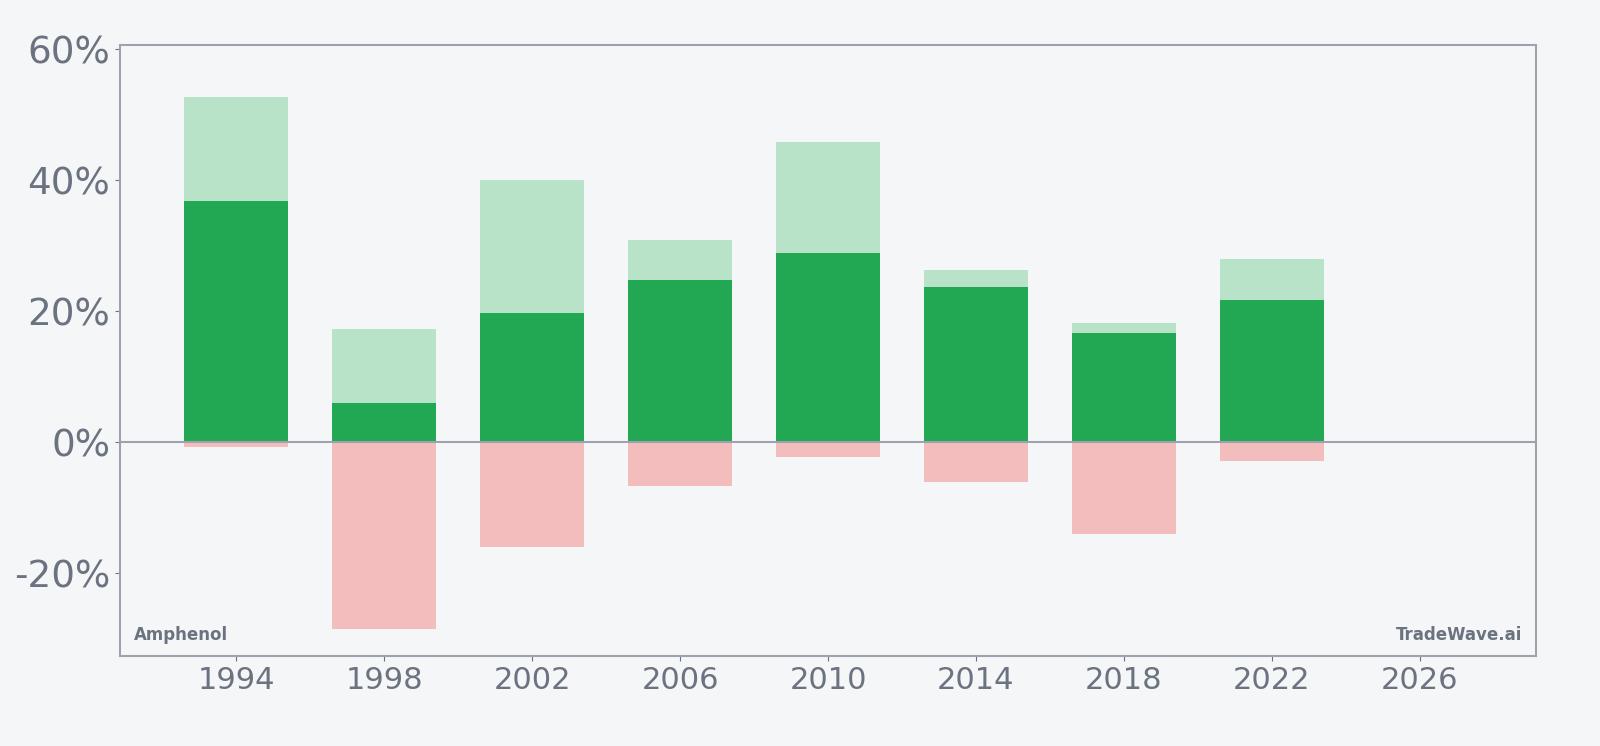
The bars with maximum favorable and adverse excursions underline that this has been a high-conviction but not low-volatility pattern. In 1998, for example, Amphenol ultimately gained 5.97% but endured a maximum adverse move of about -28.47% at one point in the window, while 2010 saw a 28.87% net gain with a peak run-up of 45.86% and only a shallow -2.32% drawdown. That mix of large upside potential and sometimes deep interim pullbacks is exactly what the TradeWave Ratio of 1.59 and Sharpe ratio of 1.49 are capturing: strong directional bias with meaningful swings along the way.
History does not guarantee future results; even in a perfect 8-for-8 window, adverse excursions can be large before the trade direction ultimately wins.
Why does Amphenol (APH) follow this seasonal pattern?
One likely driver is the way Amphenol’s end markets line up with the political and fiscal calendar in midterm years. Data center, broadband and defense customers often finalize multi-year capital spending plans as Washington moves past midterm elections and into the pre-election year, which can translate into stronger order visibility and margin leverage for suppliers like Amphenol.[3] Analysts have also pointed to AI-related content growth per rack and ongoing M&A as structural tailwinds, so when those themes intersect with this midterm-to-pre-election window, the historical seasonality can become more visible in the stock’s path.[1]
What is driving Amphenol (APH) today?
Amphenol closed the latest session at $155.99, down 1.9% on the day, after trading between an intraday low of $154.96 and a high of $160.38 on volume of about 5.5 million shares. That leaves the stock modestly above its 50-day moving average around $147.24 and below its 52-week high near $178.52, a zone where traders are debating whether the pullback is a pause in a longer AI and connectivity uptrend or the start of a deeper consolidation.
In 2025, Amphenol moved to bulk up its broadband and defense interconnect footprint, agreeing to acquire CommScope’s broadband connectivity and cable unit in a roughly $10.5 billion deal including debt and separately striking a $1 billion cash deal for Trexon, a defense-focused cable and interconnect supplier.[2][3] Those transactions, while dated, illustrate the company’s strategy of using M&A to deepen exposure to high-spec connectivity markets that benefit from AI data center buildouts and defense modernization.[3] Bank of America’s 2025 upgrade to Buy, with a higher price target, leaned on the same themes, citing higher AI-related content per rack and sustained AI revenue growth as key supports for the story.[1]
The chart below situates the latest move in its recent multi-month context alongside a short-term seasonal projection.
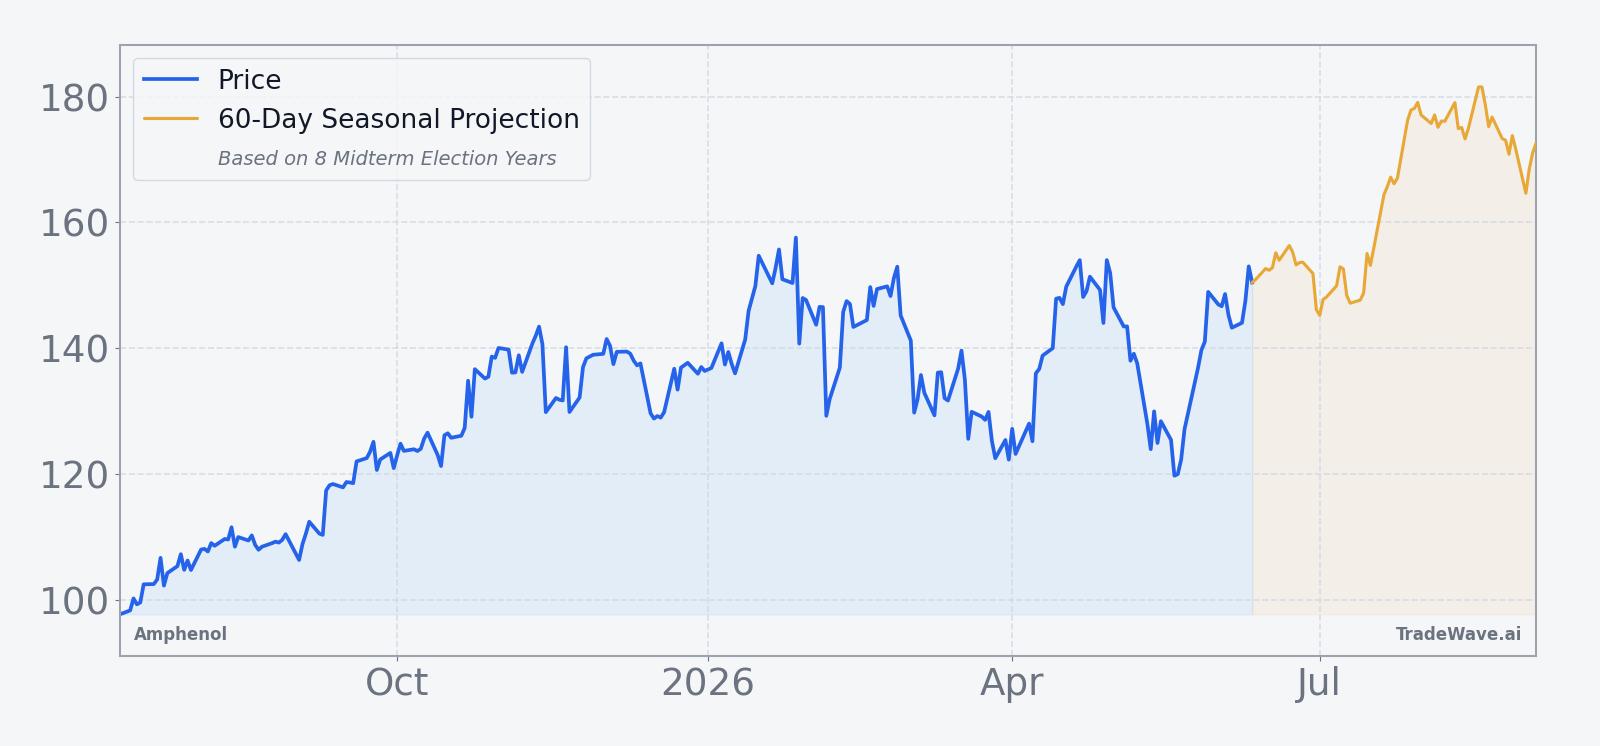
Sector-wise, Amphenol sits at the intersection of communications equipment and industrial electronics, supplying connectors, copper and fiber cables into data centers, broadband networks and defense platforms.[3] That positioning has tied the stock to AI infrastructure spending and to policy-sensitive defense budgets, both of which can be influenced by the midterm election-year policy calendar. As investors look through the latest volatility, the question is how those structural drivers will interact with a seasonal window that has historically leaned strongly in favor of the bulls.
Sources
About this seasonal analysis
Seasonal pattern data is sourced from TradeWave.ai, which analyzes historical price behavior across annual calendar windows going back up to 30 years. Read the full data methodology or the book The 100-Year Pattern by Afshin Moshrefi (2026 edition). Past performance of seasonal patterns does not guarantee future results. This article is for informational purposes only and does not constitute investment advice.