Procter & Gamble (PG) Has Rallied in 10 of 10 Midterm Windows Starting Jul 21
Procter & Gamble is moving into a 155-day midterm-election-year seasonal window that has never been negative in the last 10 cycles, even as the stock trades below its 52-week high and faces margin pressure from tariffs and geopolitical costs.
Price as of Jul 20, 2026: $149.13 (last close).

What is the seasonal pattern for Procter & Gamble (PG)?
Procter & Gamble has risen in 10 of 10 midterm-election-year windows starting Jul 21 and lasting 155 days, with an average gain of 10.26% in winning years.
- 10 for 10 in this window, with Procter & Gamble averaging 10.26% gains across all winning years.
- Seasonal window runs from Jul 21 for 155 trading days, covering late midterm year into the run-up to the pre-election year.
- Percent Profitable is 100%, with 10 winners and 0 losers in the last 10 midterm-election-year cycles.
- Median gain of 11.61% and cumulative return of 162% across these Procter & Gamble trading windows.
- TradeWave Ratio (TWR) of 1.67 and a Sharpe ratio of 1.54 point to strong upside moves relative to volatility.
- Individual years have still seen sizable intraperiod drawdowns, so the historical seasonality comes with real downside swings along the way.
According to historical data from TradeWave.ai, this midterm-election-year stretch has behaved very differently from an average calendar period for Procter & Gamble. The next section walks through how that pattern has played out in prior cycles and what it means for the current setup.
How has Procter & Gamble (PG) traded in this midterm-year window?
Procter & Gamble has posted gains in every one of the last 10 midterm-election-year windows that start on Jul 21 and run for 155 trading days, averaging 10.26% across those cycles. Shares finished Monday at $149.13, down 0.6% on the day and about 9.5% below the 52-week high of $164.76, leaving room above if the historical PG seasonal trend reasserts itself.
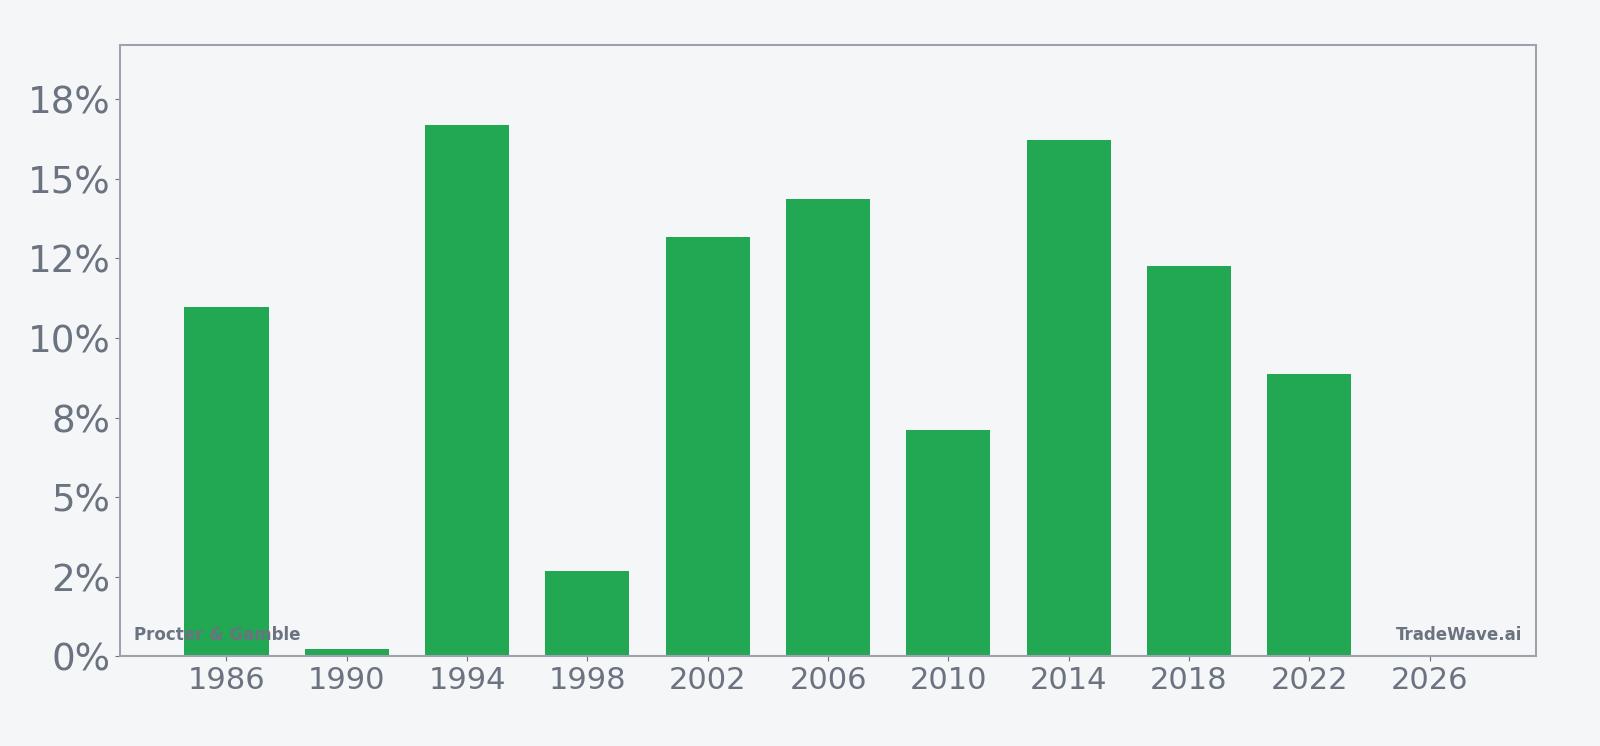
Grouping the data by the presidential election cycle matters here because consumer-staples flows often respond to policy and fiscal shifts that cluster around midterm and pre-election years. This PG seasonal pattern sits in the late part of the midterm year, just before the historically stronger pre-election year when risk appetite and spending plans often firm up.
Across the last 10 midterm-election-year iterations, the trade direction for this Procter & Gamble trading window has been long, and every single year finished positive. The median gain of 11.61% is slightly above the average, which tells you the distribution has been skewed toward solid double-digit advances rather than a few outliers doing all the work.
Individual years show a range of outcomes. The weakest net result was 0.23% in 1990, while the strongest were mid-teens gains such as 16.7% in 1994, 16.23% in 2014, and 14.36% in 2006. Add it up and the cumulative return across these 10 midterm-year windows is 162%, a sizable contribution for a defensive consumer-staples name.
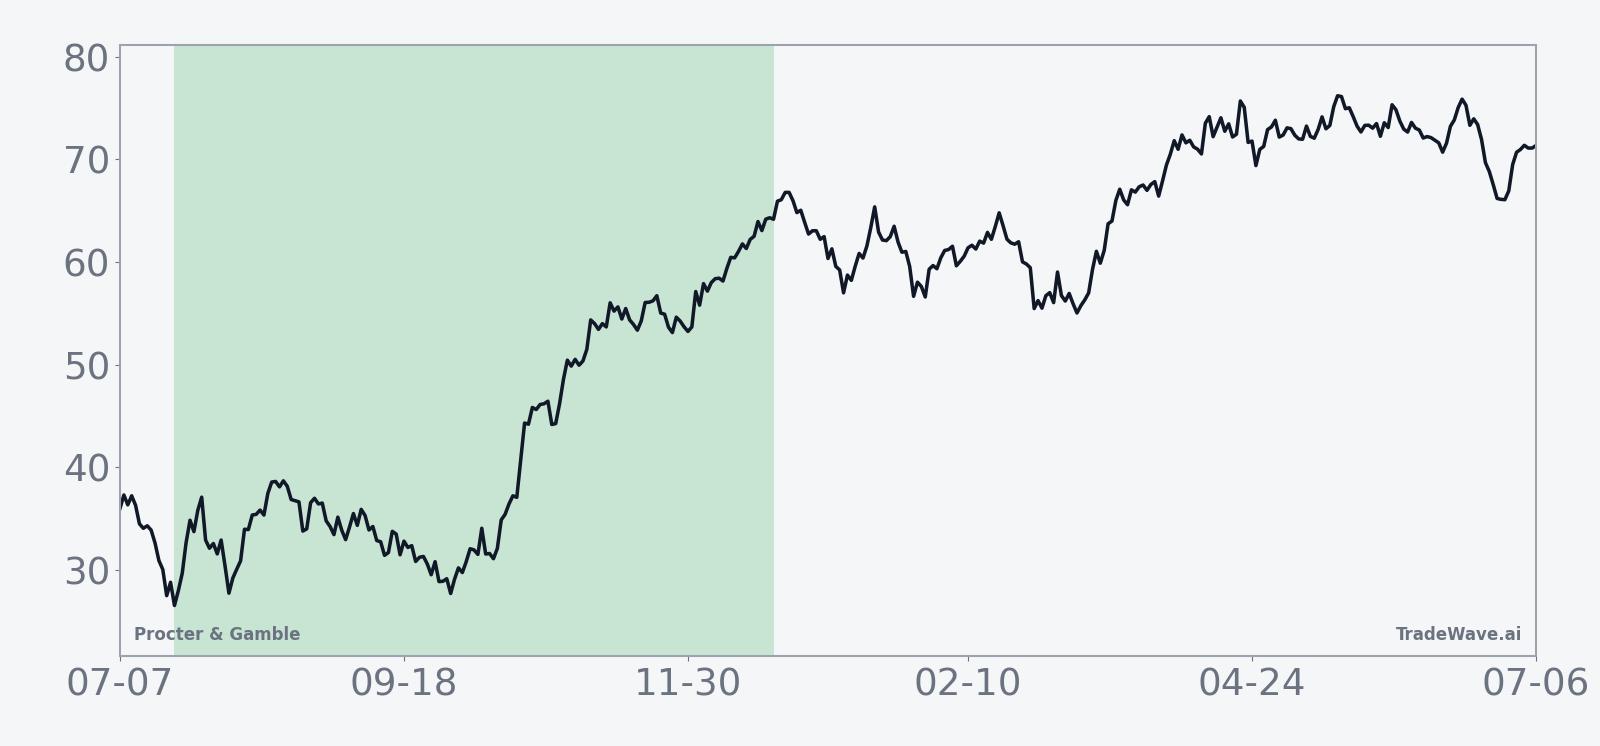
The historical seasonal average curve for this PG seasonal trend slopes steadily higher, with gains tending to build through the middle of the window rather than spiking only at the end. That profile fits a slow-and-steady consumer-staples bid as investors lean into defensive earnings visibility while the macro and policy backdrop evolves heading toward the pre-election year.
Year-by-year net returns and intraperiod swings show how much upside and downside Procter & Gamble has historically seen inside this window.
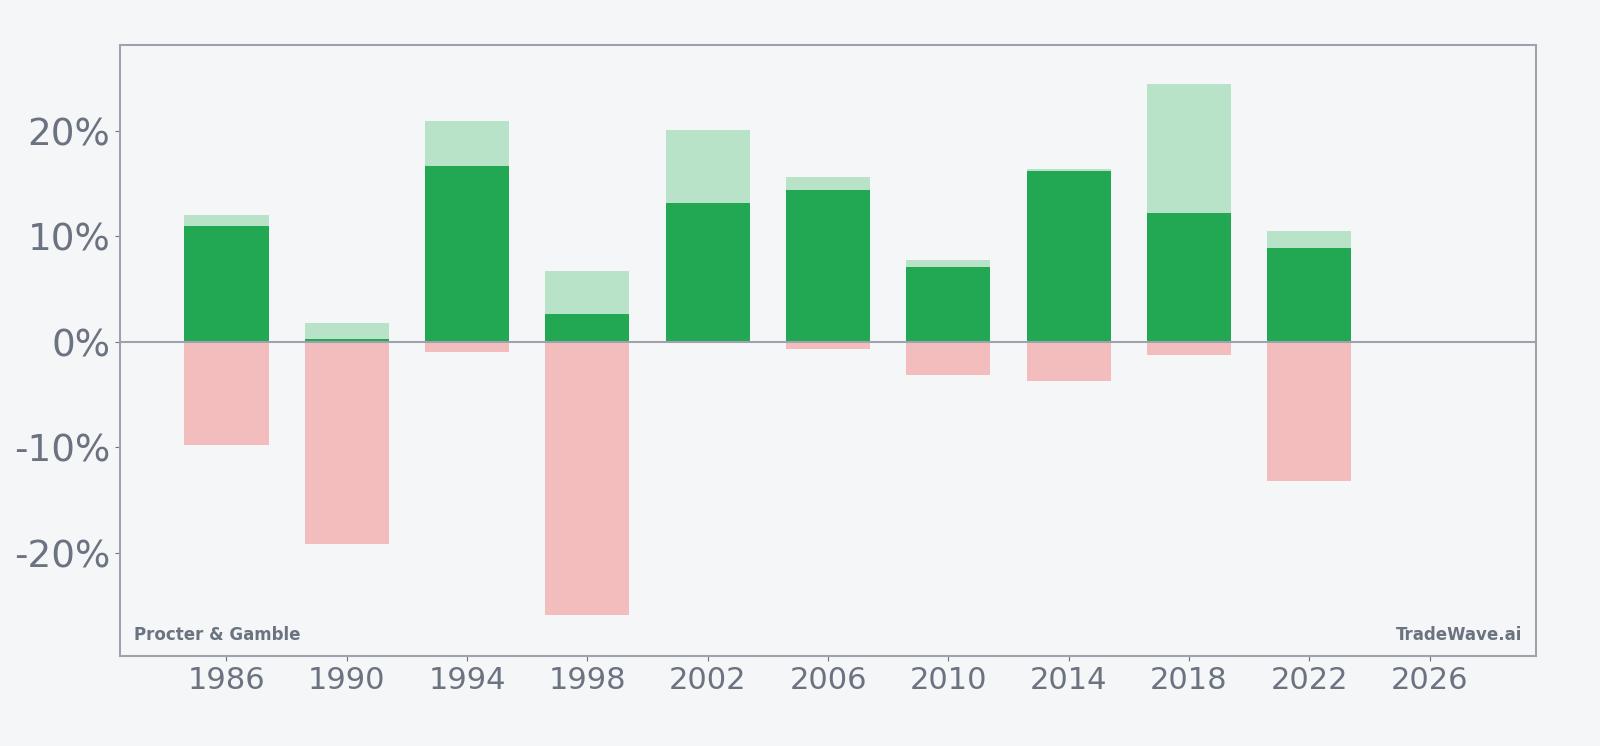
Intraperiod swings have been meaningful. In 1998, for example, Procter & Gamble finished the window up 2.67% but saw a maximum adverse move of about -25.96% at one point, while 1990 delivered only a 0.23% gain despite a nearly -19.16% worst drawdown. On the other side, strong years like 2018 saw a 12.26% net gain with a maximum favorable excursion of 24.51%, showing that when the stock trends in this window it can travel far in the trade direction.
The TradeWave Ratio of 1.67 captures that tendency by measuring how far price typically travels in the long direction within the window, independent of where it closes. Combined with a Sharpe ratio of 1.54, the pattern has historically rewarded long exposure with returns that more than compensated for volatility, even though some years required sitting through double-digit drawdowns.
History does not guarantee future results; adverse excursions (MAE) can be large even in winning windows.
Why does Procter & Gamble (PG) follow this seasonal pattern?
One likely driver is the way consumer-staples positioning shifts around the midterm-election-year policy calendar, as investors balance defensive earnings against changing fiscal and regulatory signals. Procter & Gamble’s fiscal-year cadence also clusters key earnings updates and guidance resets inside this stretch, which can reinforce trends once they start. The pattern may also reflect portfolio rebalancing as large managers rotate between cyclicals and staples heading into the historically stronger pre-election year.
What is driving Procter & Gamble (PG) today?
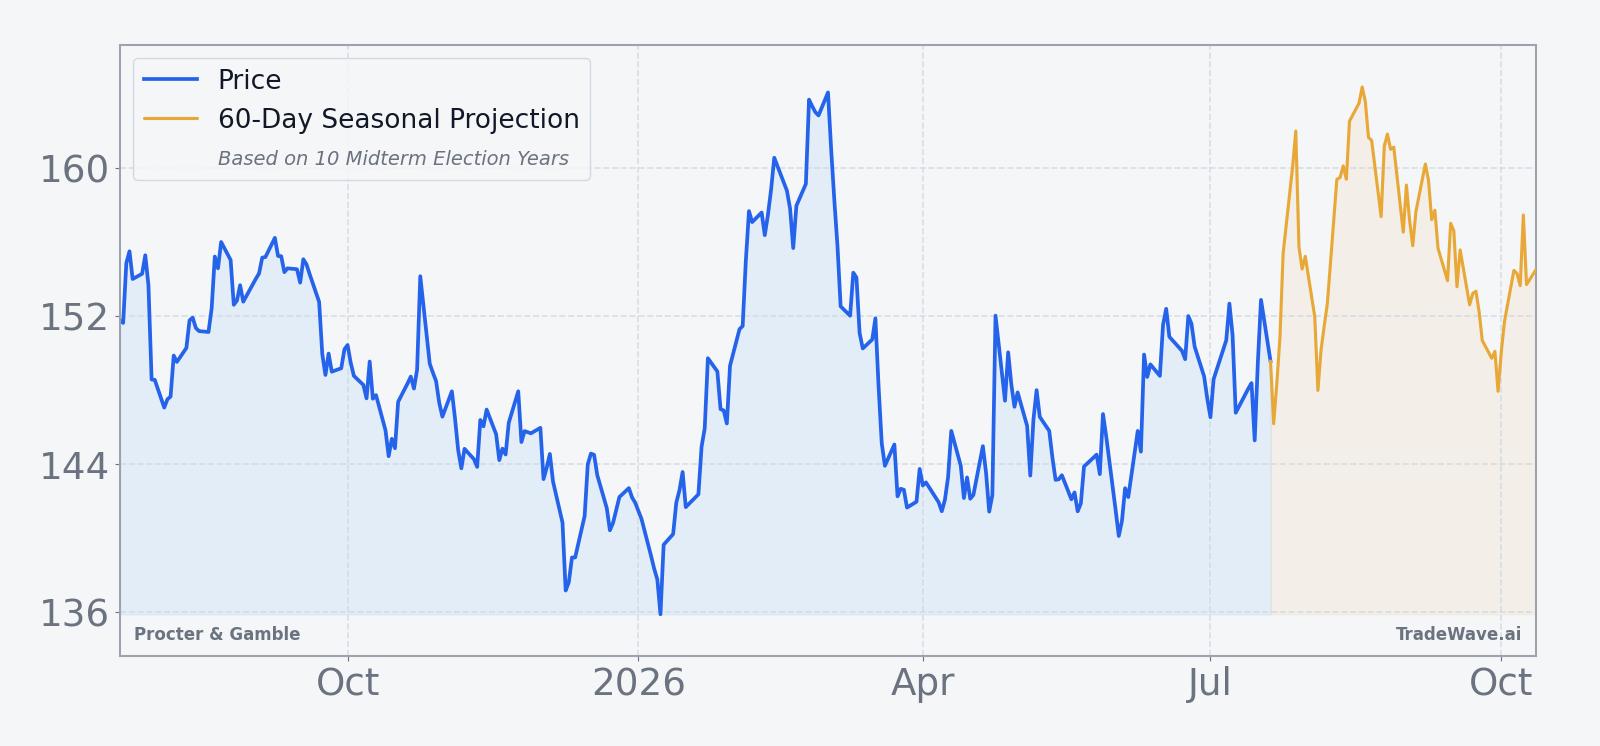
Procter & Gamble closed at $149.13 on Jul 21, down 0.85 points or 0.6% on the day, with trading volume of about 5.8 million shares versus a 20-day average near 9.2 million. The stock sits roughly 11.6% above its 52-week low of $133.67 and about 9.5% below its 52-week high of $164.76, while hovering modestly above its 50-day moving average around $146.66, a setup that leaves it in the middle of its recent range rather than stretched in either direction.
Fundamentally, the latest detailed update came on Apr 24, 2026, when Procter & Gamble reported fiscal Q3 net sales of $21.24 billion, up 7.4% year over year and ahead of estimates, with adjusted EPS between $148.43 and $150.10 depending on the adjustment set used.[1][3] Management reaffirmed full-year organic sales growth of 0% to 4% and an EPS outlook of $6.83 to $7.09, but also flagged rising costs tied to the Iran conflict and higher input prices that could pressure margins.[1]
Those geopolitical and cost headwinds build on earlier tariff-related pressures. In Jul 2025, Procter & Gamble raised U.S. prices on some products to blunt the impact of new tariffs and signaled a CEO transition, moves that underscored how policy shifts can feed directly into consumer-staples pricing and profitability.[4][5] Sector-wide, demand for beauty and grooming products has remained a relative bright spot, helping support operating margins even as management has warned about diverging consumer spending patterns and ongoing cost pressure.[6]
The chart below situates the latest move in its recent multi-month context and overlays a short-term seasonal projection.
What should traders watch in this Procter & Gamble seasonal window?
For this 155-day Procter & Gamble trading window, the first watchpoint is how the stock behaves around its 50-day moving average and the $150 area. A sustained push toward the mid-$150s and then the prior 52-week high near $164.76 would be more consistent with the historical pattern of steady gains, while a break back toward the mid-$130s would mark a clear deviation from the typical midterm-year seasonal path.
Second, earnings and guidance updates that land inside this window will be critical for confirming or challenging the historical seasonality. Any shift in management’s full-year EPS range or commentary on Iran-related costs and tariffs could change how investors treat Procter & Gamble as a defensive anchor in portfolios.[1][4] Traders will also be watching whether beauty and grooming demand continues to offset pressure in other categories, a dynamic that has supported margins in prior quarters.[6]
Finally, behavior relative to the broader consumer-staples sector and the evolving midterm-election-year policy calendar will matter. If Procter & Gamble tracks its historical seasonal trend by grinding higher with contained volatility, that would fit the 10-for-10 record this window carries into the current cycle. A choppy tape with repeated tests of support and deeper drawdowns would not break the pattern by itself, but it would signal that the intraperiod downside risk highlighted by past MAE readings is asserting itself again.
Sources
- Yahoo Finance, "Tide maker P&G beats earnings estimates as Iran war drives up costs" (Apr 24, 2026)
- CNBC, "Procter & Gamble earnings beat estimates as sales grow 7%" (Apr 24, 2026)
- Reuters, "Procter & Gamble hikes US prices amid tariff challenges, CEO change" (Jul 29, 2025)
- Reuters, "Procter & Gamble hikes US prices to blunt tariff hit as CEO transition looms" (Jul 29, 2025)
- Reuters, "P&G latest to flag diverging consumer spending as profit tops on beauty demand" (Oct 24, 2025)
About this seasonal analysis
Seasonal pattern data is sourced from TradeWave.ai, which analyzes historical price behavior across annual calendar windows going back up to 30 years. Read the full data methodology or the book The 100-Year Pattern by Afshin Moshrefi (2026 edition). Past performance of seasonal patterns does not guarantee future results. This article is for informational purposes only and does not constitute investment advice.