10-for-10 Midterm Streak: Johnson & Johnson (JNJ) Enters 125-Day Window Averaging 8.99% Gains
Johnson & Johnson is approaching a historically powerful 125-day midterm-election-year seasonal window just as shares trade near recent highs and investors weigh drug-pricing and pipeline risks.
Price as of Jul 20, 2026: $252.65 (intraday).

What is the seasonal pattern for Johnson & Johnson (JNJ)?
Johnson & Johnson has risen in 10 of 10 midterm-election-year windows starting around Aug. 5, with an average gain of 8.99% in winning years.
- 10 for 10 in this window, averaging 8.99% gains in winning years across the last 10 midterm election cycles.
- Seasonal window begins Aug. 5 and runs 125 trading days, covering the late midterm year into the handoff toward the pre-election year.
- Percent Profitable is 100%, with 10 winners and 0 losers in this Johnson & Johnson trading window.
- Median outcome is a 9.88% gain, with a cumulative 135% return across all ten historical windows.
- Maximum favorable moves inside the window have reached more than 20% in some years, while adverse swings have at times exceeded 10% before recovering.
- Trade Direction is long, with a Sharpe ratio of 2.44 and a TradeWave Ratio of 2.35, pointing to historically strong risk-adjusted upside in this JNJ seasonal trend.
According to historical data from TradeWave.ai, this upcoming stretch for Johnson & Johnson has behaved very differently from an average quarter in prior midterm election years. The next section looks at how that election-cycle seasonal pattern has lined up with past price action.
How has Johnson & Johnson (JNJ) traded in this midterm-year seasonal window?
Johnson & Johnson has risen in every one of the last 10 midterm-election-year windows that start around Aug. 5 and run for 125 trading days, averaging 8.99% gains with a 135% cumulative return across those cycles. Shares finished Monday at $252.63, down 0.2% on the day and about 6.2% below their 52-week high of $269.43, after a roughly 8.0% gain over the past month. That combination of a strong historical seasonality profile and a stock already grinding higher gives this year’s window more weight than a typical calendar quirk.
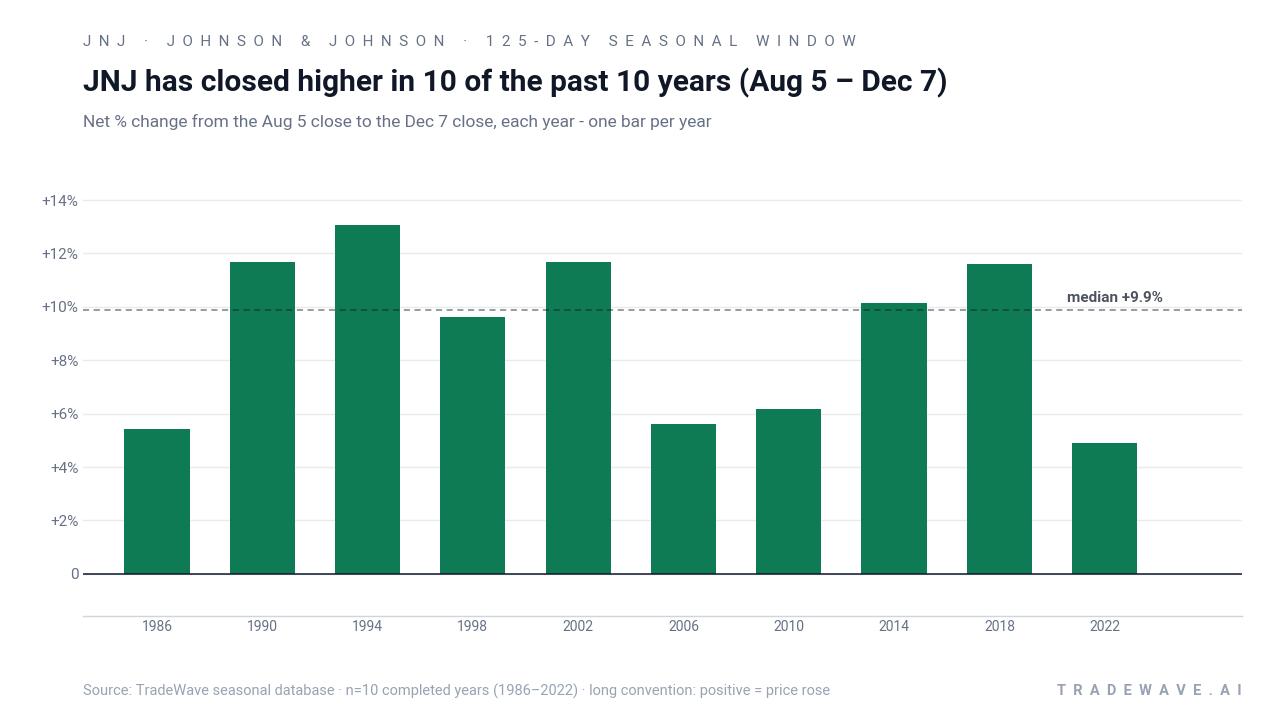
The pattern is grouped by the presidential election cycle, focusing on the last 10 midterm election years rather than consecutive calendar years. That matters because midterm years often feature heavier policy noise and regulatory headlines for large drugmakers, which can cluster volatility into specific parts of the year even when the full-year trend is constructive.
Across those ten midterm-year windows, Johnson & Johnson’s seasonal bias has been clearly bullish. Percent Profitable is 100%, with 10 winners and 0 losers, and the median outcome is a 9.88% gain, slightly above the average, which suggests the distribution of returns has been tight rather than driven by one or two outliers. Add it up and the cumulative gain across all ten windows is 135%, a sizable contribution for a defensive healthcare name.
The per-year table shows that the strongest midterm-year window came in 1994, when the stock gained 13.05% over the 125 trading days, with a maximum favorable move of 18.73% and only a shallow 0.78% intraperiod drawdown from entry. On the softer end, 2022 still delivered a 4.91% net gain, but the stock first slipped as much as 6.35% below the starting level before recovering, underscoring that even “all green” windows can involve uncomfortable swings.
Looking at intraperiod behavior, the maximum favorable excursions have been consistently larger than the final net gains. In 1998, for example, Johnson & Johnson’s best run-up inside the window reached 20.52%, while the final net gain settled at 9.61%. That gap is what the TradeWave Ratio of 2.35 is capturing: how far price typically travels in the trade direction within the window, independent of where it finishes.
On the downside, maximum adverse excursions have ranged from almost no drawdown in years like 1994 and 2006 to double-digit setbacks such as the 10.55% dip in 1986 before the stock finished that window up 5.44%. In 2002, the pattern was unusually smooth, with a 22.8% peak favorable move and a small 1.2% intraperiod gain at the worst point, which is rare for a large-cap stock in a midterm year.
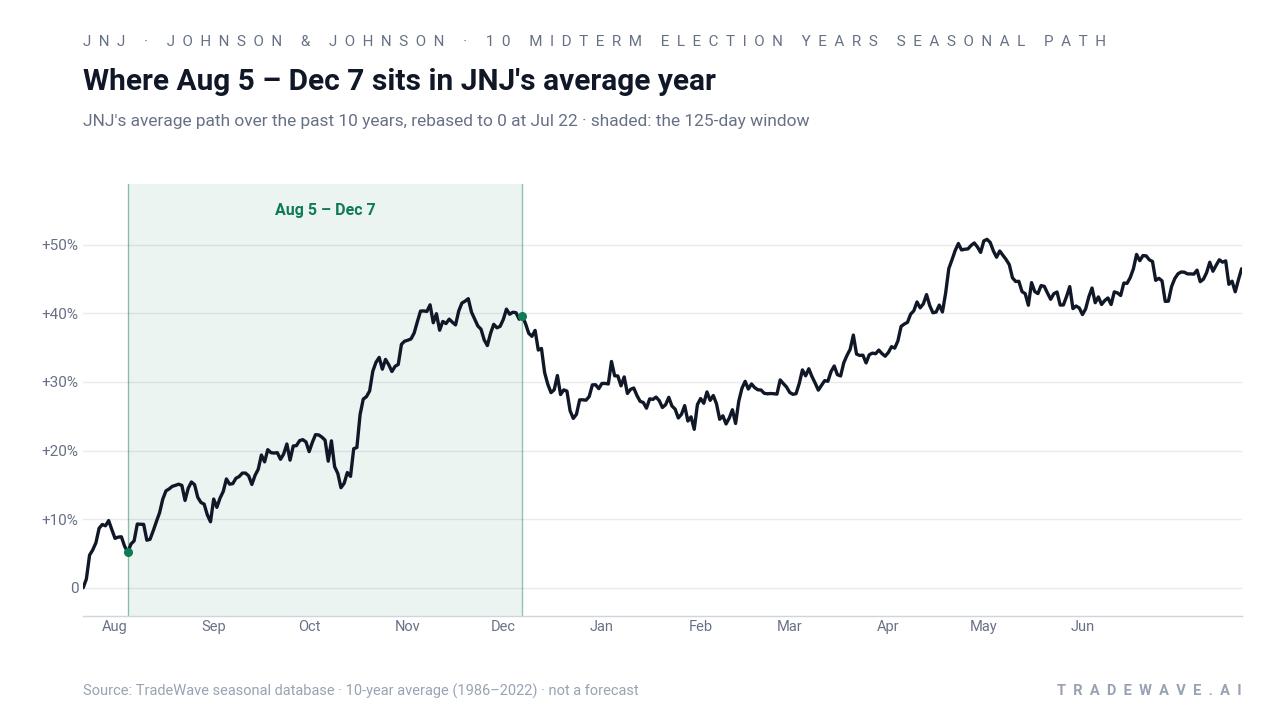
The historical seasonal average trend line slopes higher through most of the 125-day stretch, with gains tending to build steadily rather than in one sharp burst. The early part of the window often sees modest consolidation, followed by a more persistent climb into the back half, which lines up with the typical pattern of investors repositioning as midterm-year policy uncertainty begins to clear.
A second view, combining net results with peak run-ups and worst drawdowns, shows how that upside has coexisted with meaningful volatility.
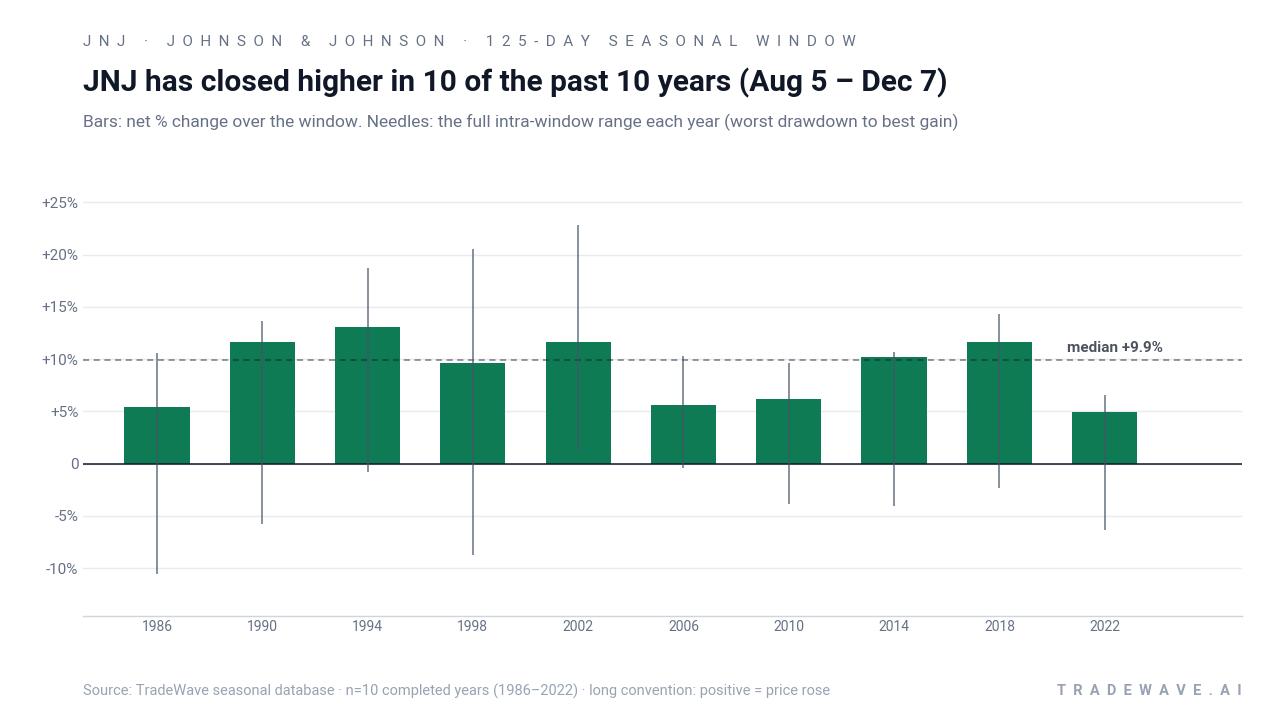
The stacked bars make the trade-off clear: in most years, the maximum favorable move inside the window has been roughly 1.5 to 2 times the final net gain, while the worst drawdowns have typically been mid-single digits but occasionally stretched toward 10%. For a long-only seasonal setup, that profile has historically rewarded patience, but it has not been a straight line.
History does not guarantee future results; adverse excursions can be large even in winning windows, and past midterm-year behavior may not repeat.
Why does Johnson & Johnson (JNJ) follow this seasonal pattern?
One likely driver is the way healthcare policy and reimbursement debates tend to peak in midterm election years, followed by clearer visibility on drug pricing and regulation as the year progresses. Analysts have also pointed to institutional portfolio repositioning into defensive, cash-generative names like Johnson & Johnson as midterm uncertainty fades and the market starts to look ahead to the historically stronger pre-election year. This pattern may also reflect the company’s earnings calendar, with fall and early-winter updates often reinforcing guidance and pipeline narratives after a noisy first half.
What is driving Johnson & Johnson (JNJ) today?
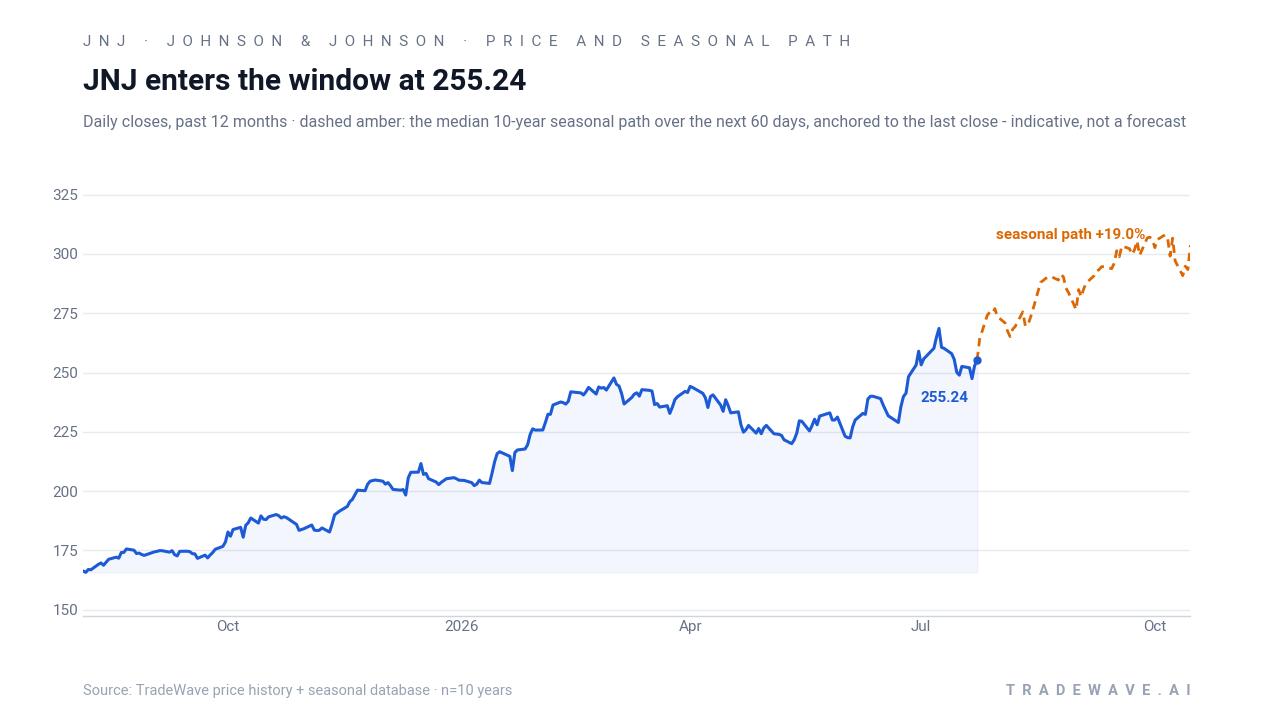
Johnson & Johnson closed Monday at $252.63, down 0.2% on the day, after trading between $251.50 and $254.18 on relatively light volume of about 396,000 shares versus a 20-day average near 9.2 million. The stock has climbed roughly 8.0% over the past month and sits about 6.2% below its 52-week high of $269.43, while holding well above its 50-day moving average around $237.97, a setup that keeps the near-term trend pointed higher.
Fundamentally, the story investors are trading is still anchored in earnings and guidance delivered earlier this year. In January 2026, Johnson & Johnson forecast 2026 profit of $11.43 to $11.63 per share and operational sales of $99.5 billion to $100.5 billion, topping Wall Street estimates and signaling that oncology and autoimmune drugs would continue to drive growth despite pricing pressure on older products.[2] The company’s Q4 2025 results showed adjusted earnings of $2.46 per share on $24.56 billion in revenue, both slightly ahead of expectations, with management highlighting strong performance in cancer and autoimmune treatments.[5]
Product-level momentum has been another support. In February 2026, coverage of Johnson & Johnson’s valuation pointed to robust growth from oncology drugs such as Carvykti and Darzalex, as well as autoimmune therapy Tremfya, alongside a rebound in the MedTech segment.[4] That mix has helped offset the drag from Stelara’s decline and given investors more confidence that the pipeline can sustain mid-single-digit sales growth and double-digit earnings growth into the back half of the decade.[4]
On the sell-side, sentiment has tilted more constructive. In late January 2026, Morgan Stanley upgraded Johnson & Johnson to overweight from equal weight and raised its price target to $262, citing a “robust new product cycle” and projecting 2026–2030 revenue and EPS compound annual growth rates of roughly 5.5% and 12%, respectively.[1] Opinion pieces around the turn of the year also framed 2026 as a year with potential upside for the stock, given the combination of pipeline catalysts and a still-defensive balance sheet.[3]
Macro and policy risk have not disappeared, though. In January 2026, reporting on the company’s guidance noted that drug pricing pressures and tariff concerns remained headwinds, even as Johnson & Johnson reached a deal with the U.S. administration to lower prices on some medicines while still projecting above-consensus profit.[2] For a diversified healthcare giant, that backdrop reinforces why investors often lean on historical seasonality and election-cycle patterns to frame risk and opportunity around policy-heavy periods.
The chart below situates the latest move in its recent multi-month context and overlays the near-term seasonal projection.
What should traders watch as this Johnson & Johnson (JNJ) window opens?
First, the calendar: the 125-day midterm-year window begins on Aug. 5 and runs deep into the fourth quarter, overlapping a period when policy noise typically fades and earnings visibility improves. Traders will be watching how Johnson & Johnson behaves around that start date relative to its historical pattern of early consolidation followed by a steadier climb.
Second, levels: on the upside, the 52-week high near $269.43 is the obvious reference, while on the downside, the 50-day moving average around $237.97 and the recent one-month breakout zone form a band where past windows have sometimes seen mid-single-digit drawdowns before resuming higher. A move that respects those supports while grinding higher would be consistent with the historical seasonal trend; a sharp break that turns this into the first losing midterm-year window would mark a clear departure from the last ten cycles.
Third, catalysts: the next major checkpoints will be upcoming earnings updates and any fresh headlines on U.S. drug pricing or tariffs, which have historically shaped sentiment for large-cap pharma and MedTech names.[2] Stronger-than-expected oncology and MedTech numbers, or clearer visibility on pricing, would align with the bullish seasonal backdrop, while negative surprises could test how durable that pattern really is.
Finally, volatility inside the window matters as much as the final score. Past midterm-year stretches have seen maximum favorable moves that are significantly larger than the final net gains, alongside occasional 6% to 10% drawdowns before recovery. Traders who track how Johnson & Johnson trades around those swings will get an early read on whether this cycle is following the familiar script or writing a new one.
Sources
- CNBC, "Morgan Stanley upgrades Johnson & Johnson, sees upside on robust drug pipeline," Jan 28, 2026.
- Reuters, "Johnson & Johnson forecasts 2026 profit above Wall Street estimates," Jan 21, 2026.
- Forbes, "More Upside For JNJ Stock In 2026?," Dec 30, 2025.
- Forbes, "Does JNJ Stock Still Offer Value?," Feb 23, 2026.
- Wall Street Journal, "J&J’s Sales and Profit Rise on Strong Cancer and Autoimmune Drug Sales," Jan 21, 2026.
About this seasonal analysis
Seasonal pattern data is sourced from TradeWave.ai, which analyzes historical price behavior across annual calendar windows going back up to 30 years. Read the full data methodology or the book The 100-Year Pattern by Afshin Moshrefi (2026 edition). Past performance of seasonal patterns does not guarantee future results. This article is for informational purposes only and does not constitute investment advice.