8-for-8 Midterm Run: Synopsys (SNPS) Enters 282-Day Window Averaging 28.74% Gains
Synopsys is trading near a 52-week low just weeks before a historically powerful 282-day midterm-year seasonal window that has never produced a loss.
Price as of Jul 20, 2026: $378.46 (last close).

What is the seasonal pattern for Synopsys (SNPS)?
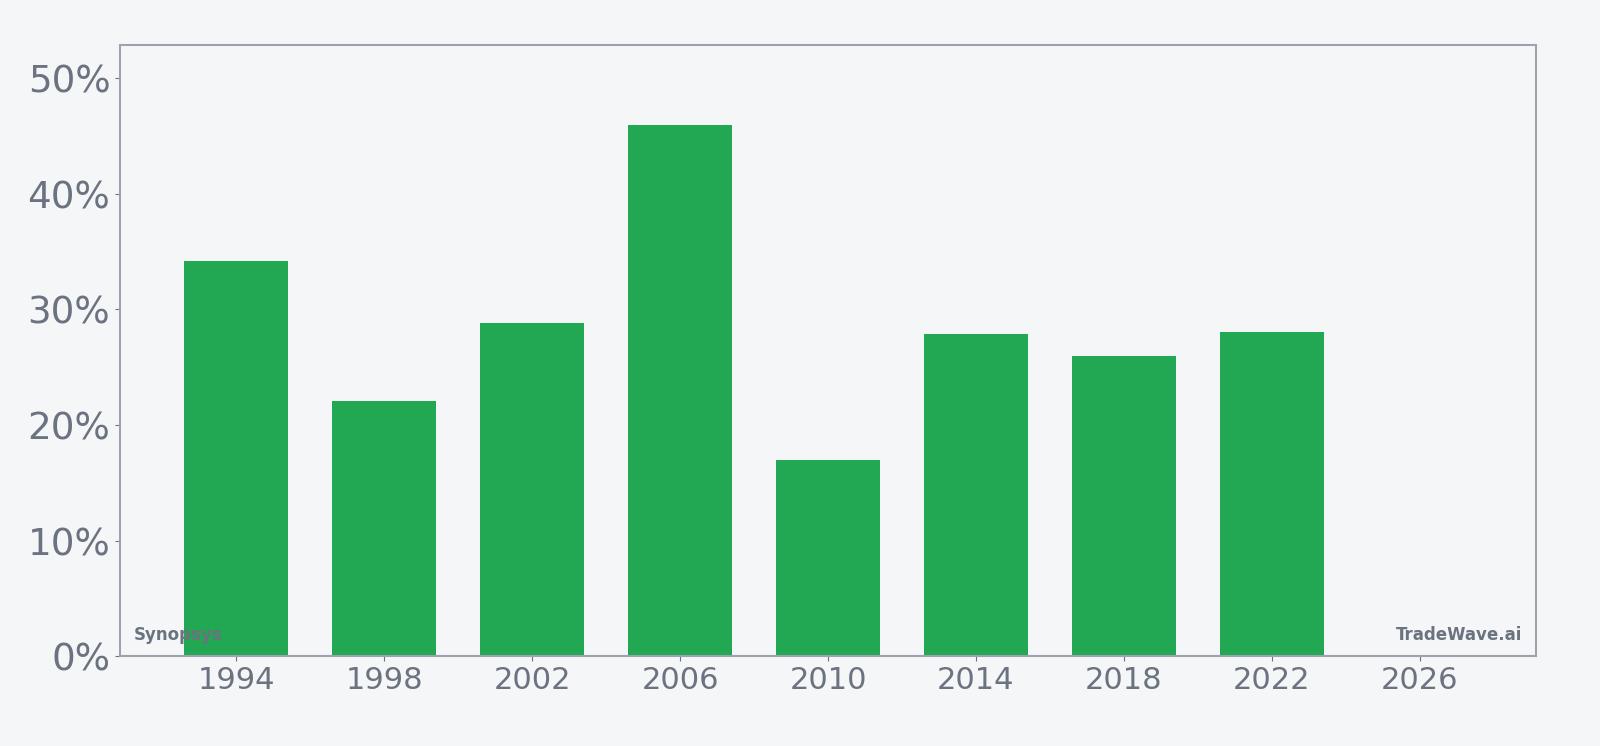
Synopsys has risen in 8 of 8 midterm-year windows starting around Aug 19, with an average gain of 28.74% in winning years.
- 8 for 8 in this window, with Synopsys averaging 28.74% gains across all winning years.
- The upcoming 282-day trading window begins Aug 19, 2026 and covers the last stretch of the midterm election year into the following summer.
- Percent Profitable is 100%, with 8 winners and 0 losers across the last eight midterm election years.
- Average annualized return in the window is 28.5%, with a Sharpe ratio of 2.98 on end-of-window outcomes.
- The TradeWave Ratio of 2.21 signals that price has typically traveled meaningfully in the long direction during the window, even within choppy years.
- Individual years have seen adverse moves as deep as about 30% inside the window, so the path has not been a straight line even when the final result was positive.
According to historical data from TradeWave.ai, this midterm-year stretch for Synopsys has behaved very differently from an average year-end rally, with a distinct election-cycle flavor that shows up in the numbers.
How has Synopsys (SNPS) traded in past midterm-year windows?
Synopsys has rallied in every one of the last eight midterm election years during this 282-day window, averaging gains of 28.74% with no losing cycles. The next iteration of that window begins on Aug 19, 2026, with the stock currently at $378.46, about 41.9% below its 52-week high of $651.73 and only about 3.4% above its 52-week low of $366.00. That combination of deep drawdown and historically strong midterm-year seasonality is the setup traders are staring at as summer winds down.
Grouping the data by the presidential election cycle matters here because this window sits in the heart of the midterm election year, a phase that often brings policy noise early in the year but has historically rewarded risk-taking as markets look ahead to the pre-election year. For a design-software heavyweight like Synopsys, that means the seasonal pattern is capturing not just calendar effects but also how investors typically reposition around regulation, spending priorities and semiconductor demand as Washington’s agenda evolves.
Across the last eight midterm election years, the trade direction for this pattern has been long, and every single iteration finished in the green. Percent Profitable is 100%, with 8 winners and 0 losers, and the average winner gained 28.74% over the 282 trading days. The median outcome of 27.96% shows that the gains have not been skewed by a single outlier year; several cycles have delivered strong double-digit returns.
The annualized return inside the window clocks in at 28.5%, paired with a Sharpe ratio of 2.98 based on end-of-window results. That is an unusually high risk-adjusted profile for a single stock over such a long stretch, especially given that the window spans most of a year. Add it up: 643% cumulative return across the eight midterm-year windows, which is why this slice of the calendar stands out in the SNPS seasonal trend.
Individual years show how that has played out. In 2006, Synopsys gained 45.98% from entry to exit, with a maximum favorable move of 58.84% and only a 1.0% worst drawdown from the starting point. In 1994, the stock returned 34.15% with a 44.51% peak run-up and just a 3.66% adverse move from entry, a relatively smooth ride for a long trade.
Other years were more volatile even though they still finished higher. In 1998, Synopsys ended the window up 22.09%, but the best intraperiod rally reached 73.14% while the worst drawdown from entry hit 30.74%. The 2022 midterm-year window told a similar story: a 28.05% net gain, a 28.93% maximum favorable move and a 26.45% maximum adverse move along the way. Those paths underline that even a strong seasonal bias can involve deep shakeouts.
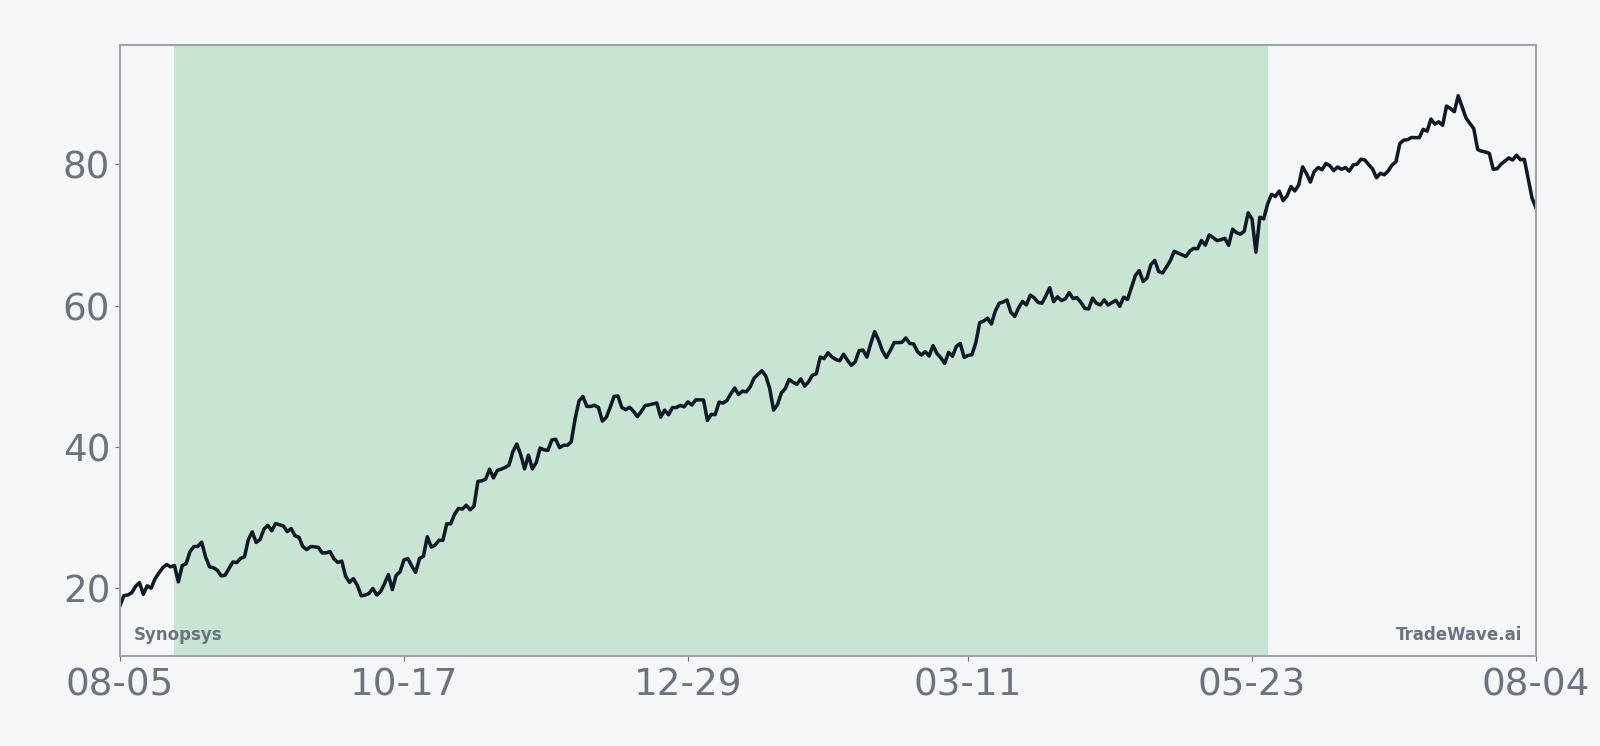
The historical seasonal average trend line slopes higher across most of the 282-day span, with gains tending to build steadily rather than arriving in a single burst. The curve suggests that strength often persists well into the following year, consistent with the broader pattern of pre-election-year optimism in equities. There are softer patches inside the window, but the typical path has been an upward grind rather than a boom-and-bust spike.
Year-by-year net returns and intraperiod swings show how much room Synopsys has historically had to run and how deep the setbacks have been inside this window.
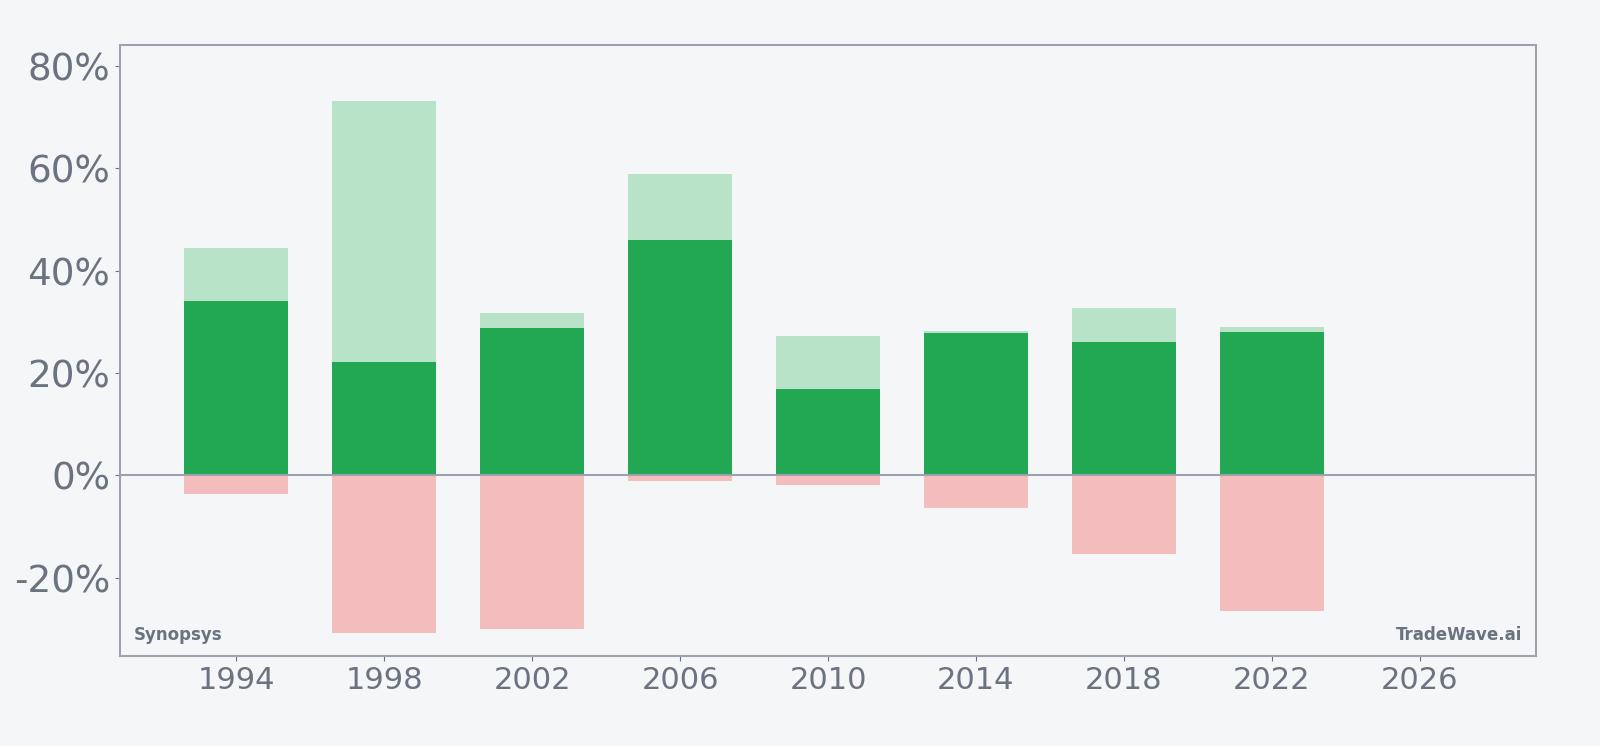
The combined net/MFE/MAE bars make the trade-off clear: in strong years, Synopsys has often pushed 25% to 45% higher at some point in the window, but several cycles also saw 15% to 30% drawdowns from the starting level before finishing higher. For long setups, that profile has rewarded patience, yet it also means position sizing and risk limits matter if the next midterm-year window rhymes with the past.
History does not guarantee future results; adverse excursions can be large even in winning windows, and past midterm-year strength for Synopsys may not repeat.
Why does Synopsys (SNPS) follow this seasonal pattern?
One likely driver is the way Synopsys’ earnings and guidance cadence lines up with the election cycle, with multiple quarters of results and outlook updates landing inside this late-year-to-summer stretch as investors handicap semiconductor and AI spending.[4] Analysts have also pointed to institutional portfolio repositioning around policy and regulation in midterm years, which can favor high-quality software names once early-year volatility passes.[5] The pattern may also reflect sector rotation into electronic design automation as chipmakers lock in design tools and IP ahead of new product cycles, a process that often accelerates into the pre-election year.[9]
What is driving Synopsys (SNPS) today?
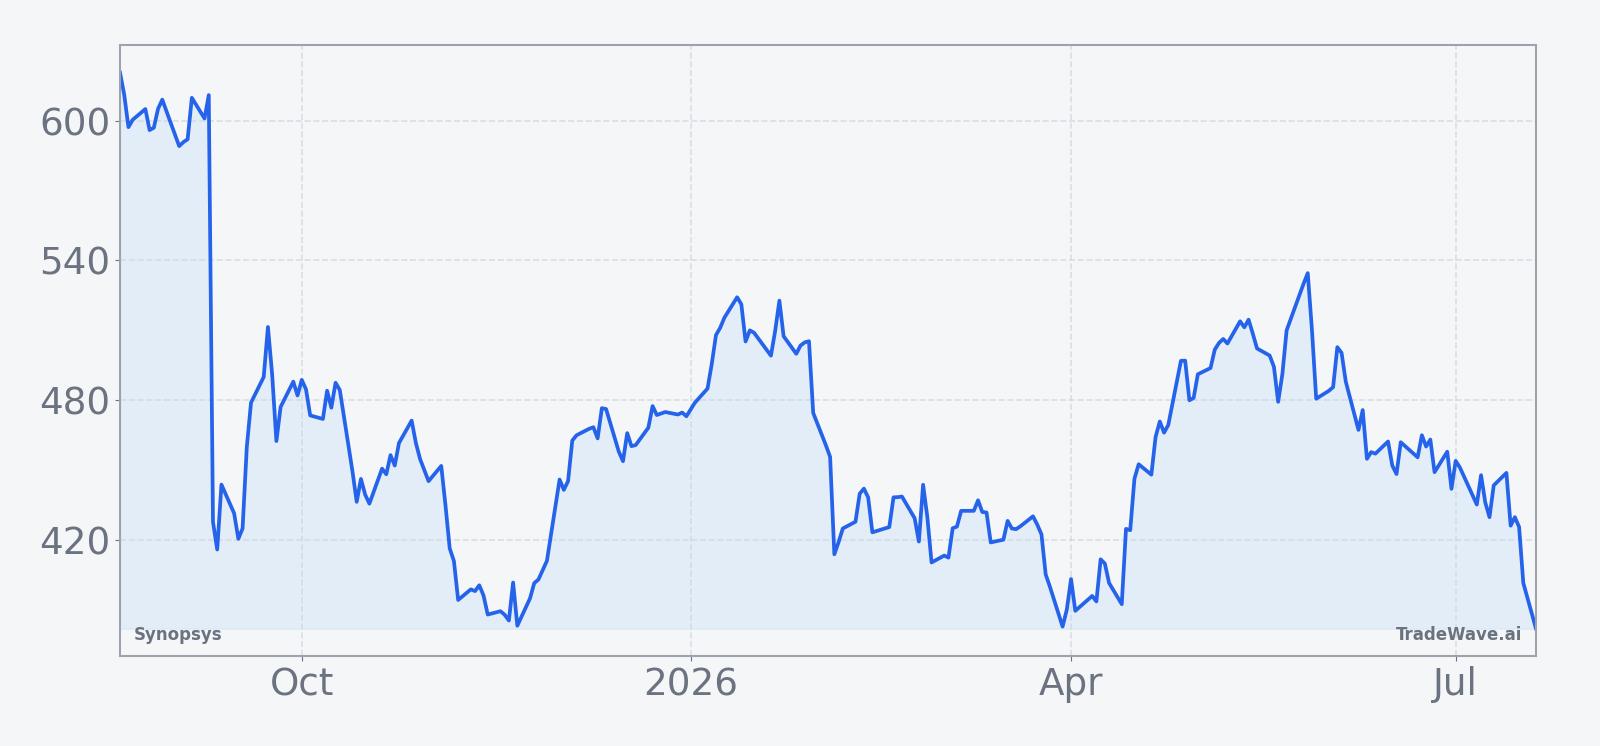
Synopsys closed the latest session at $378.46, down 1.5% on the day and roughly 18.2% lower year to date, leaving the stock deep in correction territory and far below its 50-day moving average around $468.97. Shares sit about 41.9% under the 52-week high of $651.73 and only a few dollars above the 52-week low, a backdrop that has turned a once momentum-heavy AI and chip-design play into a value debate for growth investors.
Fundamentals have not collapsed. In fiscal Q2 2026, Synopsys reported revenue of roughly $2.28 billion to $2.41 billion, ahead of estimates, with adjusted EPS between $373.86 and $385.18 topping consensus and full-year guidance raised across several reports.[1] Analysts have kept a “Moderate Buy” stance with a consensus target around $570.06, even as they acknowledge that the stock’s slide has opened a gap between price and prior expectations.[4][5] That disconnect between solid execution and weak share performance is part of what makes the upcoming seasonal window so interesting.
Corporate drama has added another layer. In March 2026, activist investor Elliott Investment Management disclosed a multibillion-dollar stake and signaled plans to push for better monetization of Synopsys’ software and IP portfolio, a move that typically brings scrutiny of margins, capital allocation and potential portfolio moves.[9] Earlier regulatory headwinds, including export restrictions and foundry disruptions that weighed on 2025 results, remain in the background as investors weigh how much of that risk is already priced in.[12]
The chart below situates the latest pullback against the past year’s trading range and a short-term seasonal projection.
In July 2026, MarketBeat noted that despite the stock’s weakness, analysts broadly maintained positive long-term views on Synopsys, citing AI-driven chip complexity and sustained demand for electronic design automation tools as structural tailwinds.[4][5][9] That sector backdrop has not insulated the stock from volatility, but it does frame the current selloff as a valuation reset rather than a collapse in the business model. For traders watching the SNPS seasonal trend, the question is how that fundamental story interacts with a calendar window that has historically favored the bulls.
What should traders watch as the next Synopsys seasonal window opens?
With the new 282-day midterm-year window set to start on Aug 19, the first thing to watch is whether Synopsys can stabilize above the recent 52-week low around $366 and reclaim the 50-day moving average zone near $469. A firm base near current levels would echo prior cycles where the stock entered the window from a position of weakness and then ground higher over subsequent quarters. A decisive break to fresh lows, by contrast, would mark a departure from the historical script and raise the odds that this iteration behaves differently.
Policy and macro headlines will matter as well. The back half of a midterm election year often brings clarity on regulation, spending and tax priorities, which can influence sentiment toward complex software and semiconductor names like Synopsys.[12] Traders should track any new commentary on export controls, AI-related rules or foundry relationships, since those were key pressure points in 2025 and could either ease or intensify as the window unfolds.[12]
On the corporate side, upcoming earnings and any follow-up from Elliott’s activist campaign will be key checkpoints.[1][4][9] Stronger-than-feared results or concrete steps on capital returns and margin expansion would align with the historical pattern of midterm-year strength, while guidance cuts or a stalled activist agenda could blunt the seasonal tailwind. Price action around those catalysts will show whether institutions are leaning into the SNPS seasonal trend or using rallies to lighten exposure.
Finally, behavior inside the window will be just as important as the final outcome. In prior cycles, Synopsys has often seen 15% to 30% drawdowns from entry even in winning years, so a sharp shakeout early in the window would not automatically invalidate the pattern. What would contradict the historical playbook is a sustained failure to build higher highs over the 282 days or a year that finishes flat to down despite strong sector demand. For traders who care about seasonality, the next midterm-year stretch is less about a guaranteed rally and more about whether one of Synopsys’ cleanest historical windows can survive a very different macro and regulatory backdrop.
Sources
- MarketBeat: Synopsys (NASDAQ:SNPS) Posts Earnings Results (Feb 26, 2026)
- MarketBeat: Synopsys (SNPS) Stock Price, News & Analysis (Oct 27, 2025)
- MarketBeat: Synopsys (SNPS) Expected to Announce Earnings on Wednesday (Feb 18, 2026)
- MarketBeat: Synopsys, Inc. (NASDAQ:SNPS) Given Average Rating of "Moderate Buy" by Analysts (Jul 12, 2026)
- MarketBeat: SNPS Stock Lags After Earnings Despite Analyst Target Upgrades (May 29, 2026)
- Barchart: SNPS - Synopsys Stock Price (Jul 18, 2026)
- Forbes: Synopsys Stock Nears Technical Floor - Buy The Dip? (Nov 13, 2025)
- Morningstar / PR Newswire: SNPS Investors Have Opportunity to Lead Synopsys, Inc. Securities Fraud Lawsuit (Dec 8, 2025)
- MarketBeat (Reuters referenced): Activist Elliott takes multibillion-dollar stake in Synopsys, WSJ reports (Mar 22, 2026)
About this seasonal analysis
Seasonal pattern data is sourced from TradeWave.ai, which analyzes historical price behavior across annual calendar windows going back up to 30 years. Read the full data methodology or the book The 100-Year Pattern by Afshin Moshrefi (2026 edition). Past performance of seasonal patterns does not guarantee future results. This article is for informational purposes only and does not constitute investment advice.