Amphenol (APH) Has Risen in 8 of 8 Midterm August Windows, Averaging 14.79% Gains
Amphenol is heading toward a 233-day midterm-election-year seasonal window that has never been negative in this sample, even as shares trade well below their 52-week high.
Price as of Jul 21, 2026: $157.81 (last close).
What is the seasonal pattern for Amphenol (APH)?
Amphenol has risen in 8 of 8 midterm-election-year windows starting in mid-August, with an average gain of 14.79% in winning years.
- 8 for 8 in this window, with Amphenol averaging 14.79% gains across all winning years.
- The upcoming pattern starts on Aug 13, 2026 and runs for 233 trading days, covering the late midterm year into the pre-election year.
- Percent Profitable is 100%, with 8 winners and 0 losers in the historical sample.
- Average gains cluster in the mid-teens, but individual years have ranged from about 2.84% to 28.18%.
- Intraperiod swings have been meaningful, with some years showing double-digit drawdowns before finishing higher.
- The setup aligns with a broader industrial and communications hardware seasonal trend tied to election-cycle spending and data center demand.
According to historical data from TradeWave.ai, this mid-August window for Amphenol behaves differently from a typical year, especially in midterm-election cycles.
How has Amphenol (APH) traded in past midterm-year seasonal windows?
Amphenol has risen in all eight midterm-election-year windows that start around Aug 13 and run for roughly 233 trading days, posting an average gain of 14.79% for long positions. Shares finished the latest session at 157.81, up 4.9% on the day and about 11.6% below the 52-week high of 178.52, leaving room above if the historical pattern repeats. This combination of a strong APH seasonal trend and a pullback from the highs is what has traders watching the upcoming window closely.
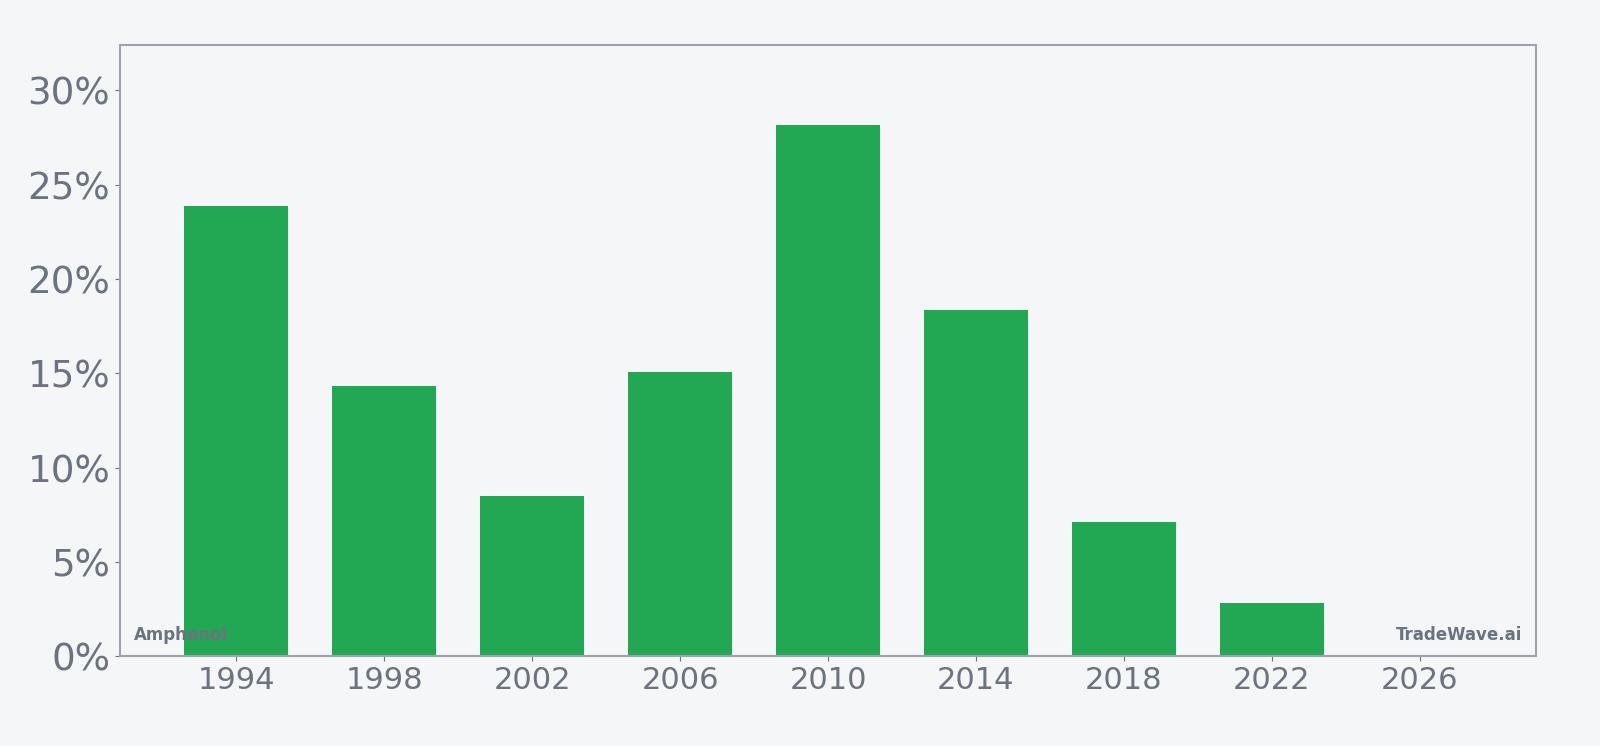
The presidential election cycle matters here because this APH seasonal pattern is built only from midterm-election years, a phase that often sees heavier policy debate, infrastructure talk and repositioning in industrial and communications hardware stocks. The current calendar is in the midterm election year, and this 233-day stretch runs from late in that year into the year before the presidential election, when risk appetite has often improved for cyclicals tied to data centers and broadband buildouts.
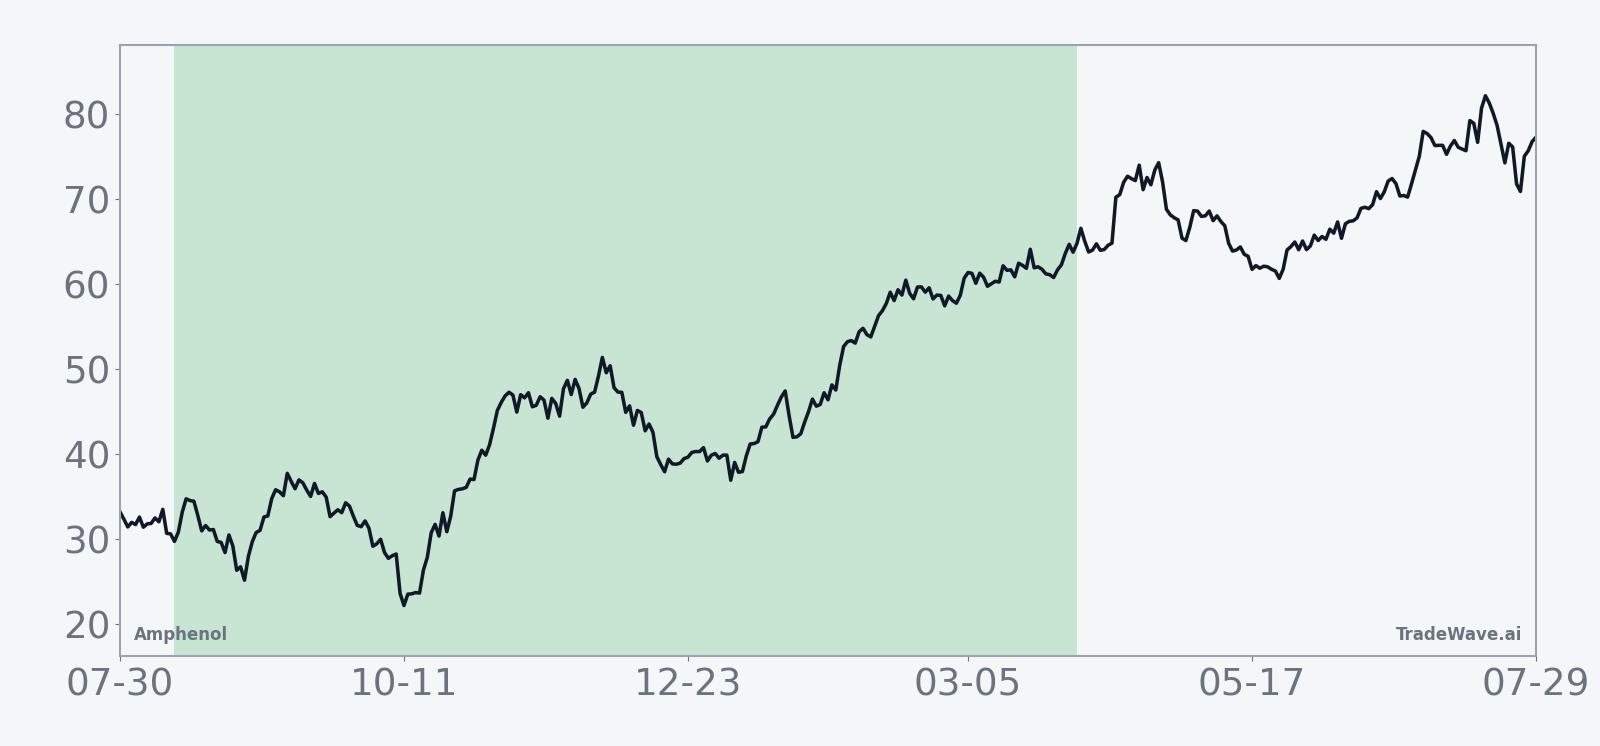
The historical seasonal average trend for this APH trading window slopes steadily higher, with much of the cumulative gain accruing in the middle third of the 233-day span. Early in the window, returns have tended to be choppier, while the later portion, as the calendar moves into the year before the presidential election, has historically seen more persistent upside. The cumulative return profile across all eight cycles adds up to a 195% gain, which is unusually strong for a single recurring window.
Year-by-year bars that include both peak run-ups and worst drawdowns show how Amphenol has historically moved inside this window.
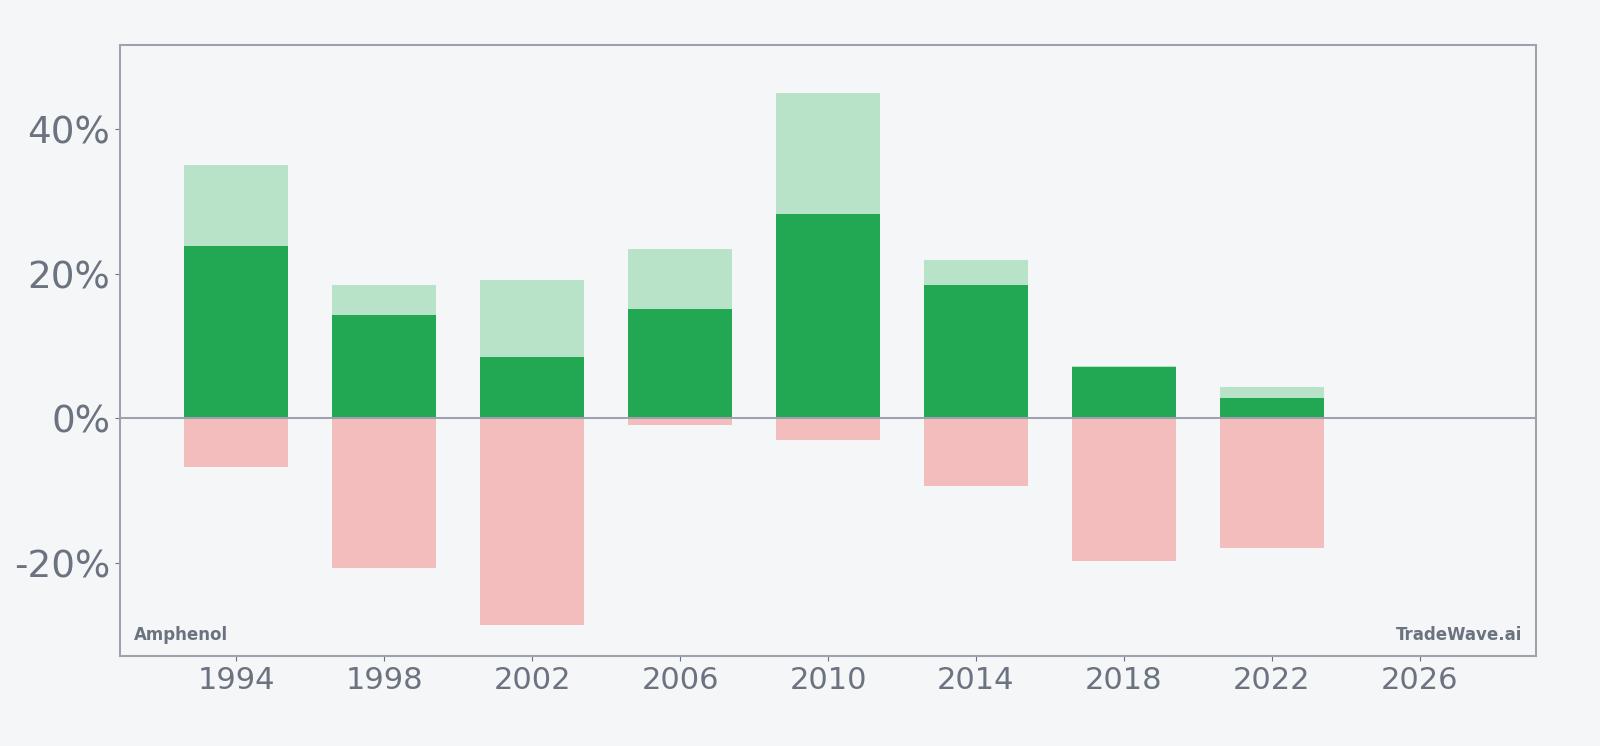
The per-year bars show that even the weaker cycles, such as 2022 with a 2.84% net gain, still finished positive but often after sizable swings, including adverse moves of up to about 28.59% in 2002. Maximum favorable excursions have reached as high as 44.86% in 2010, underscoring that when APH trends in this window, it can travel far in the trade direction before the period ends. Add it up: eight straight midterm-year windows have rewarded long exposure, but several did so only after investors sat through double-digit drawdowns.
History does not guarantee future results; adverse excursions can be large even in winning windows, and traders should size positions with that risk in mind.
Why does Amphenol (APH) follow this seasonal pattern?
One likely driver is the clustering of infrastructure and broadband spending decisions around midterm political calendars, which can pull forward orders for connectors, cables and data center hardware. Analysts have also pointed to institutional portfolio rebalancing into industrial and communications names as visibility improves on fiscal priorities heading into the year before the presidential election.[1] For Amphenol specifically, recurring M&A and data center build cycles may amplify that election-cycle rhythm, reinforcing the historical APH seasonal trend.
What is driving Amphenol (APH) today?
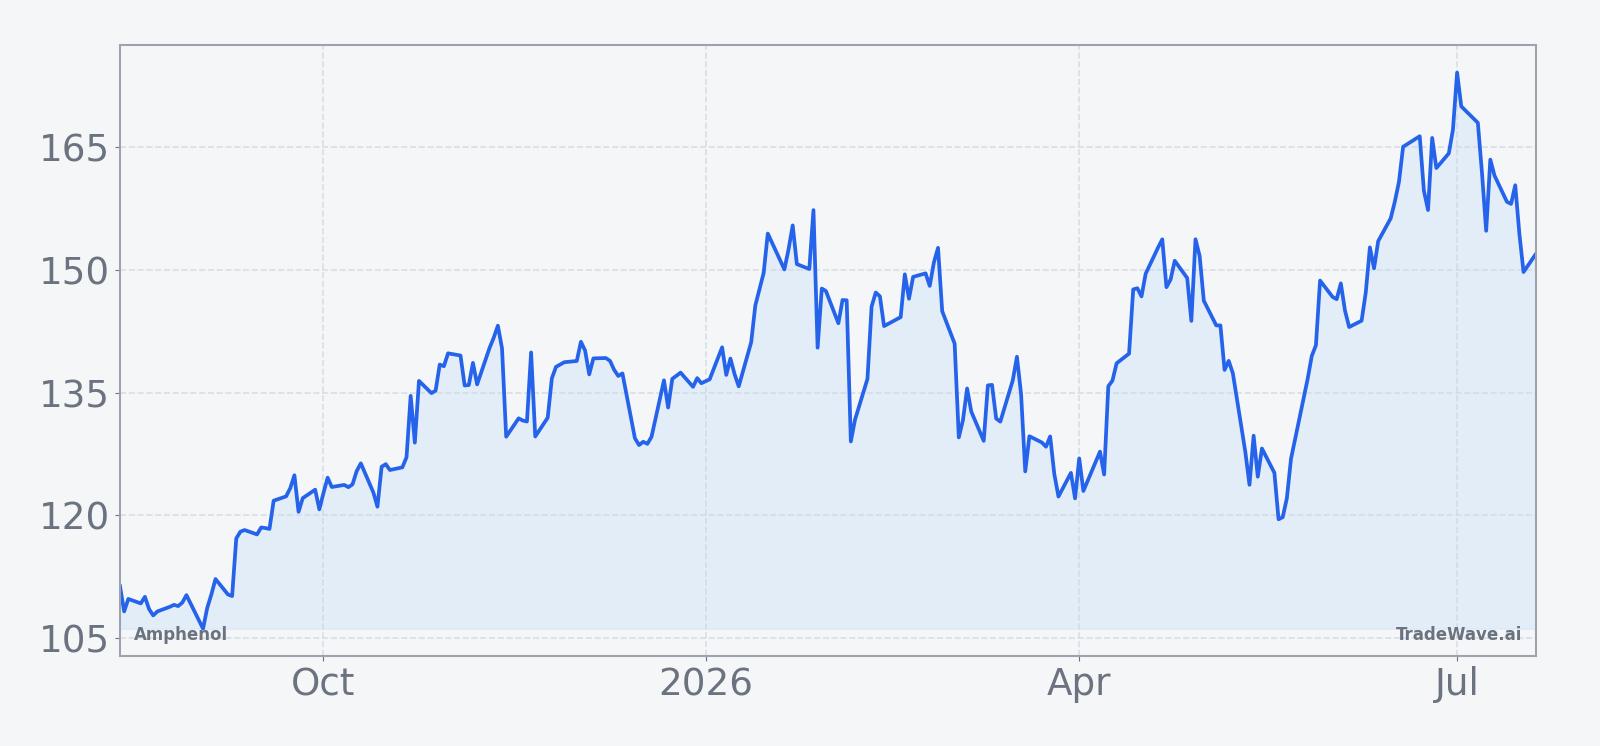
Amphenol closed the latest session at 157.81, up 7.30 points or 4.9% on the day, after trading between 152.87 and 158.08 on volume of about 6.5 million shares. The stock is roughly 11.6% below its 52-week high of 178.52 and well above its 52-week low near 93.91, with the 50-day moving average sitting around 148.58 and 20-day average volume near 7.5 million shares, suggesting the latest bounce comes from a position of intermediate-term strength rather than capitulation.
Fundamentally, the story remains tied to Amphenol’s role as a derivative play on artificial intelligence and high-speed connectivity. In October 2025, Bank of America upgraded the stock to Buy, citing expectations for sustained triple-digit AI revenue growth and higher content per rack in Nvidia-powered data centers, alongside a strong acquisition cadence that has broadened its exposure to broadband and defense interconnect markets.[1] Earlier in 2025, reports highlighted a potential $10.5 billion purchase of CommScope’s broadband connectivity and cable unit and a separate $1 billion deal for Trexon, moves that would deepen Amphenol’s footprint in fiber, cable and defense connectors if fully integrated.[2][3]
Sector-wise, Amphenol sits at the intersection of communications equipment and industrial electronics, supplying connectors, copper and fiber cables into data centers, broadband networks and defense systems.[2][3] That positioning has left the stock leveraged to AI infrastructure spending and to any policy-driven push on broadband and defense budgets as the midterm election year unfolds. For traders watching APH, the key question is how that macro and policy backdrop will intersect with the historically strong Amphenol trading window that begins in mid-August.
The chart below situates the latest move against the past year of trading and a short-term seasonal projection.
What should traders watch as this Amphenol seasonal window approaches?
First, the calendar: the next iteration of this 233-day APH seasonal window opens on Aug 13, 2026, so price behavior in the weeks leading up to that date will shape how much “fuel” is left if the historical pattern reasserts. A shallow consolidation above the 50-day moving average would keep the uptrend intact, while a deeper pullback toward the low 140s would test how much of the prior AI-driven rally investors are willing to give back.
Second, watch the policy and spending tape as the midterm election year progresses into its back half. Any concrete movement on broadband subsidies, data center power and permitting, or defense budgets could reinforce the communications and industrial sector seasonal outlook that has historically favored Amphenol in this phase.[2][3] Traders will also be watching upcoming earnings dates once scheduled, given the company’s long record of beating estimates and often rallying after results, which can act as catalysts inside this long seasonal regime.[4]
Finally, behavior inside the window will be the real test of the APH stock pattern analysis. If Amphenol again grinds higher with mid-teens gains and only moderate drawdowns, it would extend the 8-for-8 record and strengthen the case that this midterm-to-pre-election stretch is structurally favorable for the stock. A sharp break of prior support levels or an unusually deep intraperiod drawdown, by contrast, would signal that the historical Amphenol trading window is losing some of its edge in the current AI and policy environment.
Sources
- CNBC, "Bank of America just upgraded one of the hottest derivative AI plays in the market today" (Oct 15, 2025).
- Seeking Alpha (SA News), "Amphenol set to acquire CommScope unit in $10.5B deal - report" (Aug 4, 2025).
- The Wall Street Journal, "Amphenol to Buy Trexon From Audax Private Equity for $1 Billion" (Aug 18, 2025).
- CNBC, "These companies reporting next week have a history of posting beats and rallying" (Oct 16, 2025).
About this seasonal analysis
Seasonal pattern data is sourced from TradeWave.ai, which analyzes historical price behavior across annual calendar windows going back up to 30 years. Read the full data methodology or the book The 100-Year Pattern by Afshin Moshrefi (2026 edition). Past performance of seasonal patterns does not guarantee future results. This article is for informational purposes only and does not constitute investment advice.