6-of-7 Midterm Slide: Copart (CPRT) Short Trades Have Averaged 10% Profits in 47 Days
Copart is edging toward a historically weak 47-day midterm-election seasonal window just as shares trade near their 52-week low and the salvage cycle shifts.
Price as of Jul 21, 2026: $27.17 (last close).

What is the seasonal pattern for Copart (CPRT)?
Copart has fallen in 6 of 7 midterm-election-year windows starting around Aug 18, with an average 11.61% gain in winning years for the short side.
- 6-for-7 record for the short side in this window, with average winning trades of 11.61% and a 10% average across all years.
- The 47-day Copart trading window begins on Aug 18 and covers the last 7 midterm election years, a phase that often behaves differently from normal calendar seasonality.
- Percent Profitable is 86%, with 6 winners and 1 loser for the short direction across the historical sample.
- Avg Profit reflects only the profitable short years at 11.61%, while Avg Profit - All, which includes the lone losing year, comes in at 10%.
- Maximum adverse excursions have reached as deep as roughly 34% in some years, showing that even successful short windows can involve sharp rallies against the position.
- The pattern aligns with a midterm-election backdrop where policy uncertainty and sector rotation have often produced choppy, downside-biased stretches for Copart.
According to historical data from TradeWave.ai, this late-summer stretch for Copart has behaved very differently in midterm election years than in other parts of the cycle, and the next iteration is less than a month away.
How has Copart (CPRT) traded in this midterm-year window?
Copart has fallen in 6 of the last 7 midterm-election-year windows that start around Aug 18 and run for 47 trading days, making this one of the stock’s more consistent downside patterns. Today the shares closed at 27.17, down 1.2% on the session, leaving the stock essentially on top of its 52-week low at 27.19 and far below the 50.11 high from earlier in the year. That combination of a historically weak Copart trading window and a price already pinned near the bottom of its 12-month range gives this upcoming stretch unusual tactical importance for traders watching the stock’s seasonal trend.
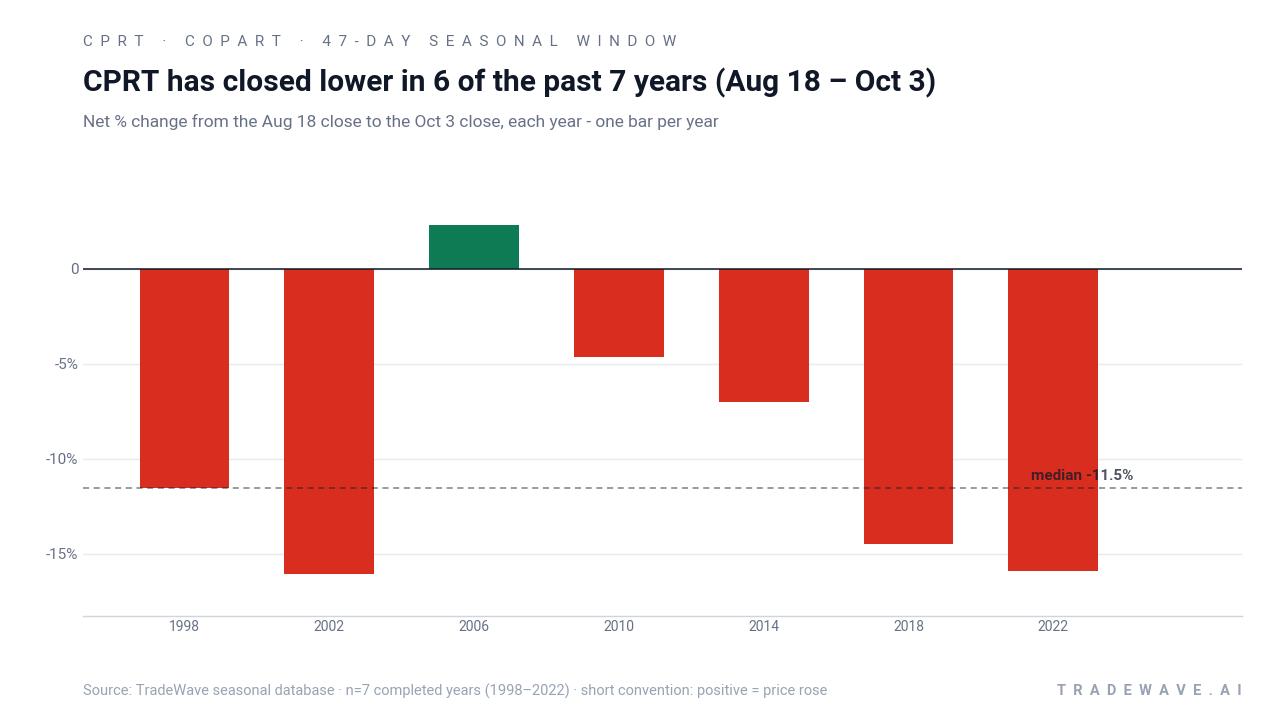
Grouping the data by the presidential election cycle matters here because this pattern only looks at the last 7 midterm election years, a phase when policy uncertainty, regulatory noise and shifting fiscal priorities have often produced different behavior in economically sensitive stocks than in the year before or after an election. In this Copart trading window, the trade direction is explicitly short, so years where the stock declined are counted as winners for the pattern, while rallies are losing years for that short setup.
Across those seven midterm-year windows, the short side has been profitable 86% of the time, with 6 winners and just 1 loser. Average profit in the winning years is 11.61%, while the average across all years, including the one losing stretch, is still a solid 10%. The median outcome is close to the mean at 11.54%, which suggests the distribution of returns has not been dominated by a single outlier year.
The per-year table shows that 2002, 2018 and 2022 stand out as some of the strongest short windows, with net returns of -16.05%, -14.46% and -15.92% respectively, meaning the stock dropped sharply during those periods. The lone losing year for the short pattern was 2006, when Copart rose 2.27% over the window, modestly squeezing anyone leaning into the seasonal short. Even in that year, the maximum adverse move against the short was limited to about 3.98%, which is relatively contained compared with the deeper drawdowns seen in other cycles.
Intraperiod swings have been meaningful. In 1998 and 2002, the worst drawdowns from entry, or maximum adverse excursions, reached roughly 34.62% and 32.1% respectively, showing that even ultimately successful short windows have involved sharp rallies against the position. Maximum favorable excursions, the best point-to-peak moves in the trade direction, have also been sizable, with years like 2002 and 2018 seeing double-digit downside runs before any rebound.
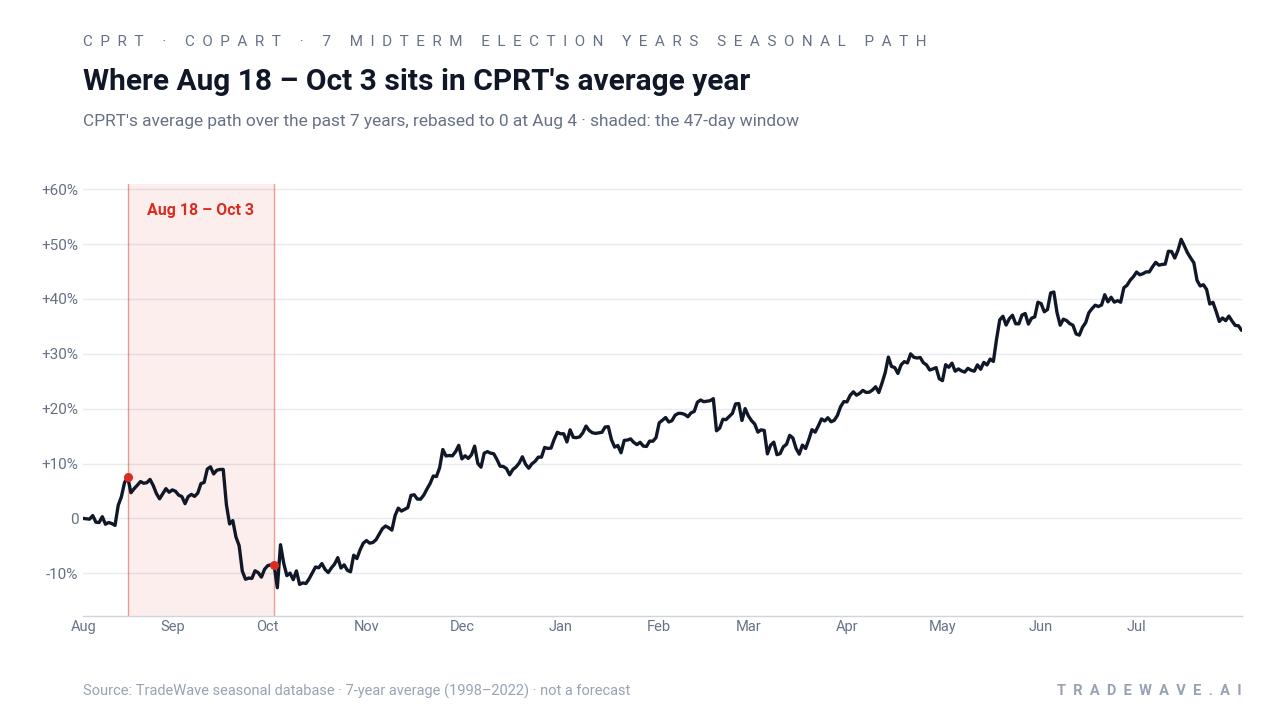
The historical seasonal trend line for this Copart trading window slopes lower for most of the 47 days, with the bulk of the downside typically accruing in the middle of the period rather than in a single sharp break. That profile suggests a tendency toward grinding weakness rather than a one-day shock, although individual years like 2022 have still seen brisk drops.
The yearly bar chart with maximum favorable and adverse moves shows how often downside has persisted even after sharp countertrend rallies.
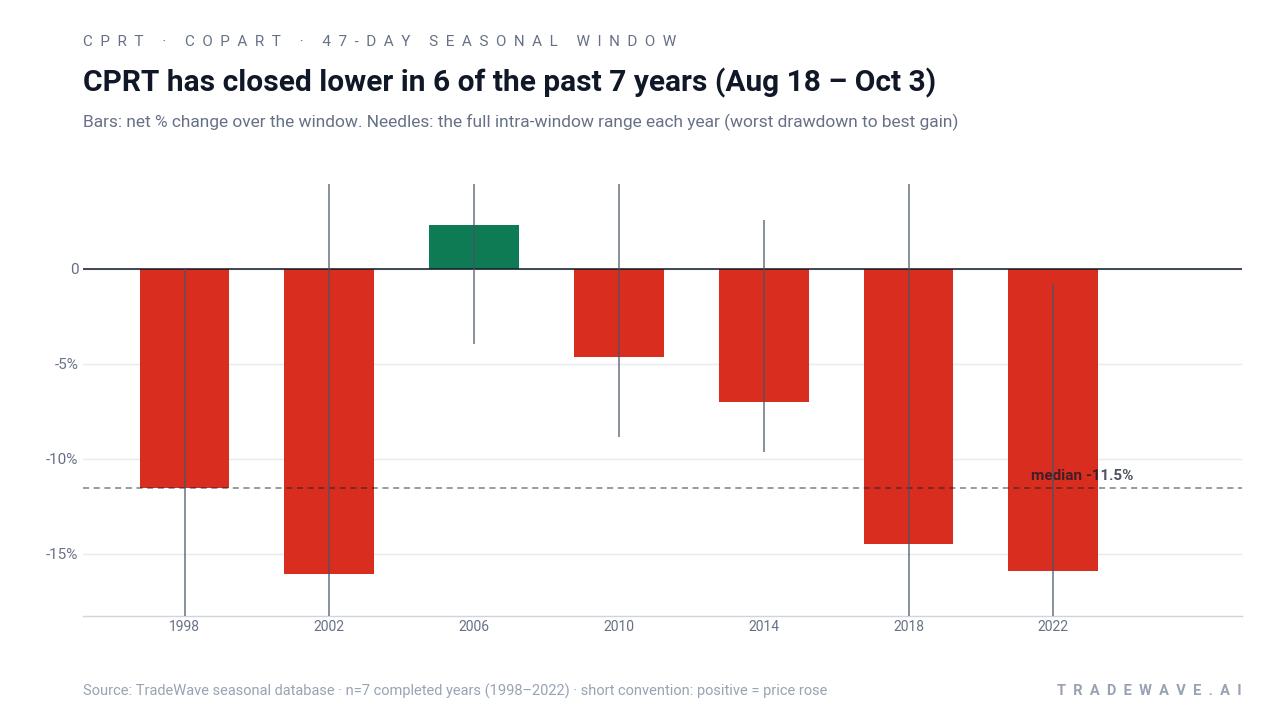
The stacked net, maximum favorable and maximum adverse bars make clear that this Copart seasonal pattern has combined meaningful downside potential with sizable intraperiod rallies, a mix that can reward well-timed shorts but punish late entries. History does not guarantee future results; adverse excursions can be large even in winning windows, so traders using this seasonal pattern need to respect the risk of sharp squeezes.
Why does Copart (CPRT) follow this seasonal pattern?
This midterm-year Copart seasonal pattern may reflect a mix of policy and industry timing. One likely driver is that midterm election years often bring regulatory and fiscal uncertainty that can affect insurers’ underwriting behavior and total loss decisions, which in turn influence salvage volumes and pricing for Copart. Analysts have also pointed to sector rotation around this phase of the cycle, as investors rebalance exposure to economically sensitive names like automotive salvage ahead of the historically stronger year before the presidential election.
What is driving Copart (CPRT) today?
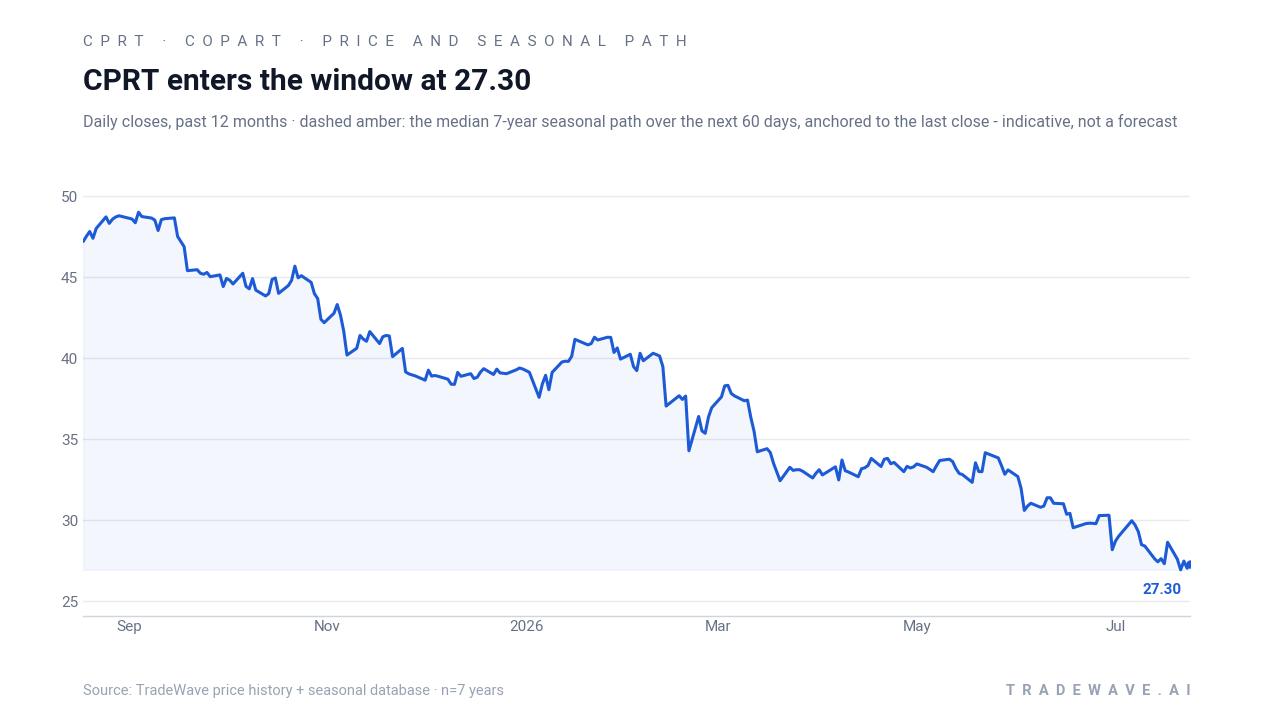
Copart closed Wednesday at 27.17, down 0.32 on the day, a 1.2% decline that leaves the stock roughly 45.8% below its 52-week high of 50.11 and essentially flat with its 27.19 low. Year to date the shares are up only 1.7%, lagging the broader market and trading well under their 50-day moving average of 30.75, a sign that the near-term trend has turned lower. Average 20-day volume sits around 13.2 million shares, so today’s roughly 11.1 million turnover was slightly below that pace, suggesting the latest slide came without a major volume spike.
Fundamentally, Copart remains tied to the health of the auto insurance and salvage ecosystem. In the first nine months of 2025, total loss frequency rose to 22.6%, which increased the flow of salvage vehicles into Copart’s online auctions and supported revenue and margin resilience even as broader auto markets cooled.[1] At the same time, Q1 fiscal 2026 revenue grew just 0.7%, as fewer catastrophic weather events and some pullback from consumer insurers tempered top-line momentum, even though average selling prices for salvage vehicles climbed 8% year over year and gross and net margins stayed robust at 47.62% and 34.24% respectively.[1]
Operationally, Copart’s VB3 online platform has been a quiet margin engine, driving efficiency gains that help offset softer volume growth and keep profitability high.[1] That leaves the stock in an interesting spot heading into the late-summer Copart trading window: the business remains structurally strong, but the shares are already depressed, and the historical seasonality for midterm election years has favored the short side. If the pattern repeats, traders will be watching whether a weak macro or insurance backdrop amplifies the seasonal bias or whether resilient fundamentals blunt it.
The chart below situates the latest move against Copart’s past year of trading and a 60-day seasonal projection overlay.
What should traders watch as this Copart seasonal window approaches?
With the next 47-day midterm-year window set to begin on Aug 18, the first watchpoint is whether Copart can hold the 27 area that has defined its 52-week low or whether the stock breaks decisively below that support as the seasonal pattern kicks in. A second focus is the behavior of total loss frequency and salvage volumes in upcoming insurance data and management commentary, since any acceleration in write-offs could bolster Copart’s fundamentals even if the seasonal pattern leans bearish.[1] Third, traders should monitor how the stock trades relative to its 50-day moving average: sustained failure to reclaim that line during the window would be consistent with prior downside-biased cycles, while a strong move back above it would contradict the historical pattern and signal that this midterm year may be different.
Finally, intraperiod volatility deserves close attention. Past midterm-year windows have seen maximum adverse excursions of more than 30% against the short side in some years, so sharp countertrend rallies are part of the historical playbook. If Copart starts the window with a fast squeeze higher that then fades into renewed weakness, that would echo several prior cycles; if instead the stock grinds higher throughout the period, it would mark only the second clear losing year for this short-focused seasonal setup.
Sources
About this seasonal analysis
Seasonal pattern data is sourced from TradeWave.ai, which analyzes historical price behavior across annual calendar windows going back up to 30 years. Read the full data methodology or the book The 100-Year Pattern by Afshin Moshrefi (2026 edition). Past performance of seasonal patterns does not guarantee future results. This article is for informational purposes only and does not constitute investment advice.