Tractor Supply (TSCO) Has Risen in 7 of 7 Midterm Fall Windows, Averaging 17.93% Gains
Tractor Supply is trading near the lower end of its 52-week range just as a historically strong midterm-year seasonal window opens, raising the stakes for how the stock trades into late fall.
Price as of Jul 28, 2026: $31.46 (last close).

What is the seasonal pattern for Tractor Supply (TSCO)?
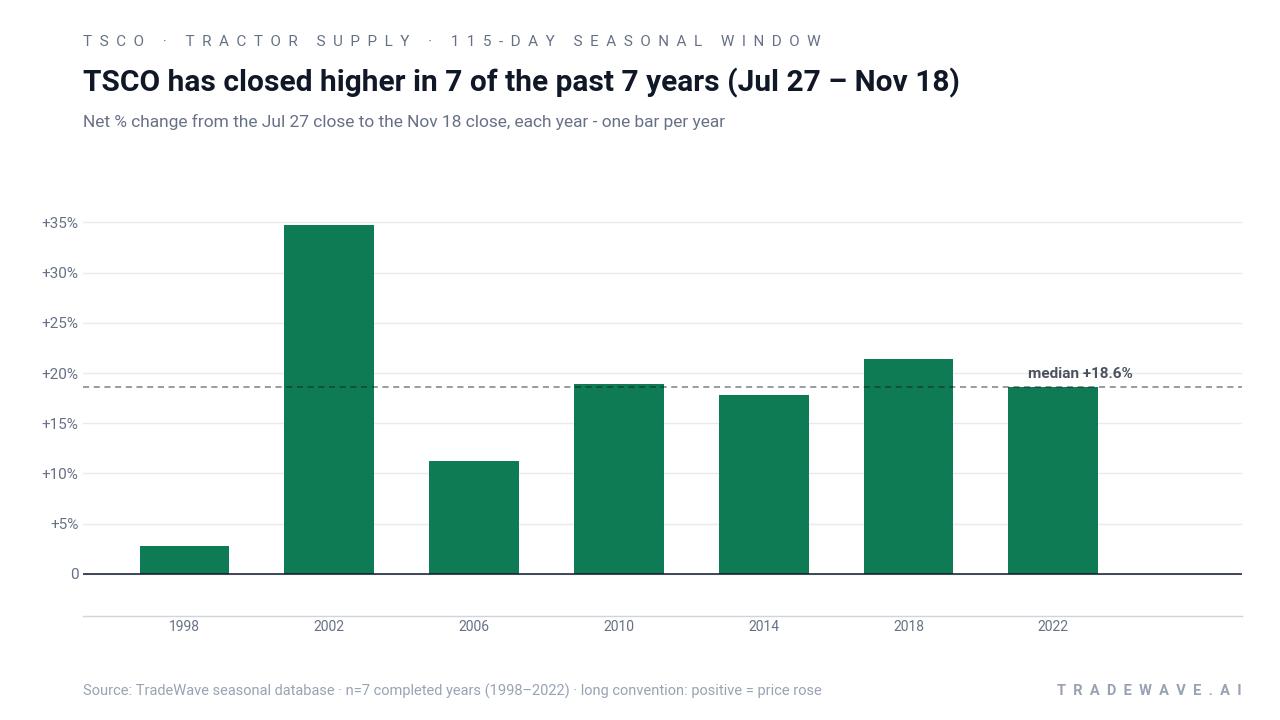
Tractor Supply has risen in 7 of 7 midterm-year Jul 27 to Nov 18 windows, with an average gain of 17.93% in winning years.
- 7 for 7 in this window, with Tractor Supply averaging 17.93% gains across all winning years.
- The seasonal window runs 115 days from Jul 27 to Nov 18 in the last 7 midterm election years.
- Percent Profitable is 100%, with 7 winners and 0 losers in the historical sample.
- Average gains cluster in the mid-teens to low-20s, with a median profit of 18.65% and cumulative return of 210% when stacking the window.
- Intraperiod swings have been meaningful, with some years seeing double-digit drawdowns before finishing higher.
- The pattern is aligned with a long trade direction and a Sharpe ratio of 1.71, indicating historically strong risk-adjusted returns for this specific window.
According to historical data from TradeWave.ai, this midterm-year stretch has behaved very differently from an average quarter for Tractor Supply. The next section walks through how that pattern has played out and where the current window fits in the broader election cycle.
How has Tractor Supply (TSCO) traded in this midterm-year fall window?
Tractor Supply has closed higher in every single Jul 27 to Nov 18 window across the last 7 midterm election years, averaging a 17.93% gain with a long bias. Shares finished the prior session at 31.46, down 1.1% on the day and sitting well below a 52-week high of 62.34, with the current seasonal window already underway from Jul 27. This combination of a strong historical seasonal trend and a stock trading closer to its 52-week low than its high gives this year’s setup a very different starting point than many past cycles.
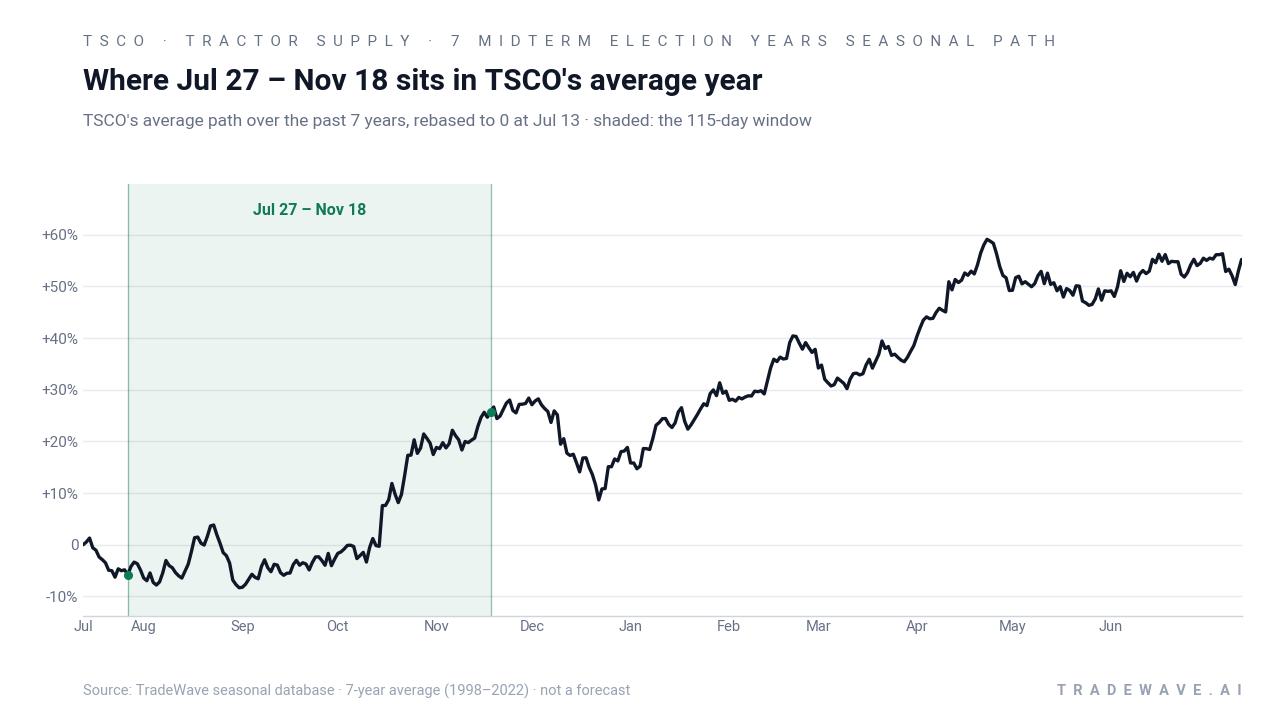
The presidential election cycle matters here because this pattern only looks at midterm election years, which often feature policy uncertainty, shifting fiscal priorities and sector rotation ahead of the stronger pre-election year. Tractor Supply’s historical seasonality in this slice of the calendar is therefore tied not just to the weather and farm calendar, but also to how investors have repositioned around mid-cycle policy risk.
Across the seven midterm-year samples from 1998 through 2022, every Jul 27 to Nov 18 window finished positive, with individual year gains ranging from 2.76% to 34.71%. The strongest year in this pattern was 2002, when Tractor Supply rallied 34.71% over the window, while 1998 was the softest at 2.76%, still a win for a long setup. Average profit of 17.93% and a median of 18.65% show that the typical outcome has been a mid-teens advance rather than a single outlier skewing the numbers.
The intraperiod path has not been smooth. In 1998, the stock suffered a worst drawdown of 29.47% from the entry level before recovering to finish higher, while 2006 and 2014 also saw double-digit adverse moves of 13.14% and 11.56% respectively. On the other side, maximum favorable excursions have often pushed into the high teens or 20s, with 2018 reaching a best gain of 28.51% and 2002 peaking at 36.48% within the window. That mix of sizable run-ups and occasional deep dips is consistent with a TradeWave Ratio of 2.15, which signals that price has typically traveled meaningfully in the trade direction during the window.
A second view shows how each year’s net result sits inside its full intraperiod range of rallies and drawdowns.
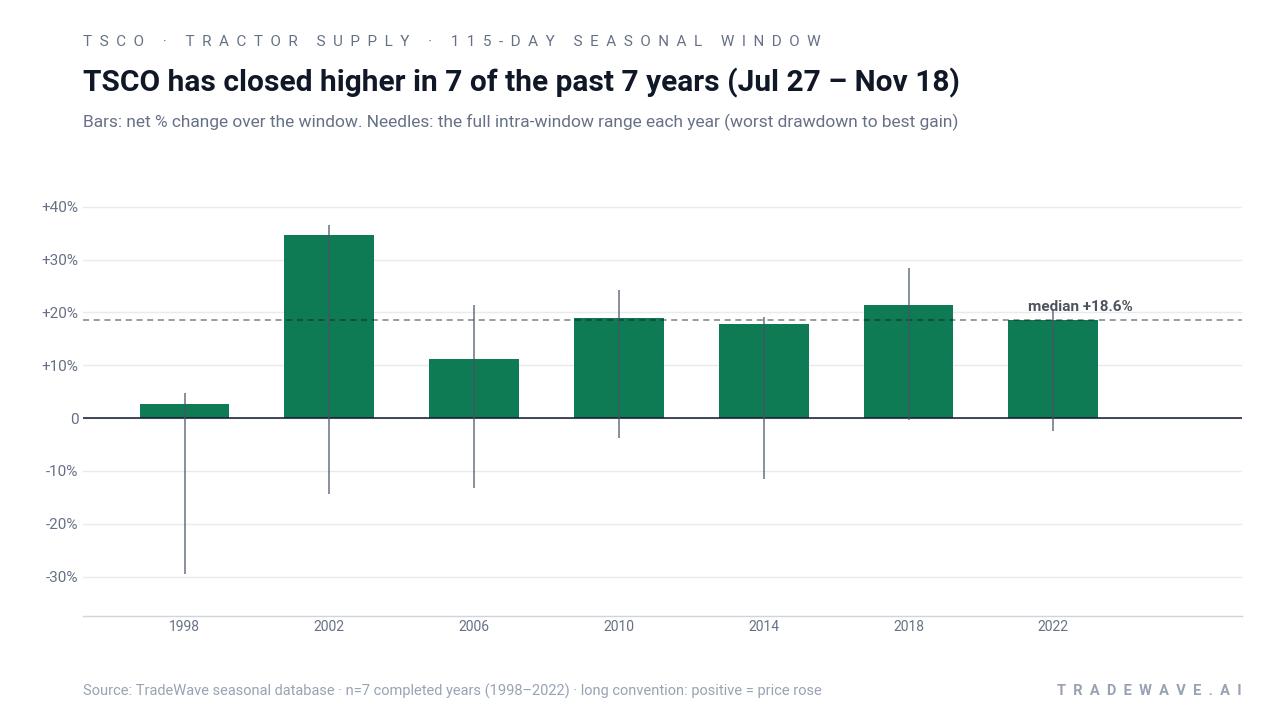
The bars-and-range view underlines how even a perfect 7-for-7 record has come with real volatility. In several years, the worst drawdown arrived early in the window before a stronger second-half recovery, while in others the stock pushed higher quickly and then consolidated. The Sharpe ratio of 1.71 reflects that, on an end-of-window basis, returns have been strong relative to volatility, but the MAE and MFE profile shows that traders have had to sit through sizable swings to capture those gains.
History does not guarantee future results; adverse excursions (MAE) can be large even in winning windows.
Why does Tractor Supply (TSCO) follow this seasonal pattern?
One likely driver is the alignment of this window with Tractor Supply’s core selling season, when late-summer and fall demand for farm, pet and outdoor products tends to be strongest. Analysts have also pointed to portfolio repositioning around midterm election years, as investors lean into economically sensitive retailers ahead of the historically stronger pre-election year. The pattern may further reflect how earnings updates and holiday-season expectations cluster in this stretch, concentrating both optimism and volatility into the same 115-day window.
What is driving Tractor Supply (TSCO) today?
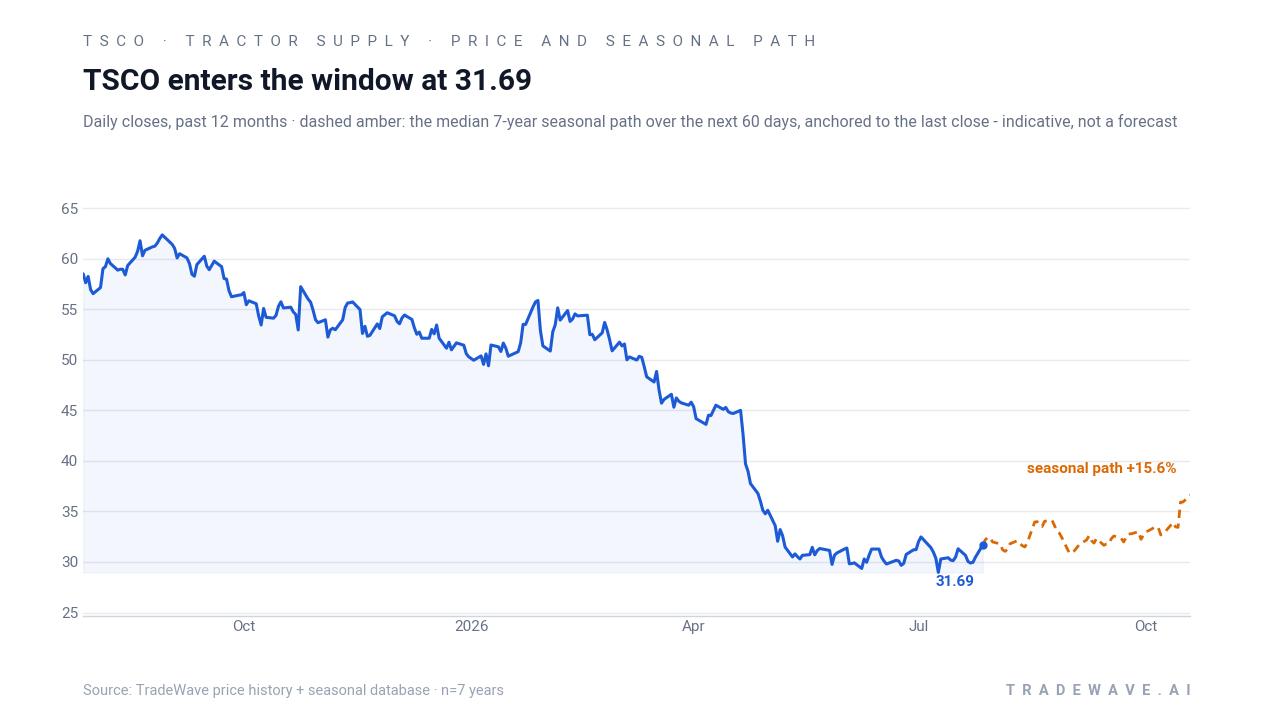
Tractor Supply closed the prior session at 31.46, down 1.1% on the day, after trading between 31.43 and 32.40 on volume of about 9.7 million shares. That leaves the stock only modestly above its 52-week low of 28.36 and far below a 52-week high of 62.34, even as it enters a seasonal stretch that has historically been one of its strongest. The 20-day average volume sits near 10.1 million shares, so liquidity remains solid as traders weigh how much of the midterm-year seasonal trend is already priced in.
In Aug 2025, Tractor Supply outlined plans to expand its in-house last-mile delivery for big and bulky goods, aiming to improve efficiency and support growth in online and direct sales.[1] The company has targeted digital sales of roughly 10% to 12% of total revenue by 2029, up from about 8% in 2025, aligning with a broader retail sector push toward e-commerce and omnichannel fulfillment.[1] While those disclosures came in a different market environment, they frame today’s setup: a stock that has been repriced lower, a business model leaning harder into logistics and digital, and a calendar window that has historically rewarded long exposure.
The chart below situates the latest move against the past year of trading and the median seasonal path over the next 60 days.
What should traders watch in this Tractor Supply (TSCO) seasonal window?
First, price behavior relative to the 52-week range will matter. A sustained move away from the 28 to 32 area during the heart of the Jul 27 to Nov 18 window would be more consistent with the historical pattern than another leg lower from already depressed levels. Traders will be watching whether any upcoming earnings or sales updates reinforce the story of growing digital and delivery capabilities that Tractor Supply highlighted in 2025, or whether execution risk around rural logistics and last-mile costs resurfaces instead.[1]
Second, intraperiod volatility will be a key tell. In prior midterm years, some of the best eventual gains came after sharp early drawdowns, so how the stock trades on pullbacks inside this window will help confirm or challenge the historical script. Finally, the broader policy and macro backdrop into the midterm election year will shape whether investors are willing to lean into economically sensitive retail names; if risk appetite fades, even a strong historical seasonal trend can be overwhelmed. Add it up, and this 115-day stretch is a clean test of whether Tractor Supply’s midterm-year seasonal edge can reassert itself from a much lower starting point.
Sources
About this seasonal analysis
Seasonal pattern data is sourced from TradeWave.ai, which analyzes historical price behavior across annual calendar windows going back up to 30 years. Read the full data methodology or the book The 100-Year Pattern by Afshin Moshrefi (2026 edition). Past performance of seasonal patterns does not guarantee future results. This article is for informational purposes only and does not constitute investment advice.