10-for-10 Midterm Streak: Johnson & Johnson (JNJ) Nears 125-Day Fall Rally Window
Johnson & Johnson is pushing higher after strong Q2 results and a dividend hike as it heads toward a midterm-year seasonal window that has never produced a losing run in the past decade of comparable cycles.
Price as of Jul 23, 2026: $259.27 (last close).

What is the seasonal pattern for Johnson & Johnson (JNJ)?
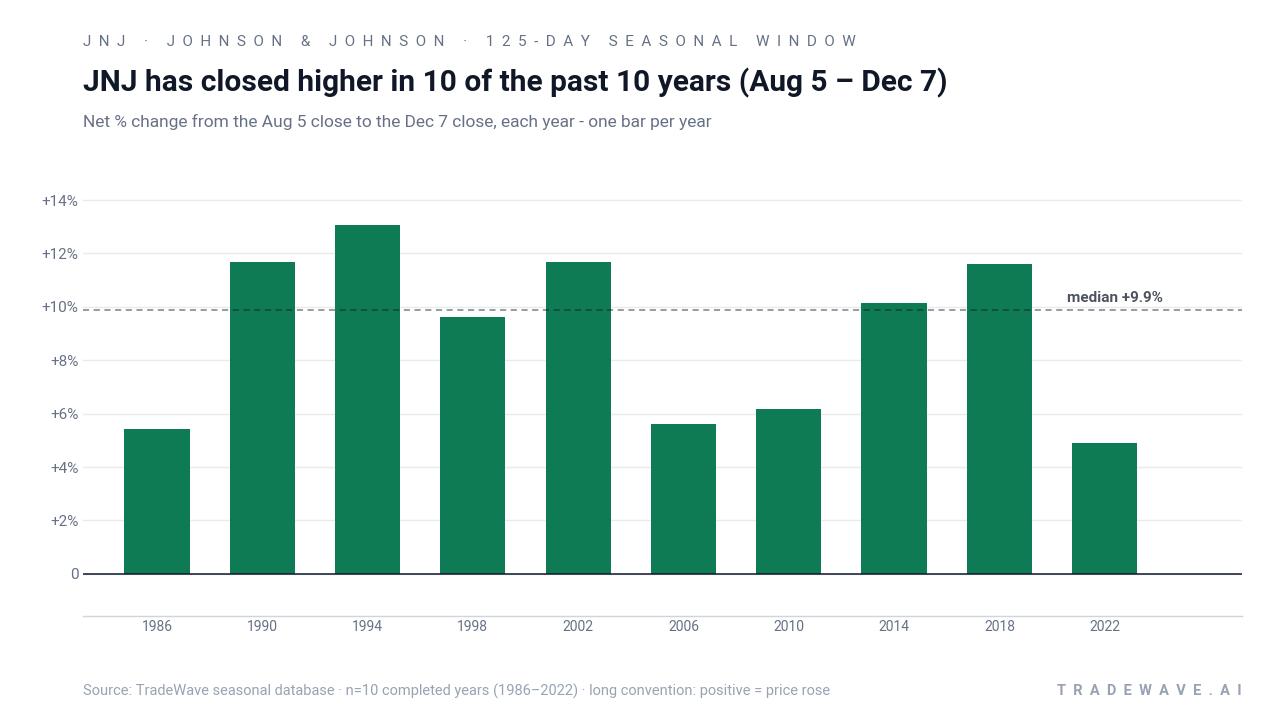
Johnson & Johnson has risen in 10 of 10 midterm-year Aug 5–Dec 7 windows, with an average gain of 8.99% in winning years.
- 10 for 10 in this window, with Johnson & Johnson averaging 8.99% gains in winning years across the last 10 midterm election cycles.
- Percent Profitable is 100%, with 10 winners and 0 losers in the Aug 5–Dec 7 midterm-year window.
- All-years median profit is 9.88%, and cumulative return from stacking the window across cycles reaches 135%.
- The TradeWave Ratio of 2.35 signals that price has typically traveled meaningfully in the long direction within the window, not just at the close.
- Intraperiod swings have included double-digit drawdowns in some years, so even a historically strong JNJ seasonal trend has carried real downside volatility.
- This 125-day Johnson & Johnson trading window sits in the midterm election year and runs into the pre-election year, a phase that has often coincided with stronger healthcare sector seasonal outlooks.
According to historical data from TradeWave.ai, this midterm-year stretch for Johnson & Johnson behaves very differently from an average autumn on the calendar, and the next iteration is less than two weeks away.
How has Johnson & Johnson (JNJ) traded in the Aug 5–Dec 7 midterm-year window?
Johnson & Johnson has finished higher in every single Aug 5–Dec 7 midterm-year window across the last 10 cycles, averaging 8.99% gains for long positions. The stock heads toward the 2026 version of that window at $259.27, up 1.4% on the day and 20.86% year to date, after a strong run that leaves it about 3.8% below its 52-week high of $269.43.
The window itself begins on Aug 5 and runs 125 calendar days into early December, straddling the back half of the midterm election year and the doorstep of the year before the presidential election. Grouping by this presidential cycle matters because policy noise, fiscal stance and sector rotation often cluster by phase, and healthcare has historically seen steadier flows as Washington shifts from midterm gridlock toward pre-election positioning.
Across the 10 completed midterm-year windows since 1986, every single one has been profitable for a long JNJ stance, with net returns ranging from 4.91% in 2022 to 13.05% in 1994. Average gains of 8.99% and a median profit of 9.88% point to a fairly tight upside band rather than a pattern driven by one or two outlier years. Add it up: compounding those slices of the calendar produces a 135% cumulative gain across the sample.
The per-year profile shows that even the “softest” years still delivered mid-single-digit gains by the end of the window. In 1986, for example, JNJ finished the stretch up 5.44%, while 2014 and 2018 both landed around 10% net returns despite different macro backdrops. That consistency is unusual for a single-stock seasonal pattern and stands out even within the defensive healthcare space.
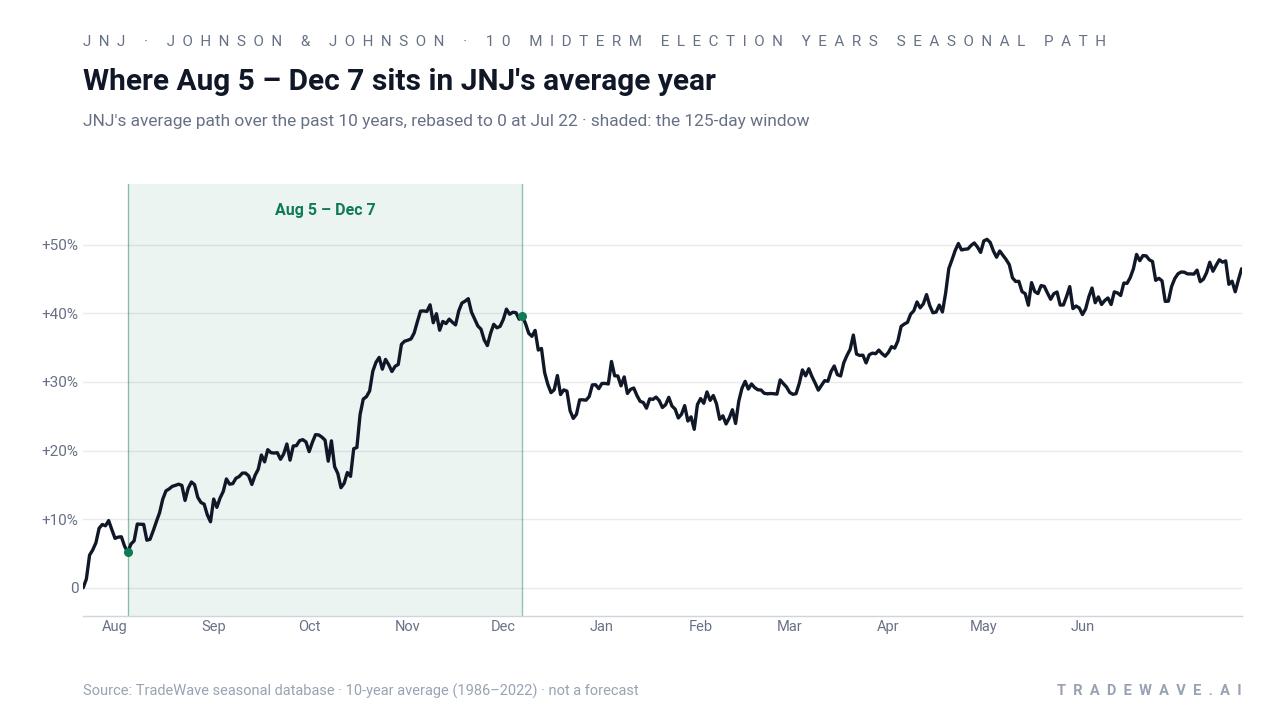
The historical seasonal average path suggests that JNJ’s typical midterm-year pattern is a steady climb rather than a front-loaded surge. Returns tend to accrue across the full 125 days, which fits a story of institutional buying and portfolio rebalancing rather than a single binary catalyst. For traders, that means the window has historically rewarded patience more than quick-hit timing.
Year-by-year ranges show how much JNJ has swung inside the window before finishing higher.
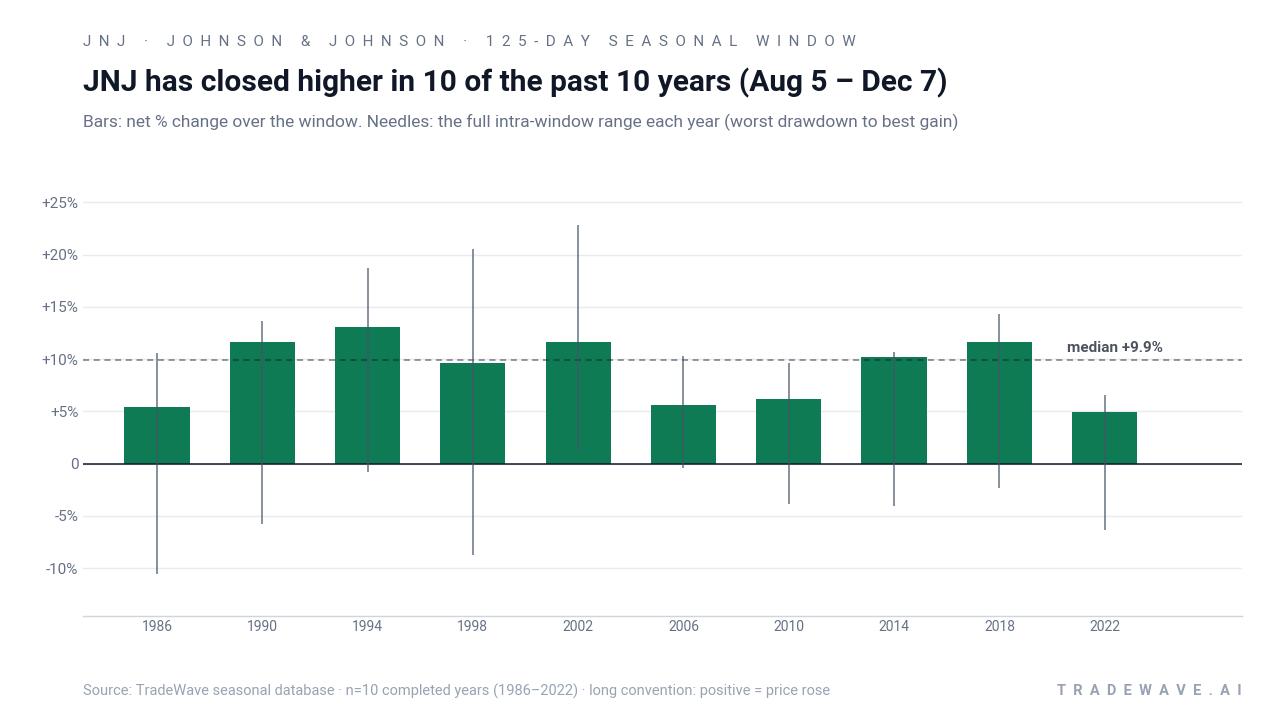
The bar-and-needle view of each year’s window underlines that this has not been a free ride. In 1986, JNJ ultimately gained 5.44%, but the stock first saw a worst drawdown of about 10.55% from the entry before recovering. In 1998, the best intraperiod rally reached roughly 20.52%, yet the same window included an 8.79% adverse move at one point. Even in 2022, when the net gain was a modest 4.91%, the stock swung between a 6.35% drawdown and a 6.59% peak run-up inside the window.
History does not guarantee future results; adverse excursions can be large even in winning windows, and traders should treat the pattern as context rather than a signal on its own.
Why does Johnson & Johnson (JNJ) follow this seasonal pattern?
One likely driver is the way the healthcare earnings calendar and guidance updates cluster in the back half of midterm election years, when investors have more clarity on policy risk and reimbursement trends. Analysts have also pointed to institutional portfolio repositioning into defensive names like JNJ as the market transitions from midterm uncertainty toward the historically stronger year before the presidential election. This pattern may also reflect steady dividend reinvestment and sector rotation into large-cap pharmaceuticals and MedTech as year-end approaches.
What is driving Johnson & Johnson (JNJ) today?
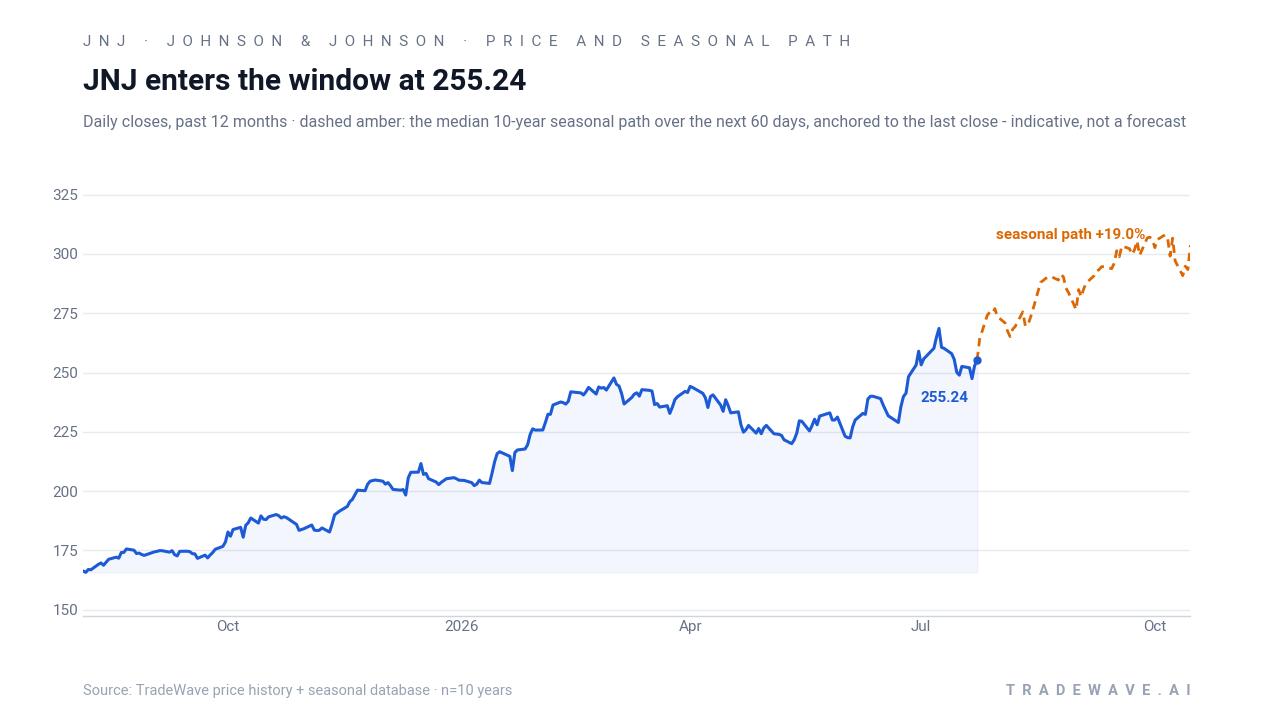
Johnson & Johnson shares closed at $259.27 on Jul 24, up 1.4% on the session and extending a run that has lifted the stock 20.86% so far in 2026, leaving it within sight of its 52-week high at $269.43. The move caps a strong July in which JNJ beat second-quarter estimates, posting 4.7% earnings growth and 6.6% sales growth year over year while raising full-year sales guidance to a range of $100.8 billion to $101.4 billion.[3]
The company has also leaned into its income story, declaring a Q3 2026 cash dividend of $1.34 per share and extending a long record of annual payout increases.[2] That dividend support, combined with a solid balance sheet and a diversified mix of pharmaceuticals and MedTech, has kept JNJ in the conversation as a core defensive holding even as growth stocks have dominated headlines.[1]
On the product side, JNJ’s MedTech arm has been a key narrative driver. The company secured FDA approval for its dual energy THERMOCOOL SMARTTOUCH SF ablation platform and moved quickly to roll out the system with select U.S. hospital partners, with launches planned across Western Europe and Japan.[2][6] The push into robotic and ablation platforms has already rattled competitors in surgical robotics, underscoring that JNJ is willing to invest aggressively to defend and grow share in higher-margin procedure categories.[6]
Options and flow data show that not all investors are simply riding the uptrend. In mid-July, unusually heavy put option activity appeared in JNJ, including large volume at the $252.50 strike ahead of the Jul 15 earnings release, a sign that some traders were hedging or positioning for a pullback after the run-up.[8] Around the same time, filings showed Bogart Wealth LLC trimming its JNJ stake, and an insider sale by EVP Kathryn E. Wengel on Jun 11 at an average price of $241.15 added to the sense that some holders were taking profits into strength.[9][10]
Sector context has been supportive. Healthcare has benefited from a mix of steady demand and renewed M&A chatter, with JNJ’s oncology portfolio and MedTech launches drawing favorable comparisons to peers that are more reliant on big-ticket acquisitions for growth.[4] Analysts covering the name have generally landed on a “Hold” consensus, reflecting a view that much of the near-term good news is in the price even as long-term fundamentals remain solid.[1][2]
The chart below situates the latest move in its recent multi-month context and overlays the median historical seasonal path for the coming weeks.
What should traders watch as the Aug 5 seasonal window approaches?
First, the calendar. The 125-day window opens on Aug 5, so price action in the final days of July and early August will set the entry level for this historically strong slice of the year. A pullback into the start date would echo several past cycles where JNJ dipped early in the window before grinding higher, while a continued melt-up would test how much upside is left after a 20.86% year-to-date gain.
Second, policy and macro headlines. As the midterm election year moves into its back half, investors will parse any shifts in healthcare regulation, drug pricing rhetoric and reimbursement policy that could alter the sector’s risk profile. Historically, this midterm-to-pre-election transition has coincided with steadier flows into large-cap healthcare, which has lined up with the bullish JNJ seasonal pattern in prior cycles.
Third, options and positioning. The unusual put activity around the $252.50 strike ahead of earnings showed that some traders were willing to pay up for downside protection into strength.[8] If that hedging pressure fades while call interest builds as the window opens, it would suggest that investors are leaning into the historical seasonality. If put volume stays elevated or grows, it would signal that concerns about valuation, litigation or macro risk are outweighing the pattern.
Finally, watch how JNJ behaves around key technical levels such as the recent high near $269 and the 50-day moving average, which currently sits well below spot. A pattern-consistent year would likely feature higher highs and higher lows across the window, with any sharp drawdowns resembling the historical MAE spikes that have so far resolved into higher closes. A break of that behavior, especially if paired with persistent hedging and insider selling, would be an early sign that this midterm-year playbook may be changing.
Sources
- Yahoo Finance (Zacks) – Johnson & Johnson (JNJ) is Attracting Investor Attention (Jul 23, 2026)
- Yahoo Finance (Simply Wall St) – Johnson & Johnson (JNJ) Raised Its Dividend, Where Does Fair Value Sit? (Jul 22, 2026)
- MarketBeat – Guggenheim Issues Positive Forecast for Johnson & Johnson (NYSE:JNJ) Stock Price (Jun 26, 2026)
- Yahoo Finance (24/7 Wall St.) – Johnson & Johnson vs Abbott Laboratories: Two Healthcare Giants on Opposite Trajectories (Jul 22, 2026)
- Barchart – Why Johnson & Johnson Is Sending Intuitive Surgical (ISRG) Stock Down Today (Jul 22, 2026)
- Yahoo Finance (Barchart content) – Unusual Put Option Activity in Johnson & Johnson After JNJ Stock's Recent Runup (Jul 10, 2026)
- MarketBeat – Bogart Wealth LLC Sells 8,462 Shares of Johnson & Johnson $JNJ (Jul 9, 2026)
- Yahoo Finance – Buy, Sell or Hold Johnson & Johnson’s Stock? (Q2 2026 earnings summary)
About this seasonal analysis
Seasonal pattern data is sourced from TradeWave.ai, which analyzes historical price behavior across annual calendar windows going back up to 30 years. Read the full data methodology or the book The 100-Year Pattern by Afshin Moshrefi (2026 edition). Past performance of seasonal patterns does not guarantee future results. This article is for informational purposes only and does not constitute investment advice.