Simpson Manufacturing Company (SSD) Has Risen in 7 of 7 Midterm Windows, Averaging 11.98% Gains
Simpson Manufacturing Company is entering a 263-day midterm-election-year seasonal window that has delivered gains in every prior cycle, even as the stock trades below its 52-week high.
Price as of Jul 27, 2026: $193.24 (last close).

What is the seasonal pattern for Simpson Manufacturing Company (SSD)?
Simpson Manufacturing Company has risen in 7 of 7 midterm-election-year windows starting Jul 28, with an average gain of 11.98% in winning years.
- 7 for 7 in this window, with Simpson Manufacturing Company averaging 11.98% gains across all winning years.
- Seasonal window runs 263 days from Jul 28 to Apr 16, grouped across the last 7 midterm election years.
- Percent Profitable is 100%, with 7 winners and 0 losers in the historical sample.
- Average winner gain of 11.98% comes alongside a TradeWave Ratio of 2.28 and a Sharpe ratio of 1.87, pointing to a strong long bias.
- Intraperiod swings have been wide, with some years seeing double-digit drawdowns before finishing higher.
- The pattern aligns with the midterm-to-pre-election transition, a phase that often favors industrial and construction names.
According to historical data from TradeWave.ai, this midterm-election-year stretch has behaved differently from an average calendar year for Simpson Manufacturing Company, and the next iteration begins today.
How has Simpson Manufacturing Company (SSD) traded in this midterm-year window?
Simpson Manufacturing Company has closed higher in 7 of the last 7 midterm-election-year windows that run from Jul 28 to Apr 16, averaging 11.98% gains for long positions. Shares finished the prior session at 193.24, leaving the stock about 9.2% below its 52-week high and roughly 24.9% above its 52-week low, a mid-range starting point for this latest seasonal regime.
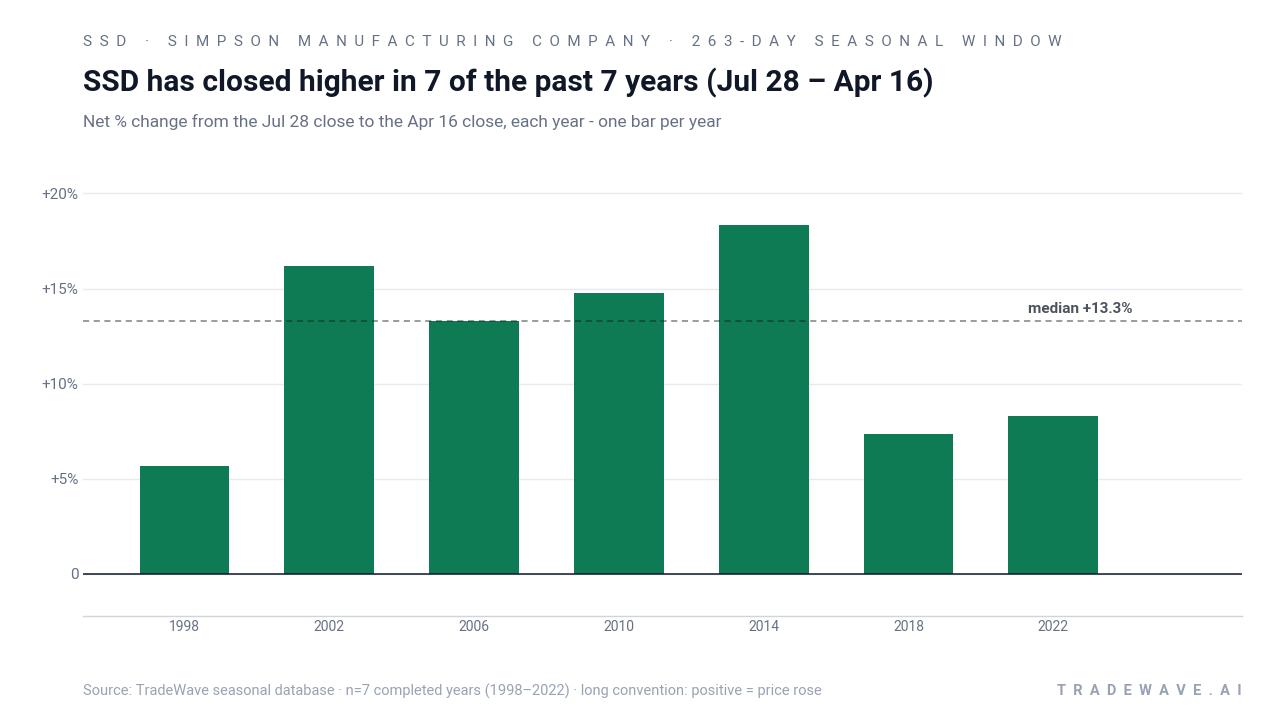
The presidential election cycle matters here because this 263-day slice always starts in a midterm election year and runs into the year before the presidential election, a phase that has often coincided with easier financial conditions and stronger risk appetite for industrial and construction stocks. Grouping only those midterm-year instances filters out noise from other parts of the cycle and shows how SSD has behaved when policy uncertainty is fading and infrastructure and housing spending tend to re-accelerate.
The trade direction for this pattern is explicitly long. Across the seven midterm-election-year samples since 1998, every iteration finished positive, with net returns ranging from 5.66% in 1998 to 18.32% in 2014. The median outcome sits at 13.28%, which lines up closely with the average, suggesting that the wins have been relatively clustered rather than driven by a single outlier year.
Intraperiod swings have been meaningful. In 2010, for example, the best point-to-peak move within the window reached 32.21%, while the worst drawdown from entry was 11.79%. In 2018, the stock ultimately gained 7.33% over the window, but not before a maximum adverse move of 17.18% and a maximum favorable move of 30.6%. The 1998 sample shows how volatile this construction-linked name can be, with a modest 5.66% net gain masking a 36.48% worst drawdown at one point in the window.
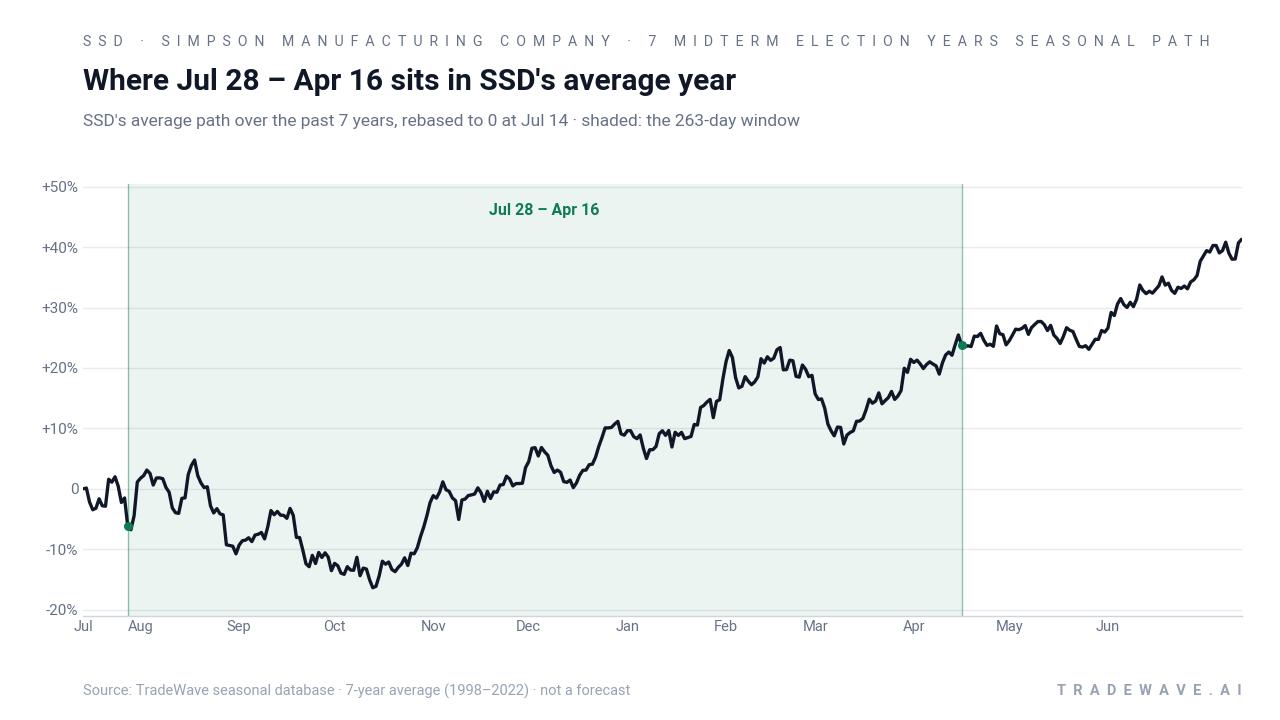
Yearly net and peak moves highlight upside persistence amid typical drawdowns.
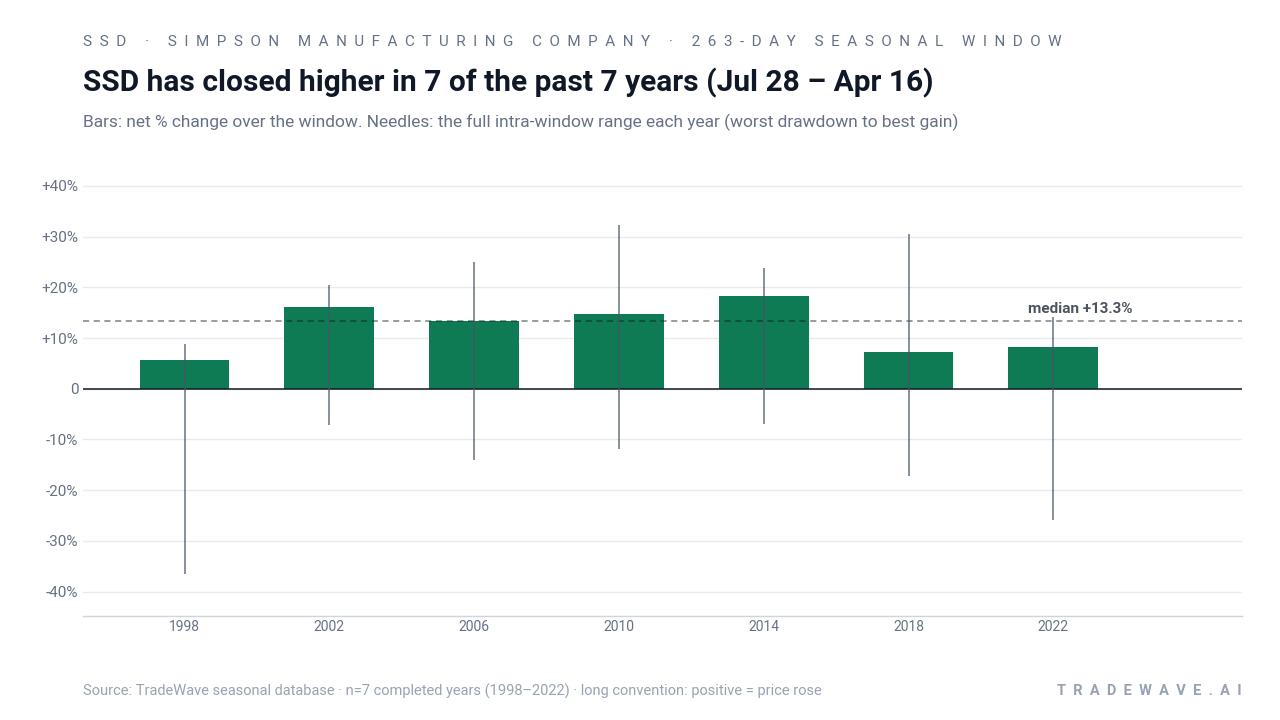
The stacked net, best-case and worst-case excursions show a clear pattern: SSD has tended to deliver double-digit upside at some point in the window, but that upside has often come with double-digit drawdowns along the way. Large maximum favorable moves combined with sizable maximum adverse moves point to a high-variance environment where timing and risk management matter as much as the long-term seasonal bias.
History does not guarantee future results; adverse excursions can be large even in winning windows.
Why does Simpson Manufacturing Company (SSD) follow this seasonal pattern?
One likely driver is the way construction and housing cycles line up with the policy calendar. Midterm election years often bring fiscal debates and rate uncertainty in the first half, followed by clearer infrastructure and housing demand signals as the cycle shifts into the year before the presidential election. For a building-products supplier like Simpson Manufacturing Company, that backdrop can translate into stronger orders, better earnings visibility and portfolio rebalancing into the stock during this Jul-to-Apr stretch.
What is driving Simpson Manufacturing Company (SSD) today?
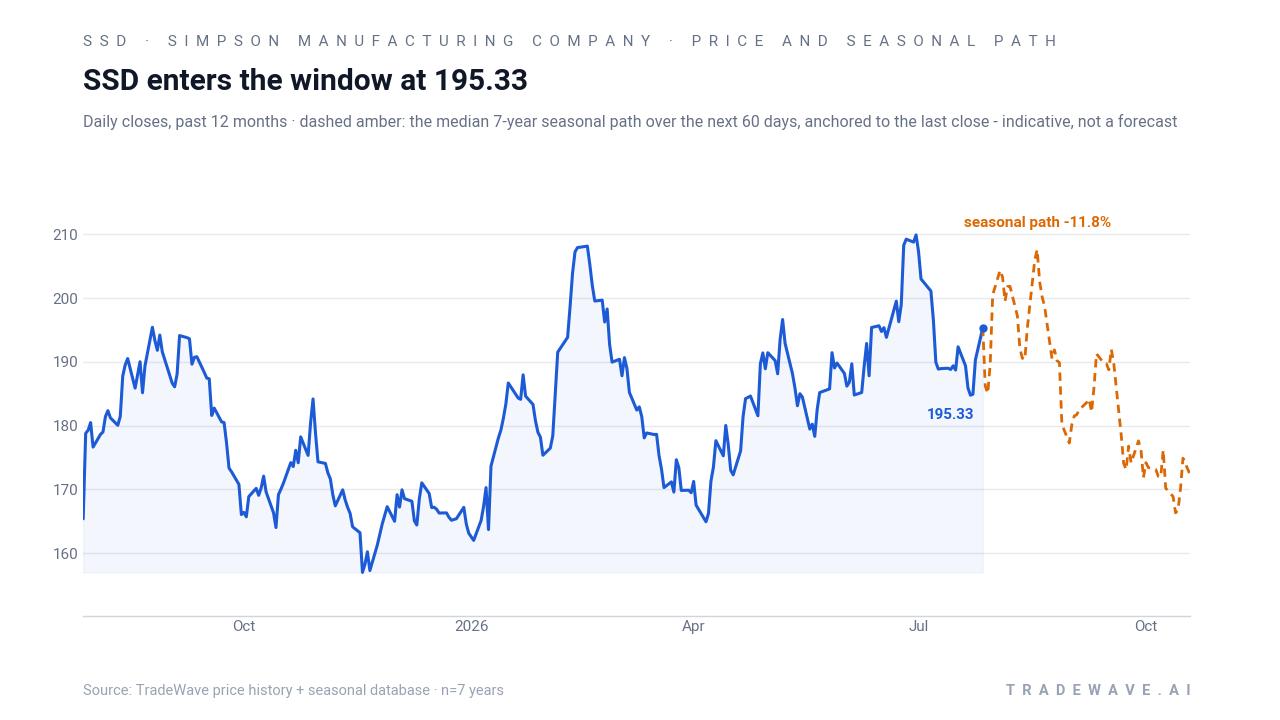
Simpson Manufacturing Company shares last traded at 193.24, down 0.33% on the day, after opening the session at 195.33 and trading between 192.00 and 196.93 on volume slightly below the 20-day average of about 313,678 shares. That leaves the stock roughly 9.2% below its 52-week high of 212.86 and about 24.9% above its 52-week low of 154.77, a middle-of-the-range setup as the new seasonal window begins.
Fundamentally, the company is coming off a string of earnings beats that have reinforced its reputation as a steady compounder in the construction hardware space. On Feb 9, 2026, Simpson Manufacturing reported quarterly revenue of $539.35 million versus estimates of $530.70 million and earnings per share of $1.35 versus $1.26, with net margins near 14.9% and return on equity around 18.1%.[3] In Oct 2025, the company posted $2.58 in EPS against a $2.37 consensus and delivered 6.2% year-over-year revenue growth, again with mid-teens margins and high-teens ROE.[4] An April 27, 2026 report showed another EPS beat of $0.31, underscoring a pattern of outperformance versus expectations.[10]
Analyst coverage reflects that steady profile. MarketBeat’s aggregation shows a consensus “Hold” rating with a blended price target around $201, implying modest upside from current levels and suggesting that many on the Street see SSD as fairly valued after its multi-year run.[1][2][6][9][10] Ownership data from late 2025 and early 2026 shows active institutional interest, with Rivulet Capital committing roughly $40.93 million and SG Americas Securities acquiring nearly 59,828 shares, while Envestnet trimmed its position and other managers adjusted exposure.[5][6][7][8] In Feb 2026, one earnings article also flagged insider selling, a reminder that management has occasionally taken profits into strength.[3]
The chart below situates the latest move in its recent multi-month context and overlays the median seasonal path for the next 60 days.
What should traders watch in this seasonal window?
For this Jul 28 to Apr 16 stretch, the first watchpoint is whether SSD respects its historical tendency to grind higher despite volatility. In prior midterm-election-year cycles, the stock has often seen its worst drawdowns early in the window before recovering into the pre-election year, so traders will be watching how it behaves around any 10% to 15% pullbacks relative to the 52-week range. A second focus is earnings: the next few quarterly reports will test whether the recent pattern of revenue and EPS beats can continue, which would help validate the long-biased seasonal trend.[3][4][10]
Levels also matter. On the upside, the 52-week high near 212.86 is a natural reference point for whether this cycle can match or exceed the stronger historical years that delivered mid- to high-teens gains. On the downside, any move that pushes SSD back toward the mid-150s would echo the deeper adverse excursions seen in 1998 and 2022, when the stock suffered large intraperiod drawdowns but still finished the window positive. Finally, traders will be monitoring institutional flows and insider activity: continued buying from long-only managers or a slowdown in insider selling would support the constructive seasonal backdrop, while heavy distribution or stepped-up insider sales would argue for more caution even inside a historically strong window.[3][5][6][7][8]
Sources
- MarketBeat – Robert W. Baird Issues Positive Forecast for Simpson Manufacturing (NYSE:SSD) Stock Price (Oct 29, 2025).
- MarketBeat – Simpson Manufacturing (NYSE:SSD) Hits New 12-Month High on Strong Earnings (Feb 10, 2026).
- MarketBeat – Simpson Manufacturing (NYSE:SSD) Issues Quarterly Earnings Results (Feb 9, 2026).
- MarketBeat – Simpson Manufacturing (NYSE:SSD) Issues Earnings Results (Oct 28, 2025).
- MarketBeat – 6,901 Shares in Simpson Manufacturing Company, Inc. (NYSE:SSD) Bought by Meridian Wealth Management LLC (Aug 14, 2025).
- MarketBeat – Rivulet Capital LLC Invests $40.93 Million in Simpson Manufacturing Company, Inc. (SSD) (Dec 8, 2025).
- MarketBeat – Envestnet Asset Management Inc. Sells 17,402 Shares of Simpson Manufacturing Company, Inc. (SSD) (Feb 13, 2026).
- MarketBeat – SG Americas Securities LLC Acquires 59,828 Shares of Simpson Manufacturing Company, Inc. (SSD) (Mar 30, 2026).
- MarketBeat – DA Davidson Forecasts Strong Price Appreciation for Simpson Manufacturing (NYSE:SSD) Stock (Apr 28, 2026).
- MarketBeat – Simpson Manufacturing (NYSE:SSD) Releases Earnings Results, Beats Expectations By $0.31 EPS (Apr 27, 2026).
About this seasonal analysis
Seasonal pattern data is sourced from TradeWave.ai, which analyzes historical price behavior across annual calendar windows going back up to 30 years. Read the full data methodology or the book The 100-Year Pattern by Afshin Moshrefi (2026 edition). Past performance of seasonal patterns does not guarantee future results. This article is for informational purposes only and does not constitute investment advice.