8-for-8 Midterm Streak: Amphenol (APH) Nears 335-Day Window Averaging 20.91% Gains
Amphenol is pulling back ahead of Q2 earnings even as it approaches a 335-day midterm-year seasonal window that has never produced a losing cycle in the historical record.
Price as of Jul 24, 2026: $152.67 (last close).

What is the seasonal pattern for Amphenol (APH)?
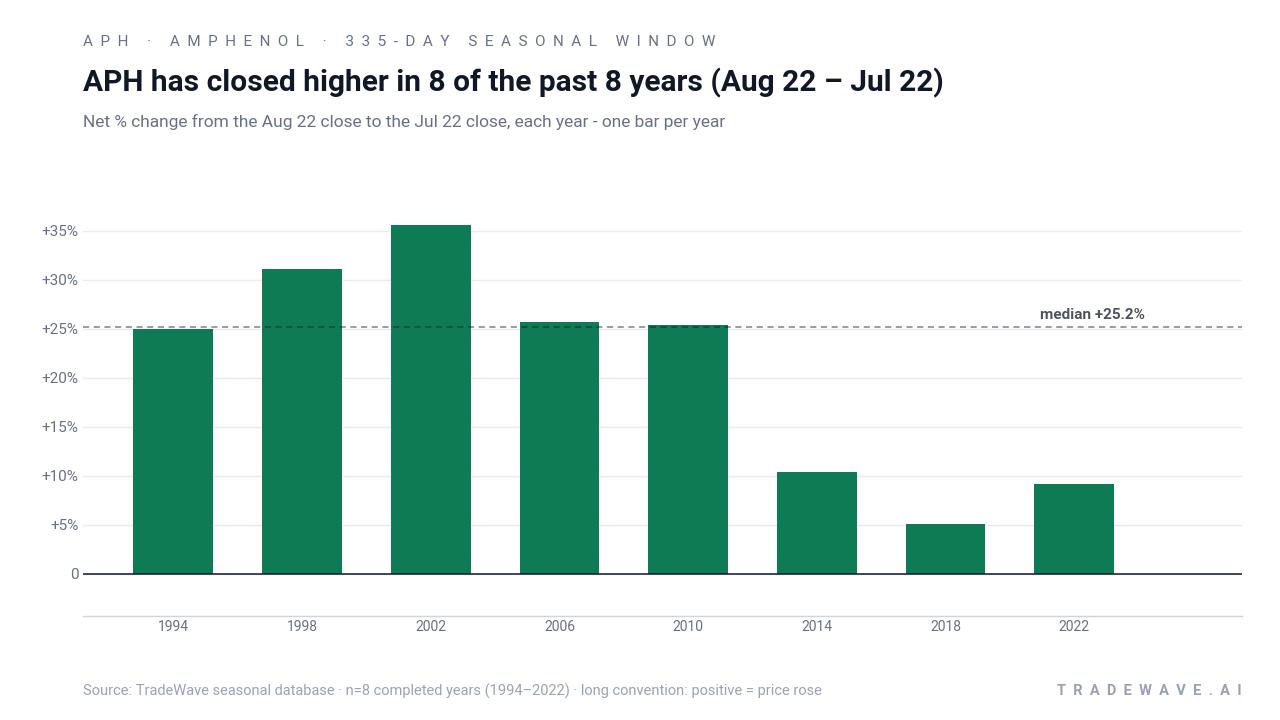
Amphenol has risen in 8 of 8 midterm-election-year windows starting Aug 22, with an average gain of 20.91% in winning years.
- 8 for 8 in this window, with Amphenol averaging 20.91% gains across all winning years.
- The upcoming seasonal window begins Aug 22 and runs for 335 days, spanning the late midterm election year into the year before the presidential election.
- Percent Profitable is 100%, with 8 winners and 0 losers across the historical midterm-year sample.
- Annualized return for this Amphenol trading window is 20.45%, with a Sharpe ratio of 1.54 based on end-of-window outcomes.
- The TradeWave Ratio of 1.82 signals that price has typically traveled meaningfully in the long direction within the window, even before final closes.
- Individual years have still seen sizable drawdowns inside the window, with adverse moves as deep as roughly 35% before recovering.
According to historical data from TradeWave.ai, this stretch of the calendar has behaved very differently for Amphenol in past midterm election cycles. The next section looks at how that pattern has lined up with prior policy and market backdrops.
How has Amphenol (APH) traded in this midterm-year window?
Amphenol has posted gains in every one of the last eight midterm-election-year windows that start on Aug 22 and run for 335 days, averaging 20.91% per cycle. Today the stock closed at 152.67, down 3.0% on the session and well below its recent 52-week high of 178.52, leaving it about 14.5% under that peak. With the next iteration of this long seasonal regime less than a month away, the setup combines a rare 100% win record with a meaningful pullback into earnings.
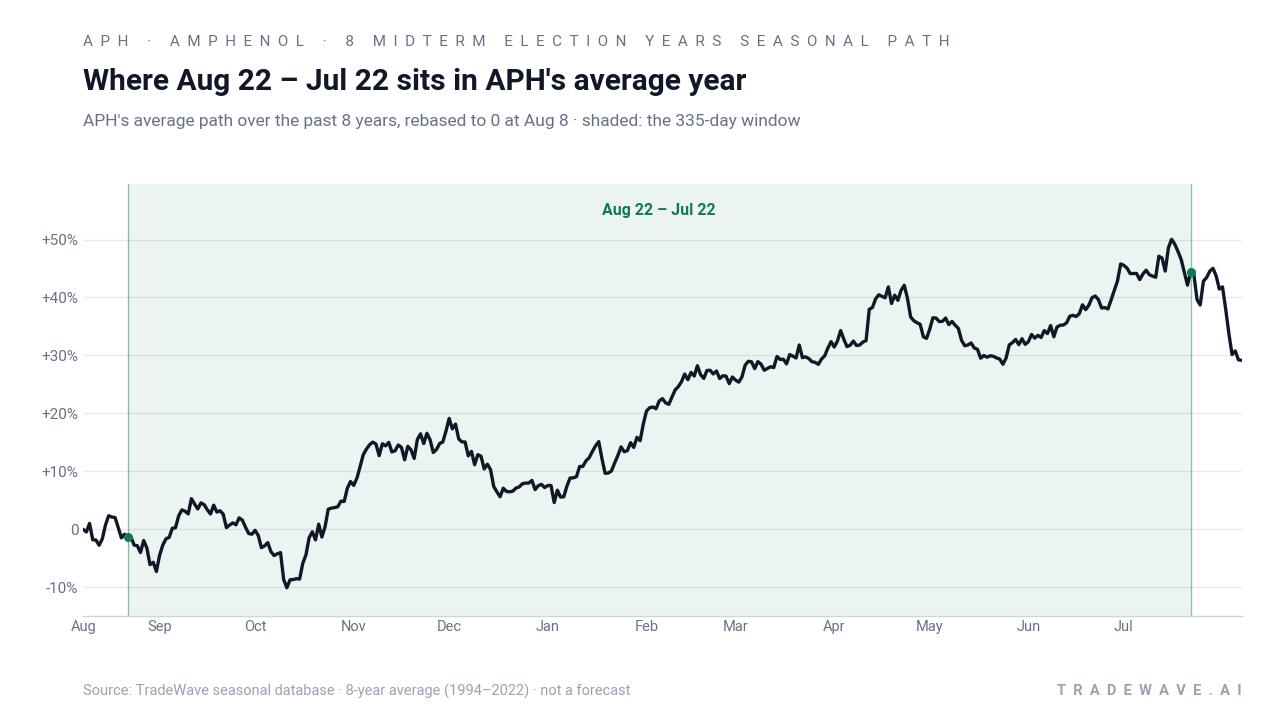
Grouping the data by the presidential election cycle matters here because this window always straddles the back half of a midterm election year and the start of the year before the presidential election, a phase that has often coincided with clearer policy visibility and stronger risk appetite. In this specific slice of the calendar, Amphenol’s historical seasonality has lined up with that broader pattern, showing a consistent bias to the upside when Washington gridlock and spending plans are better understood.
A closer look at individual years shows how much room Amphenol has typically had to run and how deep the worst drawdowns have been along the way.
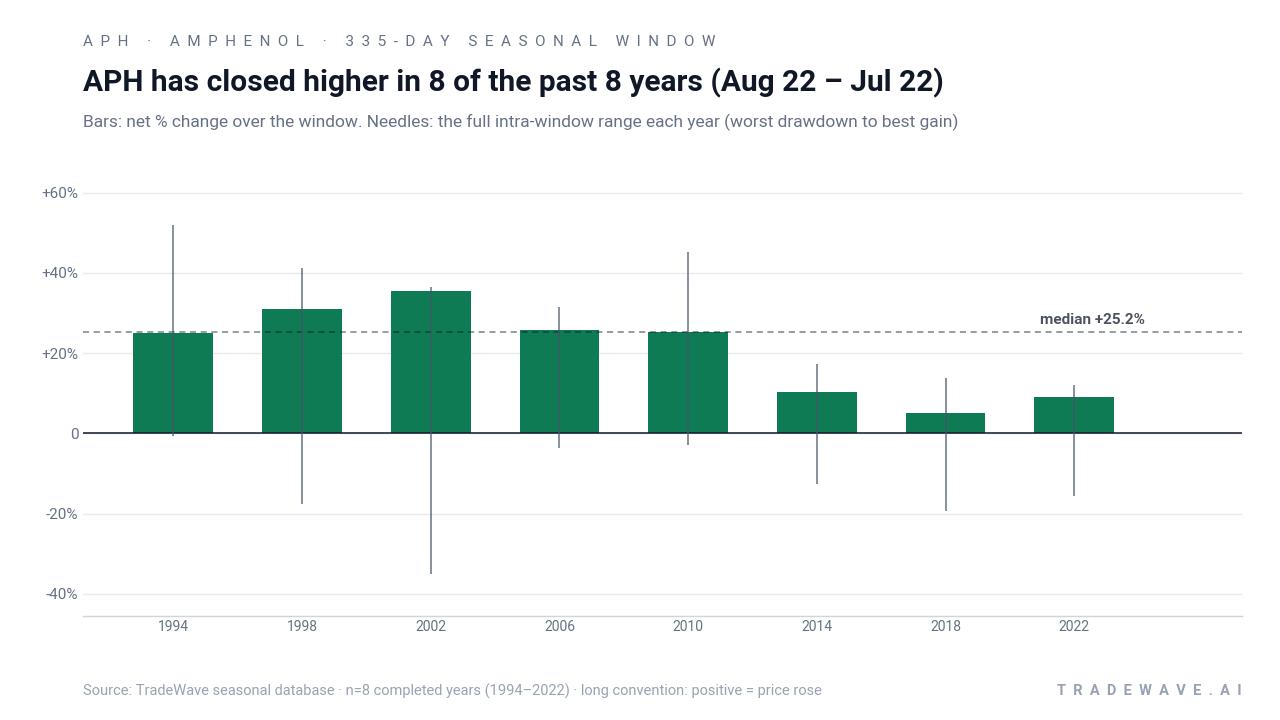
Across the eight midterm-year samples, the strongest net gain came in 2002, when Amphenol finished the window up 35.55% after a best intraperiod rally of 36.47% and a worst drawdown of about 35.0%. The softest outcome was 2018, which still ended with a 5.07% gain but saw the stock swing between a 13.83% peak run-up and a 19.34% adverse move before the window closed. That mix of large maximum favorable moves and sometimes deep maximum adverse moves is what drives the 1.82 TradeWave Ratio and underpins the 20.45% annualized return.
In practical terms, the pattern has favored staying aligned with the long direction rather than trying to fade strength. Every completed midterm-year window since 1994 has ended positive for a long stance, and the cumulative effect of stacking those eight cycles is a 342% gain. Add it up: this has been one of the most consistently constructive stretches of the calendar for Amphenol in the election-cycle framework.
History does not guarantee future results; adverse excursions (MAE) can be large even in winning windows, so intraperiod risk has been meaningful even when the final outcome was positive.
Why does Amphenol (APH) follow this seasonal pattern?
One likely driver is the way Amphenol’s earnings calendar and capital spending cycles line up with the broader midterm-to-pre-election policy backdrop. Analysts have pointed to stronger risk appetite in the year before the presidential election, when regulatory and fiscal paths are clearer and industrial and electronics demand often firm up.[6] This pattern may also reflect institutional portfolio repositioning into quality growth names like Amphenol as visibility on rates, budgets and tech spending improves late in the midterm year.
What is driving Amphenol (APH) today?
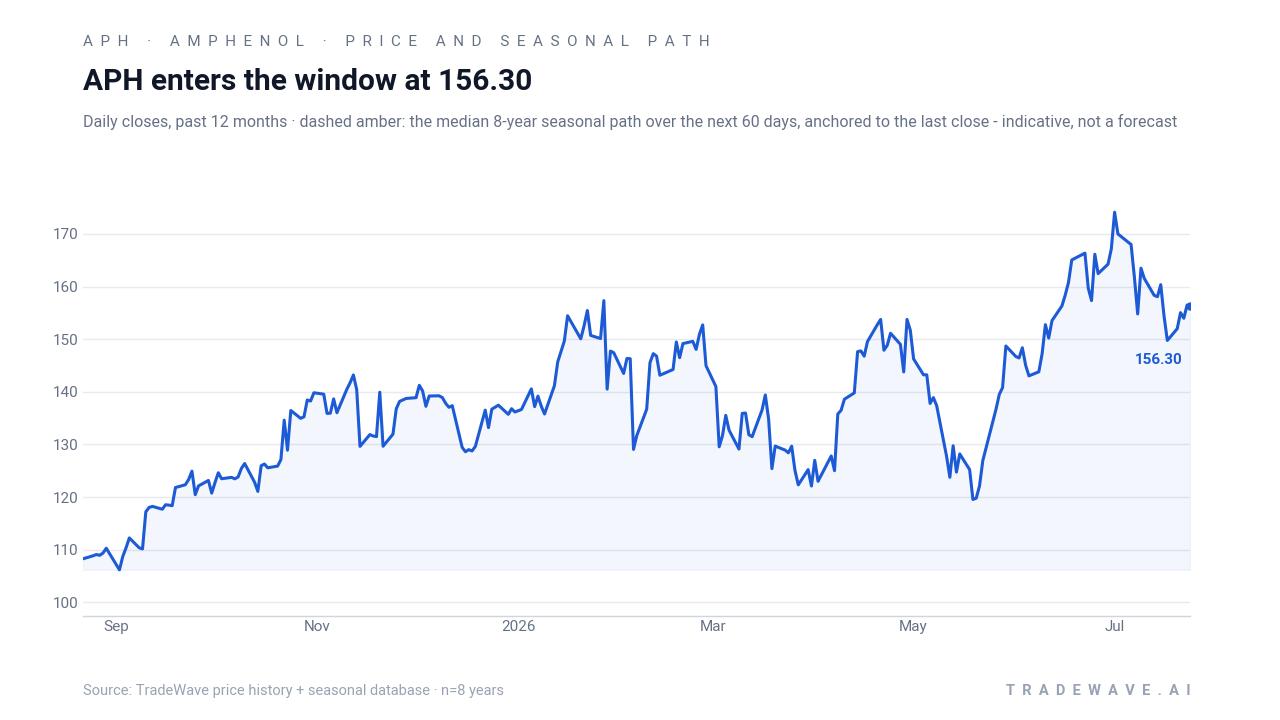
Amphenol shares closed Monday at 152.67, down 3.0% on the day and roughly 14.5% below their 52-week high of 178.52, extending a one-month slide of 7.56% as volume ran modestly below the 20-day average of about 6.97 million shares. The pullback comes just two days before the company is scheduled to report Q2 2026 results on Jul 29, where Zacks metrics flag Amphenol as a potential earnings beat candidate with an Earnings ESP of +1.12% and a top-tier rank.[3][4] MarketBeat data still show a “Moderate Buy” consensus rating and a consensus price target of 186, implying upside from current levels and reflecting a constructive longer-term view from Wall Street even after the recent weakness.[1][2]
The chart below puts the latest drop in context, alongside a historical seasonal projection for the next couple of months.
Institutional interest has remained active around the name, with filings in July showing firms such as North Point Portfolio Managers and Diversify Wealth Management adding to Amphenol positions, moves that align with the supportive analyst backdrop.[1][2] Earlier this year, Barchart highlighted Amphenol’s tendency to outperform the Nasdaq over multi-month stretches, underscoring how the stock has often behaved as a quality compounder within the broader tech and industrial complex.[6] Against that backdrop, the combination of a near-term earnings catalyst, a moderate valuation reset from the highs and a historically strong seasonal window on the horizon gives traders a distinct calendar lens for thinking about the next phase of the Amphenol trade.
What should traders watch as this Amphenol window approaches?
First, the Q2 2026 earnings report on Jul 29 is the immediate catalyst; how the stock reacts to any surprise relative to the flagged Earnings ESP and Zacks Rank will set the tone heading into the Aug 22 seasonal start date.[3][4] Second, the 150 area, just below the current 50-day moving average of about 150.82, is a key near-term level; holding that zone would keep the pullback orderly, while a decisive break could signal that this midterm-year setup will begin from a deeper discount. Third, watch whether analyst commentary and institutional flows stay supportive after earnings, especially given the existing “Moderate Buy” consensus and 186 price target from MarketBeat’s coverage universe.[1][2] Finally, as the Aug 22 window opens, traders will be watching whether Amphenol behaves anything like its historical pattern: early weakness followed by a grind higher would rhyme with prior cycles, while a failure to stabilize or a sharp break of prior lows would be a clear departure from the past seasonal trend.
Sources
- MarketBeat: North Point Portfolio Managers Corp OH Has $28.56 Million Stock Holdings in Amphenol Corporation (APH) (Jul 1, 2026)
- MarketBeat: Diversify Wealth Management LLC Purchases 13,295 Shares of Amphenol Corporation (APH) (Jul 14, 2026)
- Yahoo Finance: Comcast Gears Up to Report Q2 Earnings: What's in the Cards? (Jul 22, 2026)
- Yahoo Finance: Charter Communications to Report Q2 Earnings: What's in the Cards? (Jul 23, 2026)
- Barchart: APH Technical Analysis for Amphenol Corp Stock (accessed 2026)
- Barchart: Is Amphenol Stock Outperforming the Nasdaq? (Jun 2, 2026)
- Barchart: Are Wall Street Analysts Predicting Amphenol Stock Will Climb or Sink? (Feb 5, 2026)
About this seasonal analysis
Seasonal pattern data is sourced from TradeWave.ai, which analyzes historical price behavior across annual calendar windows going back up to 30 years. Read the full data methodology or the book The 100-Year Pattern by Afshin Moshrefi (2026 edition). Past performance of seasonal patterns does not guarantee future results. This article is for informational purposes only and does not constitute investment advice.