Iran Strike Headlines Meet a 100% Midterm Summer Win Record for Amazon (AMZN)
Amazon is approaching a late-July seasonal window that has been quietly bullish in every midterm election year in the sample, just as shares slide ahead of Q2 earnings and AWS headlines.
Price as of Jul 23, 2026: $233.66 (last close).
What is the seasonal pattern for Amazon (AMZN)?
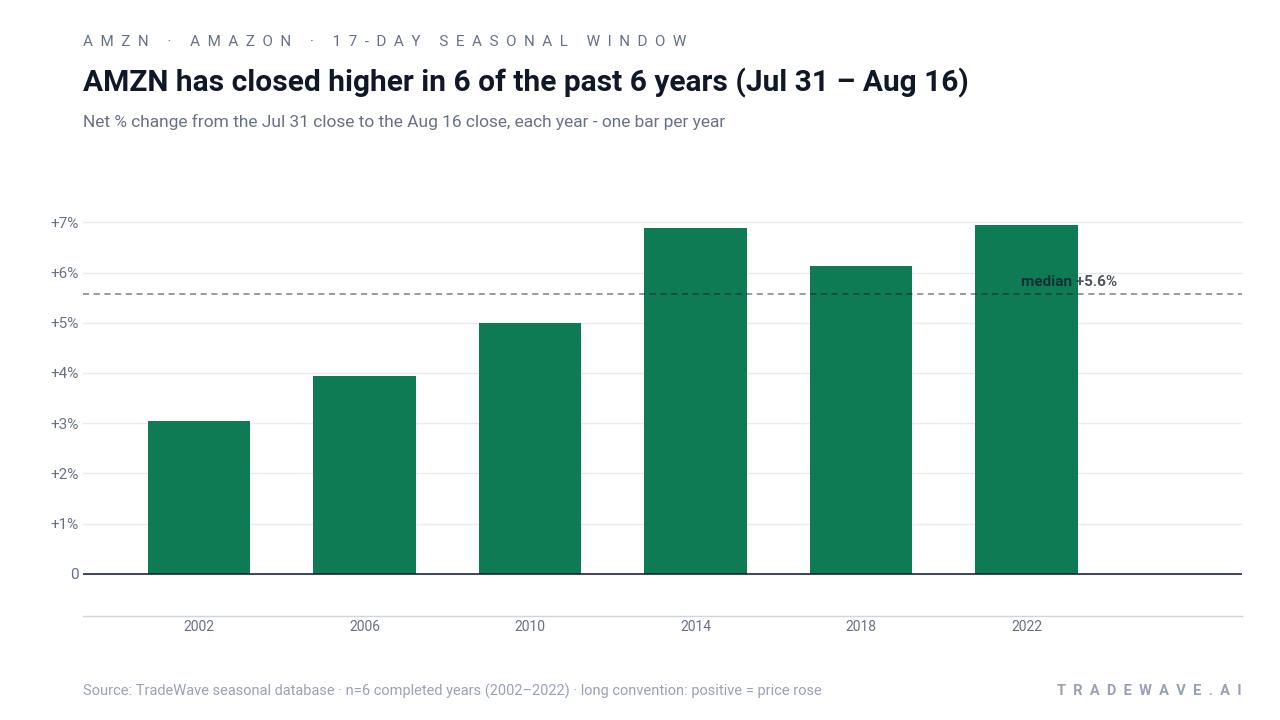
Amazon has risen in 6 of 6 midterm-year late-July windows, with an average gain of 5.32% in winning years.
- 6 for 6 in this window, averaging 5.32% gains in winning years across the last 6 midterm election cycles.
- The 17-day Amazon trading window runs from Jul 31 to Aug 16, aligned with the midterm election year phase.
- Percent Profitable is 100%, with 6 winners and 0 losers in the historical sample.
- Average profit of 5.32% in winning years stacks to a 36% cumulative gain when the window is repeated across cycles.
- The TradeWave Ratio of 3.23 signals that price has typically traveled meaningfully in the long direction within the window.
- Intraperiod swings have included sharp drawdowns in some years, so the path has not been a straight line even in winning windows.
According to historical data from TradeWave.ai, this midterm-year late-July stretch has behaved differently from an average summer for Amazon, with a distinct bias that shows up when you isolate the election cycle.
How has Amazon (AMZN) traded in the late-July midterm-year window?
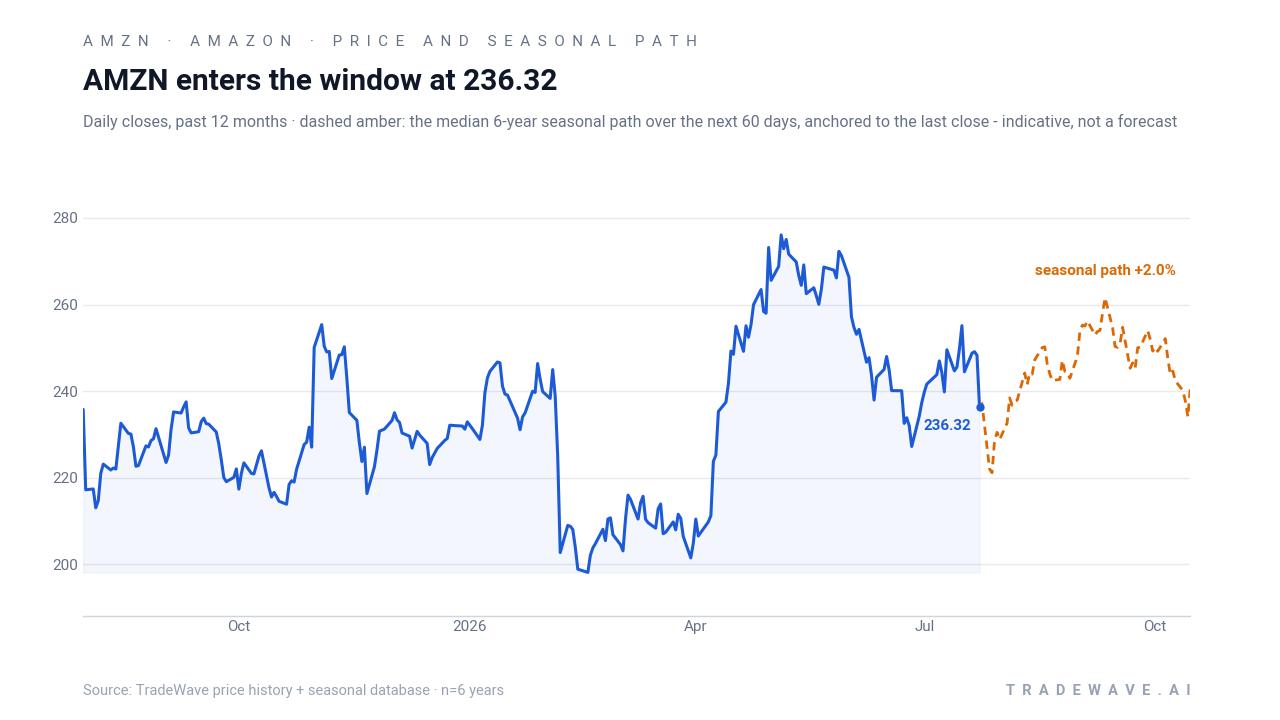
Amazon has closed higher in this Jul 31 to Aug 16 window in each of the last six midterm election years, averaging a 5.32% gain for long positions. Shares finished the prior session at 233.66, down 4.6% on the day and about 16.1% below their 52-week high of 278.56, leaving the stock in a pullback as the next iteration of this pattern approaches. That combination of a clean historical seasonal trend and a fresh drawdown into earnings gives this upcoming Amazon trading window more weight than a typical summer lull.
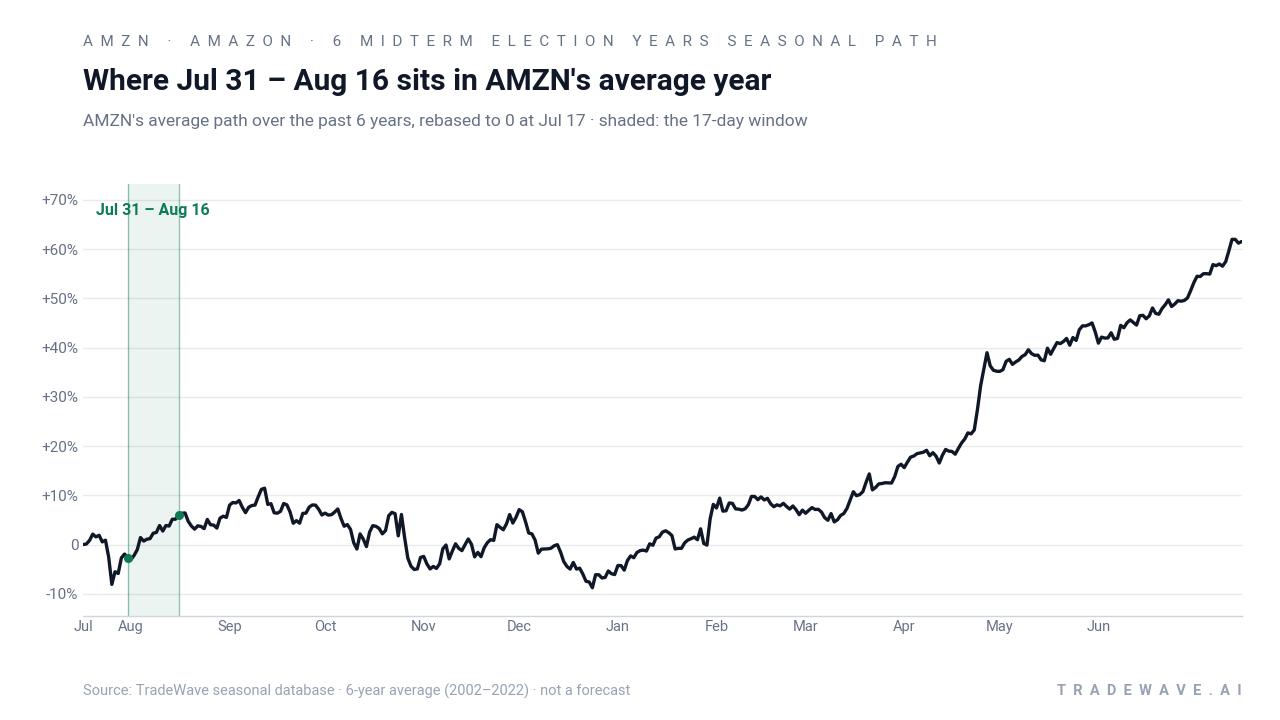
Because this pattern is grouped by the presidential election cycle, it only looks at midterm election years, not every calendar year. That matters for a mega-cap like Amazon, since midterm years often feature shifting fiscal priorities and regulatory noise that can hit large tech and cloud names differently than in the year after the presidential election or the pre-election year.
The upcoming seasonal window begins on Jul 31 and spans 17 days. Historically, during this period in midterm election years, Amazon has shown a strong bullish tendency for long trades, with every sampled year finishing in positive territory. The trade direction is explicitly long, so the pattern is built around capturing upside rather than fading strength.
Across the six midterm-year samples, the average winner gained 5.32%, with a median outcome of 5.57%. That is not a one-off spike: the cumulative return from stacking this specific 17-day window across the six cycles reaches 36%, which is meaningful for such a short slice of the calendar.
The per-year breakdown shows how that plays out. The weakest year in the sample, 2002, still delivered a 3.04% net gain, while the strongest, 2022, posted a 6.94% advance over the window. In between, years like 2014 and 2018 landed in the 6% to 7% range, reinforcing the idea that this is a consistently positive but not explosive Amazon seasonal trend.
A second view combines net results with the full intraperiod range, from worst drawdown to best run-up, for each year.
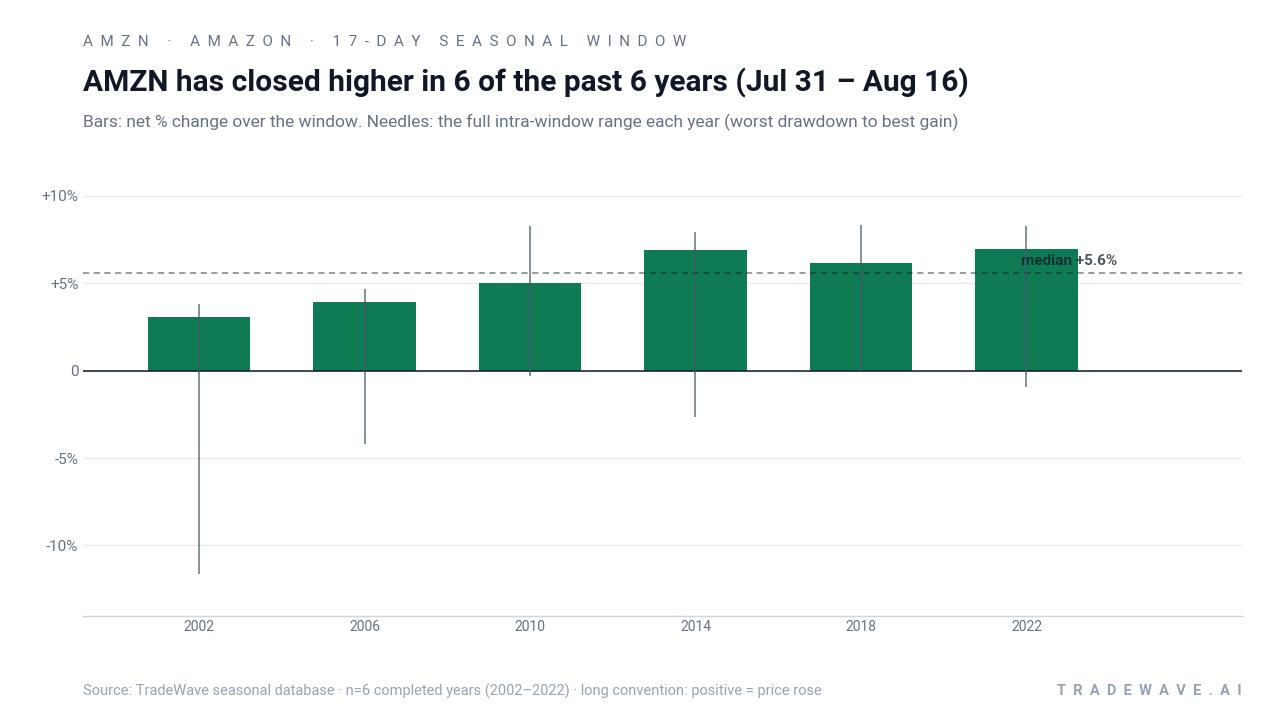
The intraperiod profile is where the risk shows up. In 2002, for example, Amazon ultimately finished the window up 3.04%, but the worst drawdown from entry reached about -11.62% before the stock recovered. Other years, such as 2010 and 2018, saw maximum favorable moves in the 8% range with very shallow adverse excursions, suggesting that when the trend catches early, the path can be smoother.
Put together, the maximum favorable excursions and the TradeWave Ratio of 3.23 indicate that Amazon has often traveled a sizable distance in the long direction during this stretch, even if the final close did not capture every intraday swing. At the same time, the presence of double-digit intraperiod drawdowns in at least one year is a reminder that this historically bullish Amazon seasonal window has not been low-volatility.
History does not guarantee future results; adverse excursions can be large even in winning windows, and traders still face the usual earnings, macro, and stock-specific risks.
Why does Amazon (AMZN) follow this seasonal pattern?
One likely driver is the clustering of Amazon’s Q2 earnings and guidance updates around the end of July, which can reset expectations for AWS, advertising, and retail just as institutional investors reposition for the back half of the year.[1] Analysts have also pointed to heavy cloud and AI CapEx as a swing factor for sentiment, which tends to be front and center in midterm election years when policy and regulation debates around big tech are elevated.[2] This late-July Amazon trading window may reflect that mix of earnings catalysts, portfolio rebalancing, and sector rotation as investors decide how much mega-cap tech risk they want to carry into the pre-election year.
What is driving Amazon (AMZN) today?
Amazon shares closed at 233.66 in the prior session, down 4.6% on the day and sitting about 16.1% below the 52-week high of 278.56, as traders recalibrated positions ahead of Q2 2026 earnings on Jul 31 and a busy stretch of cloud and AI headlines.[1] Fresh research from Morningstar and others highlights accelerating trailing twelve-month revenue growth into the mid-teens and emphasizes AWS and advertising as the key margin drivers into the back half of the year, even as heavy generative AI and data center CapEx weighs on near-term free cash flow.[1][2]
Near-term, the focus is squarely on AWS. Commentary ahead of the print points to expectations for AWS revenue growth to re-accelerate into double digits, which would reinforce the narrative that Amazon’s cloud arm is exiting its digestion phase and moving back into a healthier expansion track.[2] Any upside or downside surprise there could matter more than retail or advertising in the short run, especially with investors already primed for strong cloud numbers.
Beyond earnings, Amazon-specific news flow has been busy. Amazon Business recently reported $60 billion in gross sales year-to-date and more than 11 million organizations served, underscoring the company’s push into B2B commerce as a separate growth engine from consumer retail.[3] At the same time, reports of job cuts in Amazon’s artificial general intelligence research group signal a reshuffling of AI priorities, even as the company continues to invest heavily in generative AI infrastructure and services.[4][5]
Geopolitics has also crept into the story. Al Jazeera reporting summarized in market news indicated that Amazon’s data infrastructure in Bahrain was struck amid regional military activity, highlighting that AWS’s global footprint carries operational and security risks alongside its growth opportunity.[7] For a stock that investors increasingly treat as a proxy for cloud and AI demand, any sign of disruption to AWS capacity or reliability can feed into volatility around earnings and the upcoming seasonal window.
The chart below situates the latest pullback and the upcoming late-July window within Amazon’s recent 12-month trading range and a 60-day seasonal projection.
What should traders watch in this Amazon (AMZN) window?
The first checkpoint is Q2 earnings on Jul 31, which land exactly as the 17-day seasonal window opens. Watch AWS revenue growth and commentary on generative AI workloads, since those have been the main pillars of the bullish medium-term thesis in recent research.[1][2] Strong cloud numbers and constructive guidance would rhyme with the historical pattern of positive late-July performance in midterm election years.
Second, monitor how Amazon trades around the 52-week band. A move back toward the mid-240s and then into the 260–270 zone during the window would be consistent with prior cycles where the stock used this period to claw back ground after a pullback. Failure to hold recent lows or a break materially below the 52-week low region would contradict the historical Amazon seasonal trend and signal that macro or company-specific pressures are overwhelming the pattern.
Third, keep an eye on the policy and regulatory calendar. Midterm election years often bring hearings, antitrust chatter, and debates over AI and data privacy that can swing sentiment on mega-cap tech. Any surprise headlines on cloud regulation, AI oversight, or digital advertising rules during this stretch could inject volatility into what has historically been a constructive Amazon trading window.[1]
Finally, watch how investors digest the ongoing reshuffle in Amazon’s AI and AGI efforts and any follow-up reporting on AWS infrastructure risks, including the Bahrain incident.[4][5][7] If management uses the earnings call to clarify its AI roadmap and address resilience in its global data center network, and the stock responds with renewed buying interest, that would align with the historical pattern of late-July strength. A muted or negative reaction, especially if accompanied by fresh concerns on AI execution or cloud security, would be an early sign that this midterm-year window may not follow the script.
Sources
- Morningstar: Going Into Earnings, Is Amazon Stock a Buy, a Sell, or Fairly Valued? (Jul 23, 2026)
- Seeking Alpha: Amazon: A Scaled-Up AWS Rinse And Repeat Is All It Needs (Jul 18, 2026)
- Seeking Alpha (news): Amazon Business reaches $60B in sales, 11M organizations (Jul 21, 2026)
- Seeking Alpha (news) / Reuters: Amazon cutting jobs in artificial general intelligence group (Jul 22, 2026)
- Barchart: AMZN Stock Layoffs: What to Know as Amazon Cuts AI Jobs (Jul 23, 2026)
- Seeking Alpha (news) / Al Jazeera: Iran strikes Amazon's Bahrain data infrastructure (Jul 21, 2026)
- CNBC: UBS lifts Amazon price target ahead of e-commerce giant’s earnings (Oct 28, 2025)
About this seasonal analysis
Seasonal pattern data is sourced from TradeWave.ai, which analyzes historical price behavior across annual calendar windows going back up to 30 years. Read the full data methodology or the book The 100-Year Pattern by Afshin Moshrefi (2026 edition). Past performance of seasonal patterns does not guarantee future results. This article is for informational purposes only and does not constitute investment advice.