Gilead Sciences (GILD) Has Rallied in 7 of 8 Midterm Fall Windows, Averaging 9% Gains
Gilead Sciences is trading around $131 as it approaches an 81-day midterm-year seasonal window that has usually favored the bulls, even as the biotech leans into heavy R&D spending and deal-making.
Price as of Jul 23, 2026: $130.86 (last close).
What is the seasonal pattern for Gilead Sciences (GILD)?
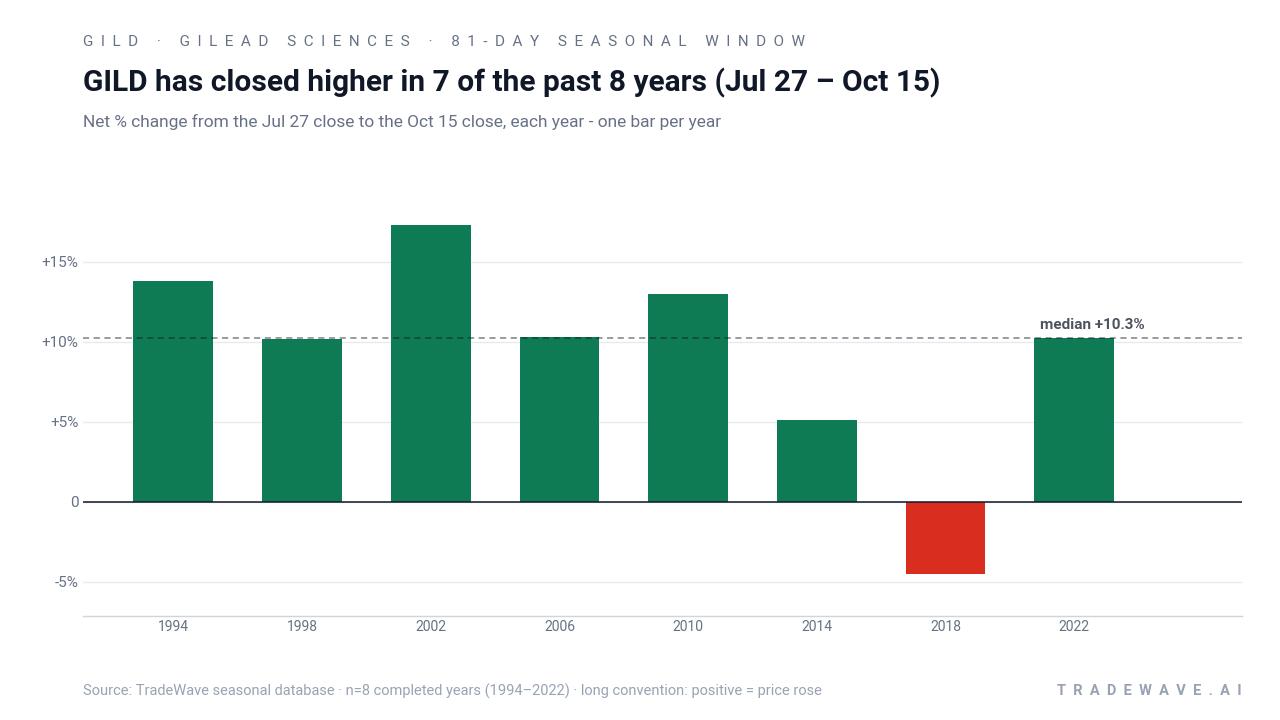
Gilead Sciences has risen in 7 of 8 years during this late-July to mid-October window, with an average gain of 11.42% in winning years.
- 7 for 8 in this window, with winning years averaging 11.42% gains across the last 8 midterm election cycles.
- The 81-day trading window runs from Jul 27 to Oct 15 and has been a historically bullish GILD seasonal trend in midterm election years.
- Percent Profitable is 88%, with 7 winners and just 1 loser across the sample.
- Including the lone down year, Avg Profit - All comes in at 9%, showing the stock pattern analysis has held up even after losses.
- The worst year in the sample lost 4.51%, but intraperiod drawdowns have reached as deep as about 20% before recovering.
- TradeWave Ratio (TWR) of 1.8 and a Sharpe ratio of 1.29 point to a historically favorable risk-reward profile for long exposure in this Gilead Sciences trading window.
According to historical data from TradeWave.ai, this late-summer stretch has behaved very differently from an average quarter for Gilead Sciences, and the next iteration is about to begin.
How has Gilead Sciences (GILD) traded in this midterm-year window?
Gilead Sciences has closed higher in 7 of the last 8 midterm election years during the Jul 27 to Oct 15 window, stacking a 102% cumulative gain across those cycles. Shares finished the prior session at $130.86, leaving the stock about 14.7% below its 52-week high and roughly 26.9% above its 52-week low. That combination of a strong historical seasonality profile and mid-range price positioning is what makes this upcoming 81-day stretch stand out on the biotech calendar.
Because this pattern is grouped by presidential election cycle, it only looks at the last 8 midterm election years, not every calendar year. That matters in 2026, which is itself a midterm election year, and it means the upcoming window also sits inside the broader midterm-to-pre-election regime that has often been friendlier to risk assets than the choppy first half of the cycle.
The trade direction for this setup is long, and the historical record backs that up. Percent Profitable sits at 88%, with 7 winners and 1 loser, and the average gain in winning years is 11.42% compared with an all-years average of 9%. The single down year in 2018 saw a 4.51% loss over the window, which is meaningful but still modest relative to the stronger up years.
Looking at individual cycles, 2002 stands out as the strongest year, with a 17.28% net return and a maximum favorable move of 28.5% from the entry price before the window closed. On the other side of the ledger, 1998 delivered the deepest intraperiod drawdown, with a maximum adverse move of about 20% even though the window still finished up 10.16%. That mix of strong finishes and sometimes sharp mid-window swings is a key feature of this GILD seasonal pattern.
The maximum favorable excursion, or best point-to-peak move within the window, has often been much larger than the final net gain. In 1994, for example, Gilead rallied as much as 36.05% from the entry level before settling back to a 13.83% gain by Oct 15. Maximum adverse excursions, or worst drawdowns from entry, have ranged from relatively shallow pullbacks of less than 2% in 2006 and 2014 to that roughly 20% air pocket in 1998, underscoring that even historically strong windows can involve uncomfortable volatility.
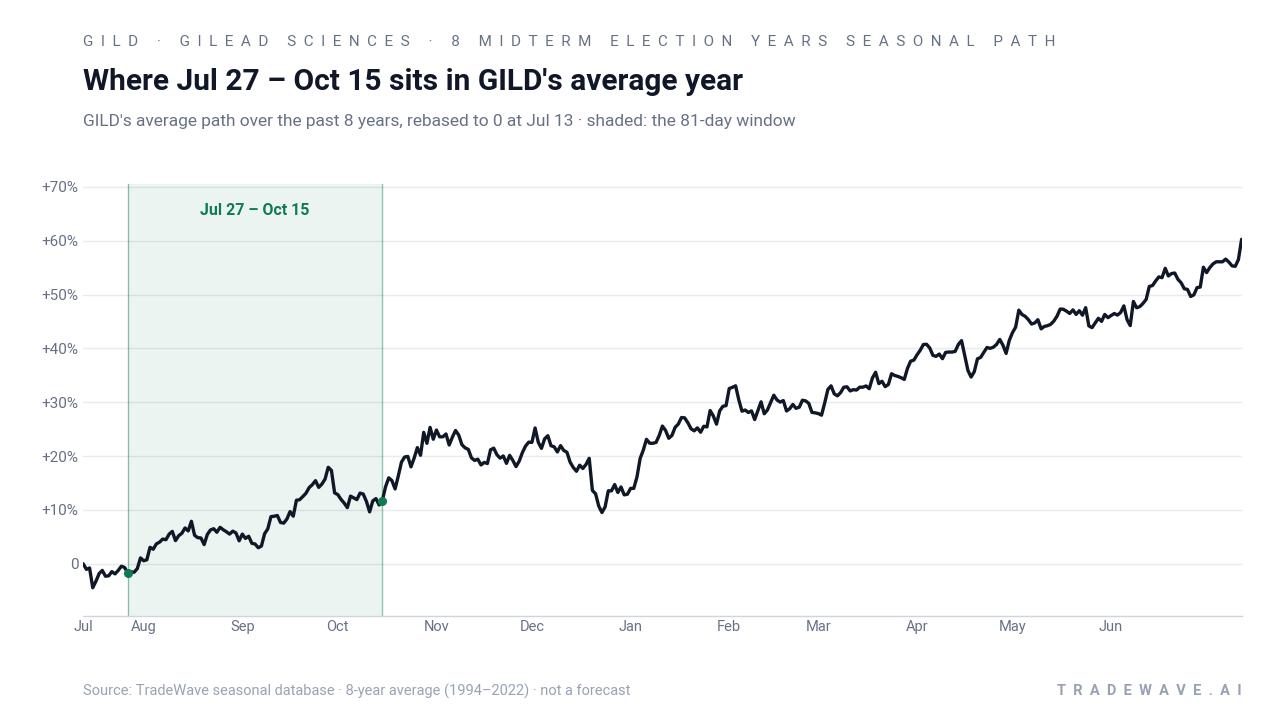
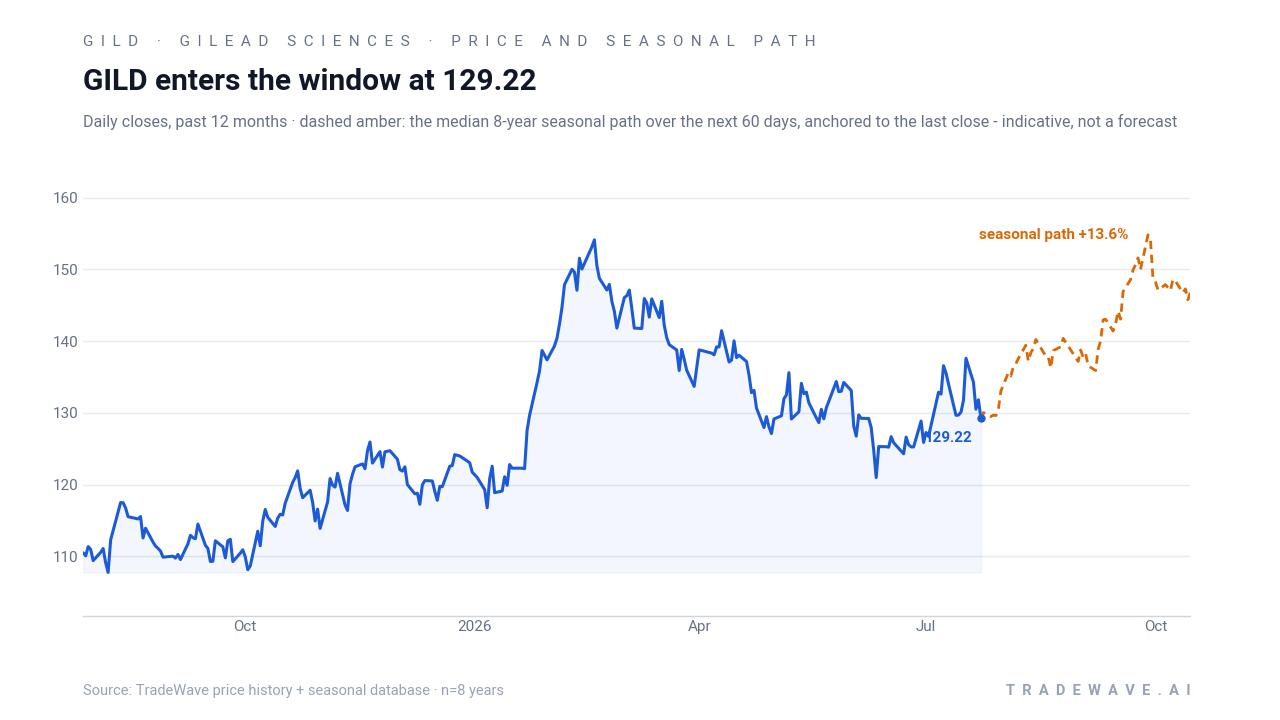
The historical seasonal average shows Gilead’s returns tending to grind higher through this late-July to mid-October stretch, with much of the upside accruing in the middle of the window rather than in a single burst. That profile fits a pattern where rallies build over several weeks as news flow around drug data, conferences and portfolio repositioning filters through the biotech sector.
The next chart shows how each year’s net result lines up with its best rally and worst drawdown inside the window.
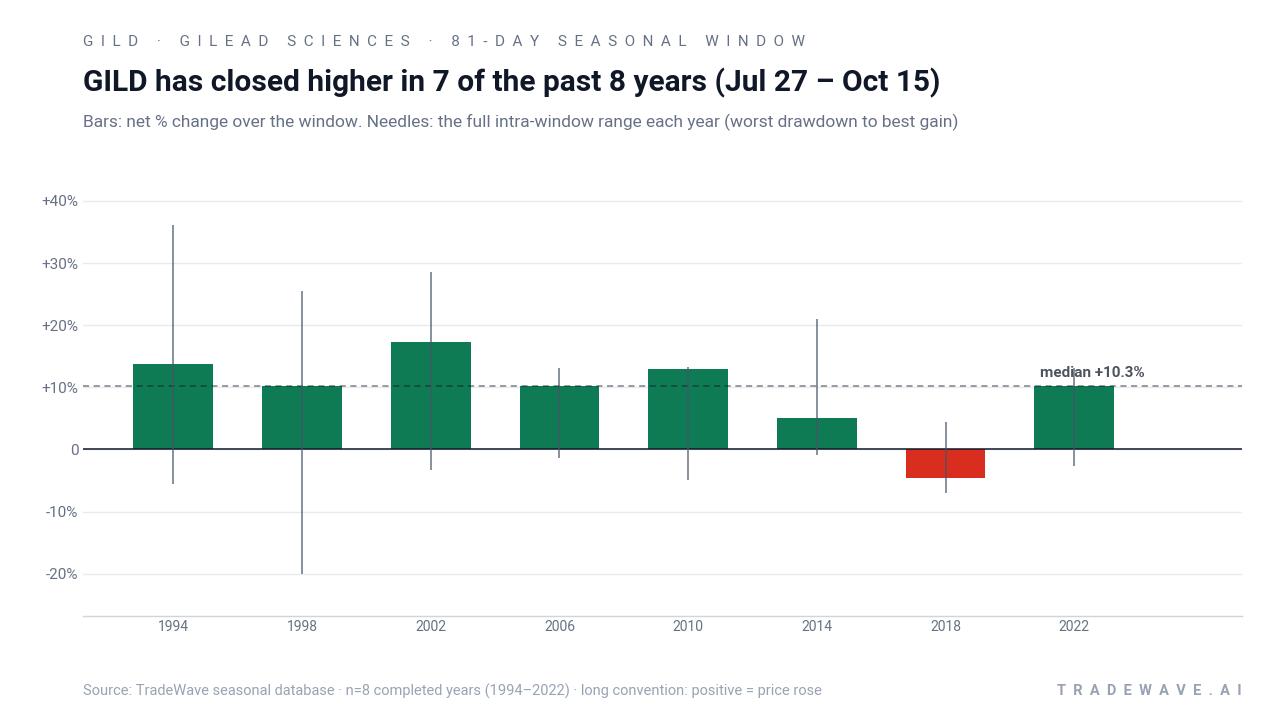
The stacked net, best-case and worst-case profile shows a window that has historically offered meaningful upside potential with contained but non-trivial downside. In most years, the maximum favorable move has been well into double digits, while the worst drawdowns have usually stayed in the mid-single digits, with 1998 as the clear outlier. Add it up and the 81-day window has compounded to a 102% cumulative gain across the eight midterm-year samples, which is why this slice of the calendar keeps showing up in GILD seasonal pattern work.
History does not guarantee future results; adverse excursions can be large even in winning windows, and past seasonal behavior may not repeat.
Why does Gilead Sciences (GILD) follow this seasonal pattern?
One likely driver is the way biotech news and capital flows cluster around late-summer and early-fall events, including major medical conferences and portfolio repositioning ahead of year-end. Analysts have also pointed to institutional rebalancing in the healthcare sector during the midterm election year, when policy risk and drug-pricing rhetoric can be elevated but often fade into the pre-election year. For a large-cap name like Gilead, that mix of event-driven catalysts and macro positioning may help explain why this specific Jul 27 to Oct 15 window has tended to favor long exposure in prior midterm cycles.
What is driving Gilead Sciences (GILD) today?
Gilead shares ended the latest session at $130.86, up 0.4% on the day, after trading between $127.61 and $131.07 on volume of about 6.3 million shares. That leaves the stock roughly 14.7% below its 52-week high of about $153.49 and about 26.9% above its 52-week low near $103.10, with the 50-day moving average sitting close by at $128.99 and 20-day average volume around 7.5 million shares.
Fundamentally, the story is still shaped by a strong HIV franchise and an aggressive push into oncology and liver disease. In Aug 2025, Gilead raised its 2025 adjusted EPS and product sales guidance after a Q2 report that showed flat adjusted earnings but better-than-expected HIV drug sales and a solid start for new therapy Yeztugo.[1] In Feb 2026, the company followed up with a $7.8 billion deal to buy Arcellx, securing full rights to a cancer treatment that could begin contributing to earnings around 2028 if approved.[3] By Apr 2026, Gilead had also agreed to acquire Tubulis for up to $5 billion to deepen its antibody-drug conjugate pipeline, funded with cash and senior unsecured notes.[4]
Those deals come on top of a sharp reset to near-term profitability. In May 2026, Gilead told investors it expected an adjusted loss of $1.05 to $0.65 per share for 2026, driven by about $11.5 billion in acquired in-process R&D charges that would hit adjusted EPS by roughly $9.50.[2] The guidance marked a swing from prior expectations of solid adjusted earnings and underscored how much of the current investment case hinges on pipeline execution rather than near-term margin expansion.
Market reaction to these moves has been anything but sleepy. When Gilead raised its full-year outlook in Aug 2025, the stock jumped 8.6% in a single session, helping lift broader healthcare sentiment as investors rewarded the combination of steady HIV cash flows and disciplined costs.[5] By contrast, the Arcellx announcement in Feb 2026 saw Gilead slip 1.1% while its target surged more than 70%, a classic pattern when acquirers pay up for high-growth assets.[3] That split reaction captures the tension heading into this year’s seasonal window: the company is spending heavily to secure future growth, and the stock is trading in the middle of its 52-week range as investors weigh long-duration oncology optionality against near-term earnings dilution.
The chart below situates the latest move in its recent multi-month context alongside the historical 60-day seasonal projection.
What should traders watch in this GILD seasonal window?
First, the calendar: the 81-day window opens on Jul 27 and runs through Oct 15, overlapping a period when midterm election-year policy noise can be high but markets often start to look ahead to the historically stronger pre-election year. For Gilead, that means any clarity on drug-pricing rhetoric, reimbursement policy or oncology trial milestones could interact with a backdrop that has usually favored upside in this slice of the year.
Second, price levels matter. Traders will be watching whether GILD can hold above its 50-day moving average near $129 and build a base between roughly $125 and $135 as the window opens. A pattern where pullbacks stay shallow relative to the historical maximum adverse moves, while rallies start to resemble prior maximum favorable excursions, would be one way to see the historical seasonality reassert itself.
Third, deal and pipeline headlines remain a swing factor. Any updates on integrating Arcellx or closing the Tubulis transaction, along with fresh data from HIV, oncology or liver-disease programs, could provide the kind of catalysts that historically have driven the double-digit winning years in this window.[2][3][4] Conversely, delays, safety concerns or regulatory pushback would test how much of the seasonal bias is already priced into a stock that has rallied off its lows but still trades below its 52-week peak.
Finally, volatility itself is a signal. The historical record shows that even in winning years, GILD has sometimes endured mid-window drawdowns in the mid- to high-single digits before finishing higher. If this year’s window opens with a sharp selloff that quickly stabilizes and reverses, it would fit the pattern of prior cycles. A deeper, persistent break that pushes beyond the worst historical adverse moves would be a sign that the 2026 setup is diverging from the usual GILD seasonal trend and that macro or company-specific forces are overwhelming the calendar effect.
Sources
- Reuters: Gilead posts flat second quarter profit, ups full-year outlook on strong HIV sales (Aug 7, 2025)
- The Wall Street Journal: Gilead Sciences Expects Loss This Year on Acquired R&D Expenses (May 7, 2026)
- MarketWatch: Gilead shows belief in its partner’s cancer treatment with $7.8 billion buyout (Feb 23, 2026)
- The Wall Street Journal: Gilead Sciences to Buy Clinical-Stage Biotech Tubulis for Up to $5 Billion (Apr 7, 2026)
About this seasonal analysis
Seasonal pattern data is sourced from TradeWave.ai, which analyzes historical price behavior across annual calendar windows going back up to 30 years. Read the full data methodology or the book The 100-Year Pattern by Afshin Moshrefi (2026 edition). Past performance of seasonal patterns does not guarantee future results. This article is for informational purposes only and does not constitute investment advice.