Chevron Corporation (CVX) Has Dropped in 9 Straight Late-July Windows, Shorts Averaged 3.83%
Chevron Corporation is heading toward a late-July trading window that has reliably favored the short side even as the stock trades well below its 52-week high and investors weigh oil prices, Venezuela exposure and capital returns.

Price as of Jul 9, 2026: $174.05 (last close).
What is the seasonal pattern for Chevron Corporation (CVX)?
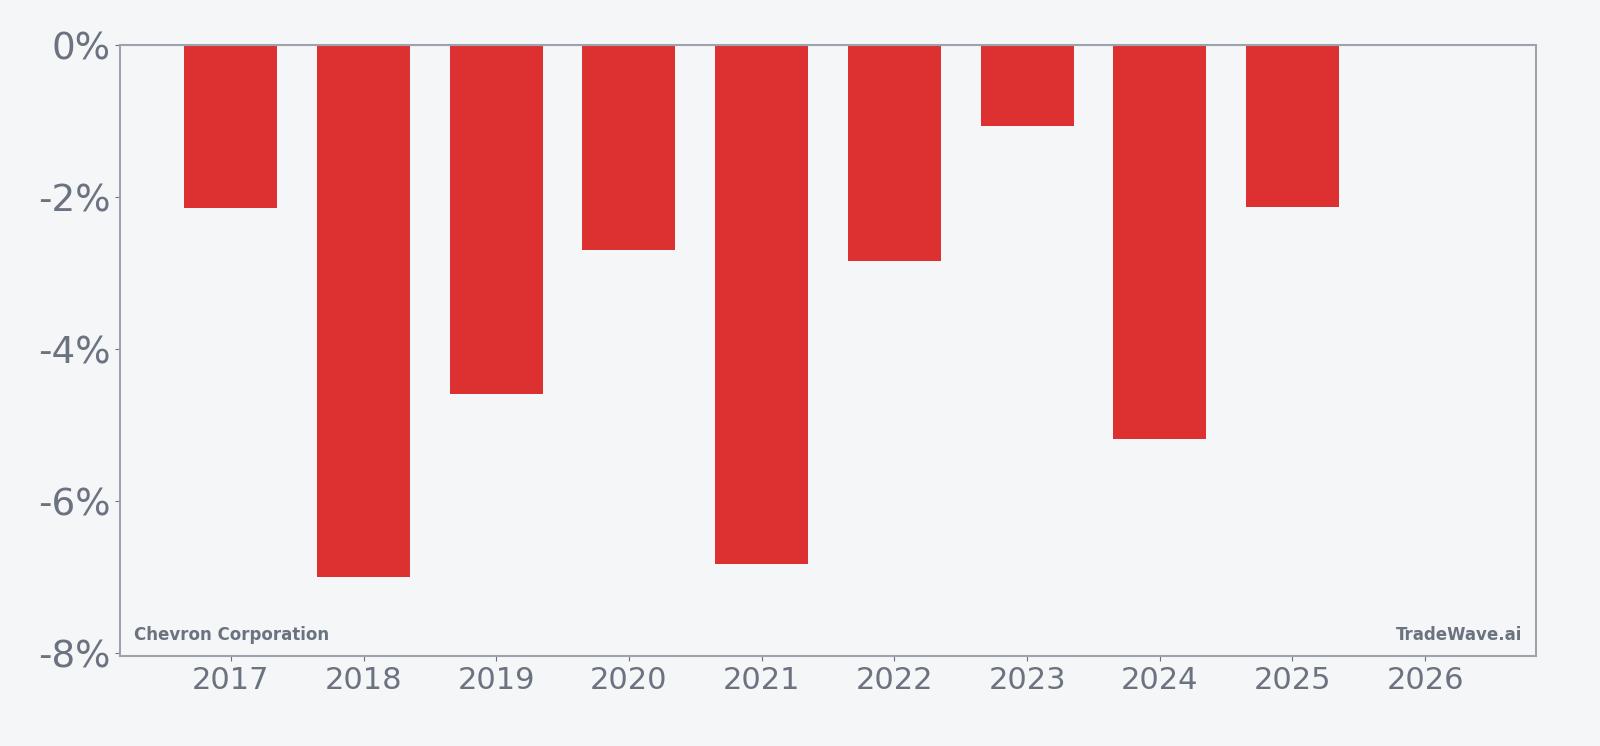
Chevron Corporation has fallen in 9 of 9 years during this late-July window, with an average gain of 3.83% in winning short trades.
- 9 for 9 in this window for short trades, with average winning returns of 3.83% over the past nine years.
- Seasonal window starts Jul 29 and runs for 22 calendar days, targeting a historically weak stretch for CVX.
- Percent Profitable is 100%, with 9 winners and 0 losers for the short-side pattern.
- Cumulative return across all nine short trades is 40%, with a Sharpe ratio of 1.67 for end-of-window outcomes.
- The TradeWave Ratio of 2.56 signals that price has typically traveled meaningfully in the trade direction within the window.
- Individual years have seen adverse moves inside the window, so intraperiod drawdowns can still be uncomfortable even when the short ultimately works.
According to historical data from TradeWave.ai, this late-July stretch has behaved very differently from an average month on the Chevron calendar, and the next iteration is about to open again.
How has Chevron Corporation (CVX) traded in this late-July seasonal window?
Chevron Corporation has delivered a winning short trade in this late-July window in 9 of the past 9 years, with average gains of 3.83% for those short positions. The next 22-day window begins on Jul 29, lining up with a stock that last closed at $174.05, about 17.5% below its 52-week high of $210.83. For traders who care about historical seasonality, that combination of a clear downside bias and a stock trading well off its highs makes this upcoming Chevron Corporation trading window hard to ignore.
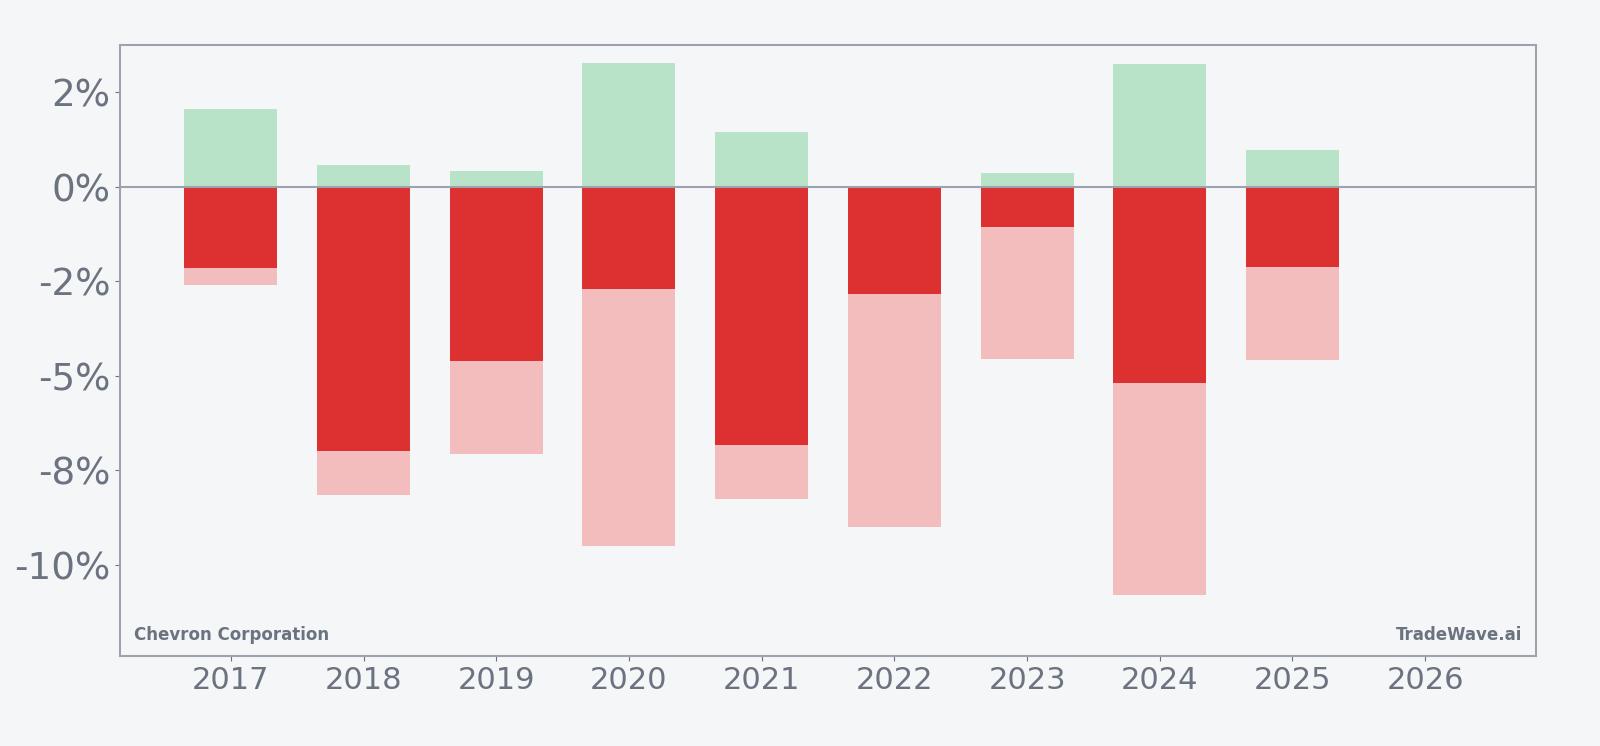
Year-by-year bars with maximum favorable and adverse moves show how consistently this window has leaned lower for CVX while still allowing for sharp countertrend swings.
Across the nine-year sample, every single iteration of this CVX seasonal trend has ended with the stock lower over the 22-day span, which is why the Percent Profitable metric for the short side sits at 100% with 9 winners and 0 losers. Average profit of 3.83% for winning shorts lines up with a 40% cumulative gain across the sample, while the 1.67 Sharpe ratio shows that the end-of-window results have been relatively consistent for a single-stock pattern. The TradeWave Ratio of 2.56 indicates that, within the window, price has typically moved a meaningful distance in the trade direction, not just drifted lower by a few ticks.
The per-year table shows that the strongest short-side year was 2018, when a short entered around $90.48 and exited near $84.14 for a net return of about 7.0%, while the weakest outcome was 2023 with a 1.07% gain for the short from roughly $144.24 to $142.69. In several years, such as 2020 and 2024, the maximum favorable move inside the window exceeded 3%, but those same windows also saw maximum adverse moves between about 9% and 11%, underscoring that intraperiod rallies against the short have been common even when the final result favored bears. That is the essence of the MFE/MAE profile here: sizable peak run-ups in the trade direction paired with drawdowns that can test conviction.
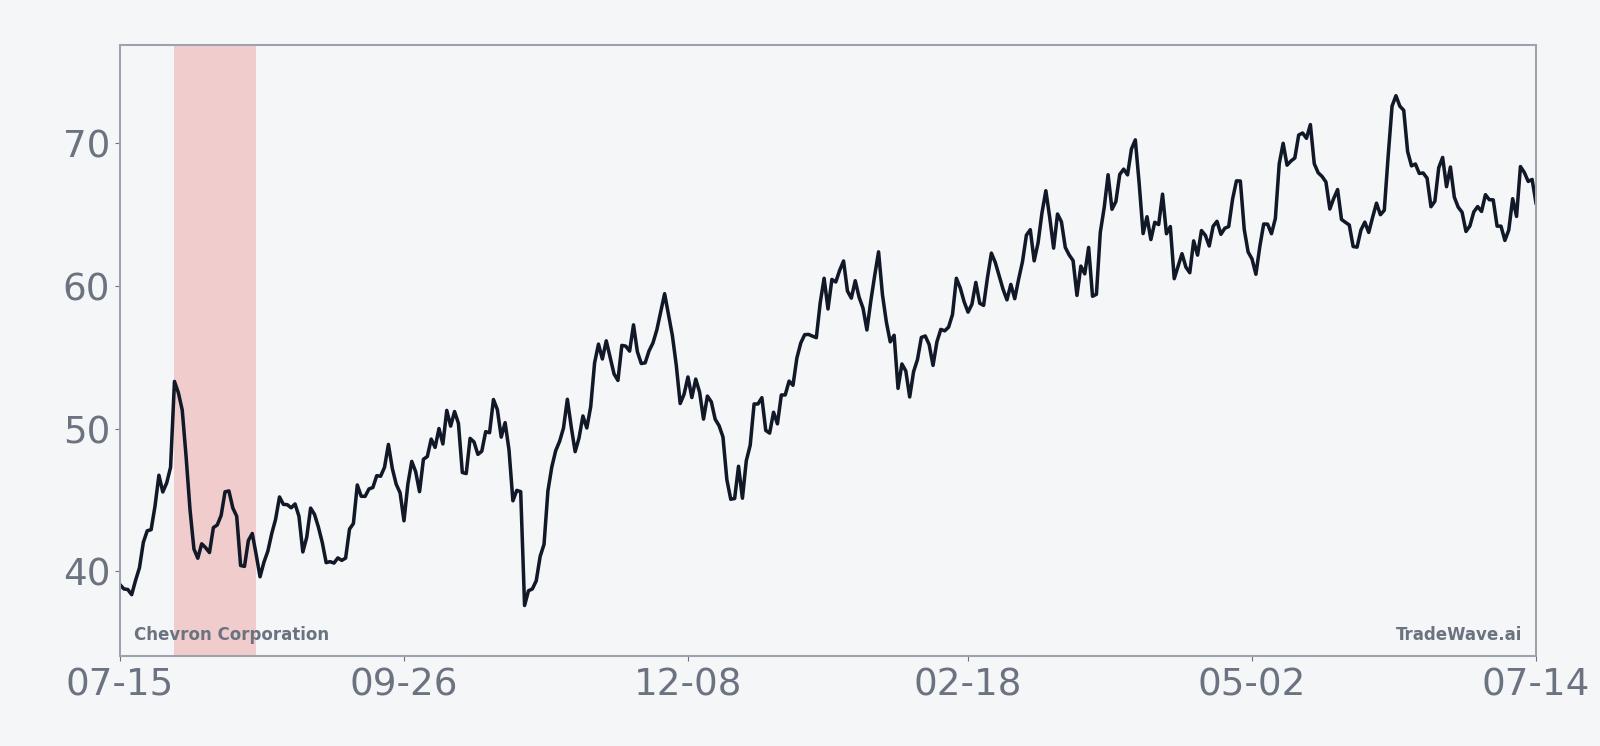
The average seasonal path in the trend chart tilts lower fairly steadily rather than collapsing all at once, suggesting that in many years the pressure has built over the full 22-day stretch instead of a single headline-driven break. The cumulative return line for the pattern window climbs from zero to roughly 40% across the nine iterations, which is what you would expect from a 9-for-9 record with mid-single-digit average gains per short. Add it up: this has been a quietly powerful bearish Chevron Corporation seasonal pattern that has not yet produced a losing year in the lookback.
History does not guarantee future results; adverse excursions (MAE) can be large even in winning windows, so traders using this pattern still face meaningful risk.
Why does Chevron Corporation (CVX) follow this seasonal pattern?
One likely driver is the way oil majors often guide and update investors around midyear, which can trigger portfolio rebalancing and sector rotation just as this window opens. Analysts have also pointed to summer demand and refinery maintenance cycles that can shift expectations for margins and cash returns in late July and August, affecting integrated producers like Chevron. This pattern may reflect that mix of macro oil dynamics and institutional positioning rather than any single recurring headline.
What is driving Chevron Corporation (CVX) today?
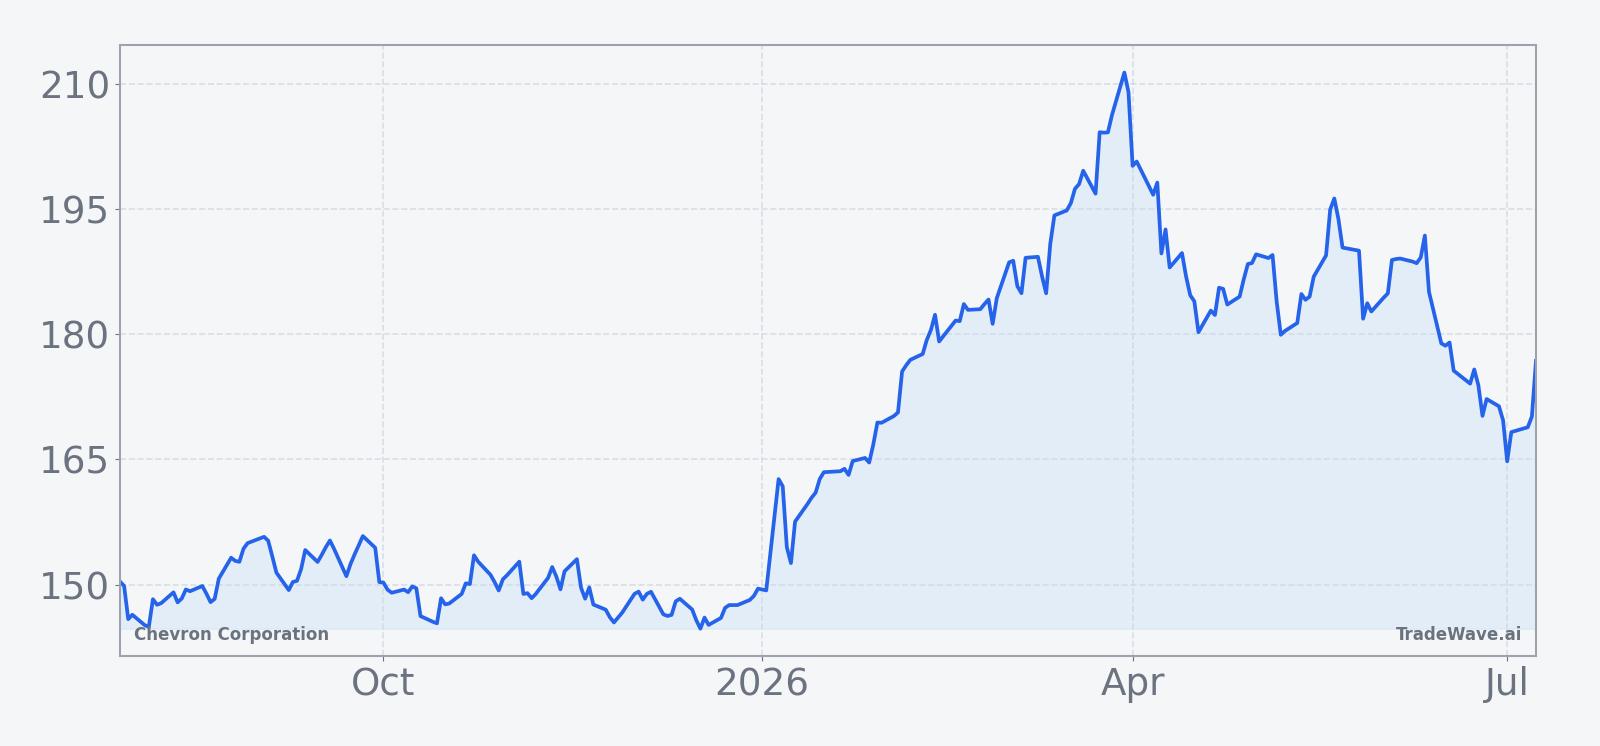
Chevron Corporation shares last closed at $174.05, down 1.1% on the day, leaving the stock about 17.5% below its 52-week high of $210.83 and roughly 28.9% above its 52-week low of $134.99. Trading volume of about 6.6 million shares came in below the 20-day average of roughly 10.2 million, suggesting a relatively calm session in price terms even as the stock has slipped about 7.01% over the past month.
In May 2026, Chevron reported first-quarter adjusted earnings of $1.41 per share, well ahead of the $0.95 consensus, as upstream earnings reached $3.9 billion while the downstream business swung to a loss of $817 million largely due to timing effects.[3] Management paired those results with higher free cash flow guidance for 2026 of $12.5 billion, reiterated a full-year share repurchase range of $10 billion to $20 billion and targeted up to $3 billion in cost cuts by the end of next year, reinforcing the company’s capital return story even as refining margins proved volatile.[3]
Earlier, in Aug 2025, Chevron posted adjusted second-quarter earnings of $1.77 per share versus a $1.70 LSEG consensus and reported record production of 3.4 million barrels of oil equivalent per day, helped by lower capital spending and the closing of its roughly $55 billion Hess acquisition that added prized Guyana assets.[1][2] In Jan 2026, the company followed up with a quarterly production record of 4.05 million barrels per day and highlighted the potential to ramp Venezuelan output by 50% over 18 to 24 months under a special U.S. license, though executives and analysts stressed that timelines and political risk in Venezuela remain uncertain.[4][6]
Sector context matters for this CVX seasonal trend. Chevron sits among the largest U.S. oil majors, with growth driven by Permian and global assets and a bigger footprint after the Hess deal, and it has benefited from elevated crude prices tied to geopolitical tensions such as conflict involving Iran that supported upstream results in early 2026.[1][3] At the same time, Chevron is the only U.S. major operating in Venezuela, where U.S. military intervention and political change have created both opportunity and uncertainty, leaving investors to handicap how much of that optionality should be reflected in the stock before concrete production gains arrive.[6]
The chart below situates the latest move in its recent multi-month context and overlays a 60-day seasonal projection around the upcoming late-July window.
What should traders watch in this Chevron Corporation (CVX) window?
The key test for this CVX seasonal pattern will be how the stock behaves as Jul 29 approaches and the 22-day window actually opens. Historically, the typical path has been a steady grind lower rather than a single air pocket, so traders watching this Chevron Corporation seasonal trend will be focused on whether rallies toward the 50-day moving average near $182.11 fade or break through with conviction.
On the fundamental side, any updates on Chevron’s Venezuela operations, including license terms or production ramp details, could challenge or reinforce the historical pattern if they shift the market’s view of long-dated cash flows.[4][6] Oil price swings tied to geopolitical risk, particularly in the Middle East, will also matter because they feed directly into upstream earnings power and can overwhelm quieter seasonal forces in a single headline.[3]
Inside the window, behavior that would confirm the historical seasonality includes a series of lower highs and persistent selling on strength, even without a major news shock. A sharp break higher that holds above recent resistance, by contrast, would mark the first clear violation of a 9-for-9 short-side record and signal that the CVX seasonal trend may be evolving. For traders who track stock pattern analysis and energy-sector seasonal outlooks, this late-July Chevron Corporation trading window is one of the more statistically clean setups on the calendar, but it still has to earn its keep in real time.
Sources
- Reuters: Chevron beats Wall Street profit estimates with record output (Aug 01, 2025)
- Reuters: Chevron beats Wall Street profit estimates with record production (Aug 01, 2025)
- Reuters: Chevron's upstream strength lifts first-quarter earnings past estimate (May 01, 2026)
- CNBC: Chevron earnings beat as production hits record with upside expected in Venezuela (Jan 30, 2026)
About this seasonal analysis
Seasonal pattern data is sourced from TradeWave.ai, which analyzes historical price behavior across annual calendar windows going back up to 30 years. Read the full data methodology or the book The 100-Year Pattern by Afshin Moshrefi (2026 edition). Past performance of seasonal patterns does not guarantee future results. This article is for informational purposes only and does not constitute investment advice.