Dealer Strategy and Custom Touring Demand Lift Harley-Davidson (HOG) as Bullish Window Nears
Harley-Davidson is heading toward a historically strong 118-day midterm-election-year trading window even as the stock trades well below its 52-week high.
Price as of Jul 8, 2026: $25.36 (last close).

What is the seasonal pattern for Harley-Davidson (HOG)?
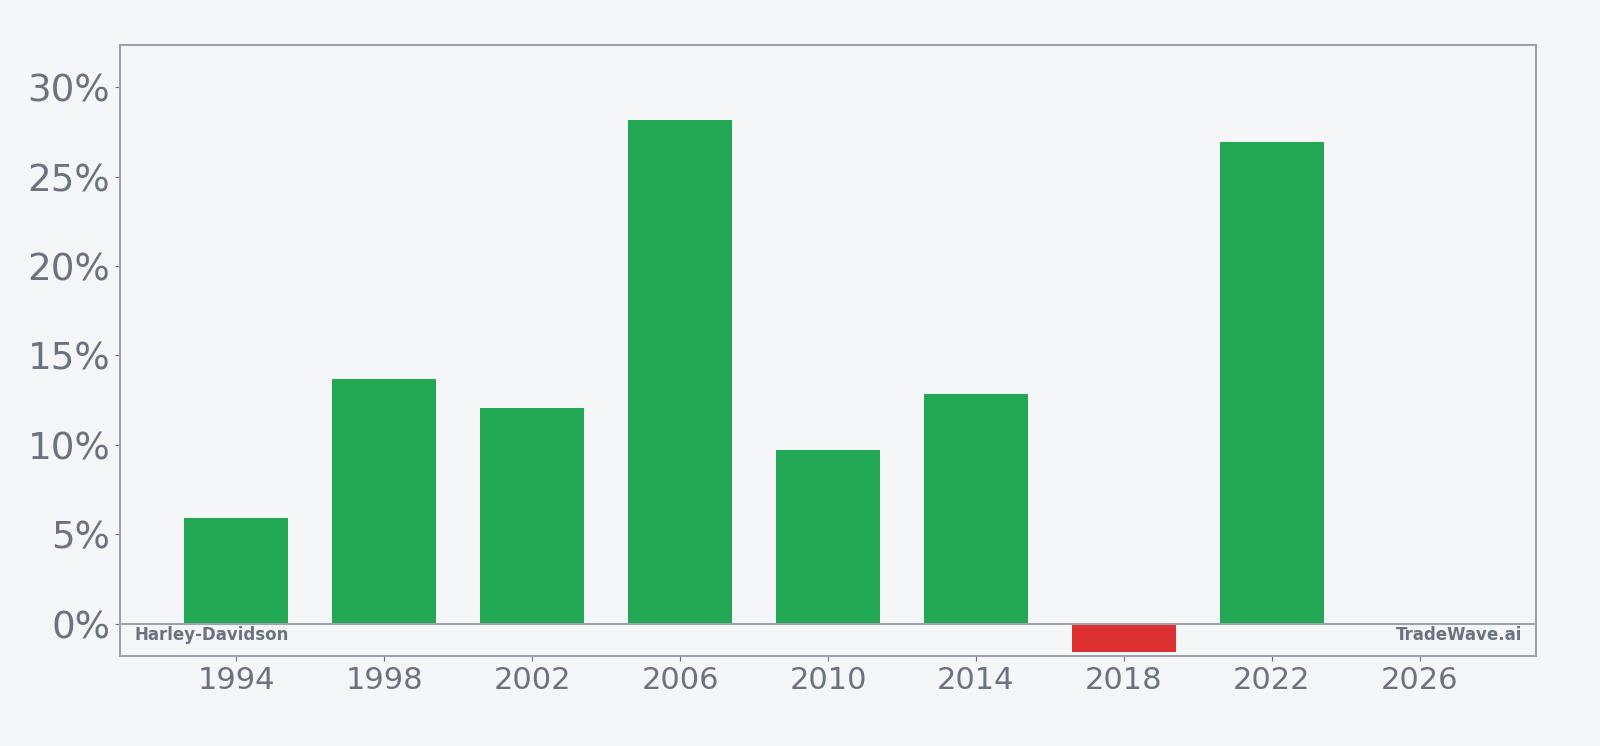
Harley-Davidson has risen in 7 of 8 midterm-election-year windows starting around early August, with an average gain of 15.62% in winning years.
- 7 wins and 1 loss in this 118-day midterm-year window, with winning years averaging 15.62% gains.
- The window begins on Aug 5 and runs for 118 calendar days across the last 8 midterm election years.
- Percent Profitable is 88%, with 7 winners and 1 loser across the historical sample.
- Including all years, the average outcome is a 13% gain, reflecting only one modest down year at -1.6%.
- Intraperiod swings have been meaningful, with several years showing double-digit drawdowns before finishing higher.
- The pattern is long-directional, aligning with a historically bullish Harley-Davidson seasonal trend in midterm years.
According to historical data from TradeWave.ai, Harley-Davidson’s performance in midterm election years shows a distinct seasonal bias that clusters around late summer and autumn.
How has Harley-Davidson (HOG) traded in past midterm-year windows?
Harley-Davidson has posted gains in 7 of the last 8 midterm-election-year windows that start around Aug 5 and run for 118 calendar days, a notably strong seasonal trend for a cyclical stock. Shares finished the latest session at $25.36, leaving the stock about 14.5% below its 52-week high of roughly $29.65 and well above its 52-week low near $16.83.
Grouping the data by the presidential election cycle matters here because Harley-Davidson is a U.S.-centric industrial name that tends to feel shifts in tariffs, consumer confidence and credit conditions that often change around midterm years. The current calendar phase is a midterm election year, and this 118-day window sits in the mid part of that year, when policy noise and spending patterns can diverge from a typical calendar-year average.
Across the last eight midterm-election-year instances, the long-direction pattern has been clearly bullish. Percent Profitable sits at 88%, with 7 winners and just 1 loser, and the all-years average outcome is a 13% gain over the 118 calendar days. Winning years have been meaningfully positive, with an average profit of 15.62%, while the lone losing year in 2018 saw only a -1.6% decline from entry to exit.
The per-year breakdown shows how this Harley-Davidson trading window has behaved in different macro backdrops. In 2006 the stock gained 28.16% during the window, with a maximum favorable move of 31.81% and only a -4.14% worst drawdown from entry. In 2022 the pattern delivered a 26.96% net gain, with the stock’s best intraperiod run-up reaching 31.24% and the worst pullback limited to -8.39%.
Even the softer positive years have been constructive for longs. In 1994 Harley-Davidson returned 5.88% over the window, with a 15.91% peak run-up and a -2.86% worst drawdown. In 2010 the stock gained 9.72%, but that came with a -17.3% adverse excursion at one point, underscoring that investors have often had to sit through sizable volatility before the seasonal tailwind showed up in the final result.
The one losing year, 2018, is a reminder that a strong seasonal pattern does not mean a straight line. That window finished down -1.6%, with a maximum favorable move of 7.54% and a maximum adverse move of -16.79% from the entry price. For a long-direction setup, that profile meant the stock never fully converted its early strength into a positive close and spent part of the window under real pressure.
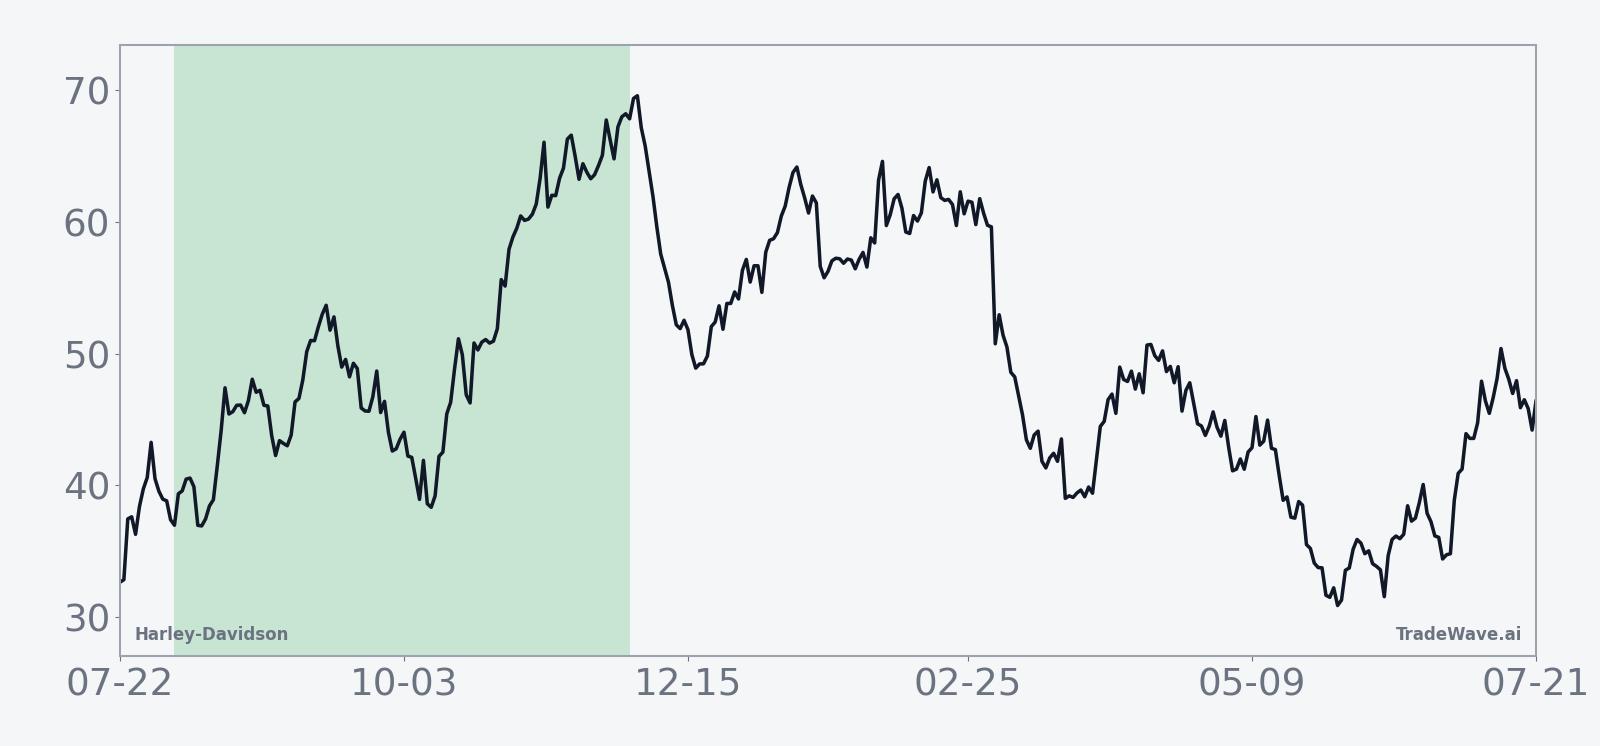
The historical seasonal average trend line slopes higher through most of the 118-day stretch, with gains tending to build rather than spike and fade. The pattern suggests that in prior midterm years, Harley-Davidson has often seen strength emerge and then compound over the course of the window instead of delivering a single front-loaded pop.
A closer look at yearly net returns alongside peak rallies and worst drawdowns shows how that upside has coexisted with meaningful volatility.
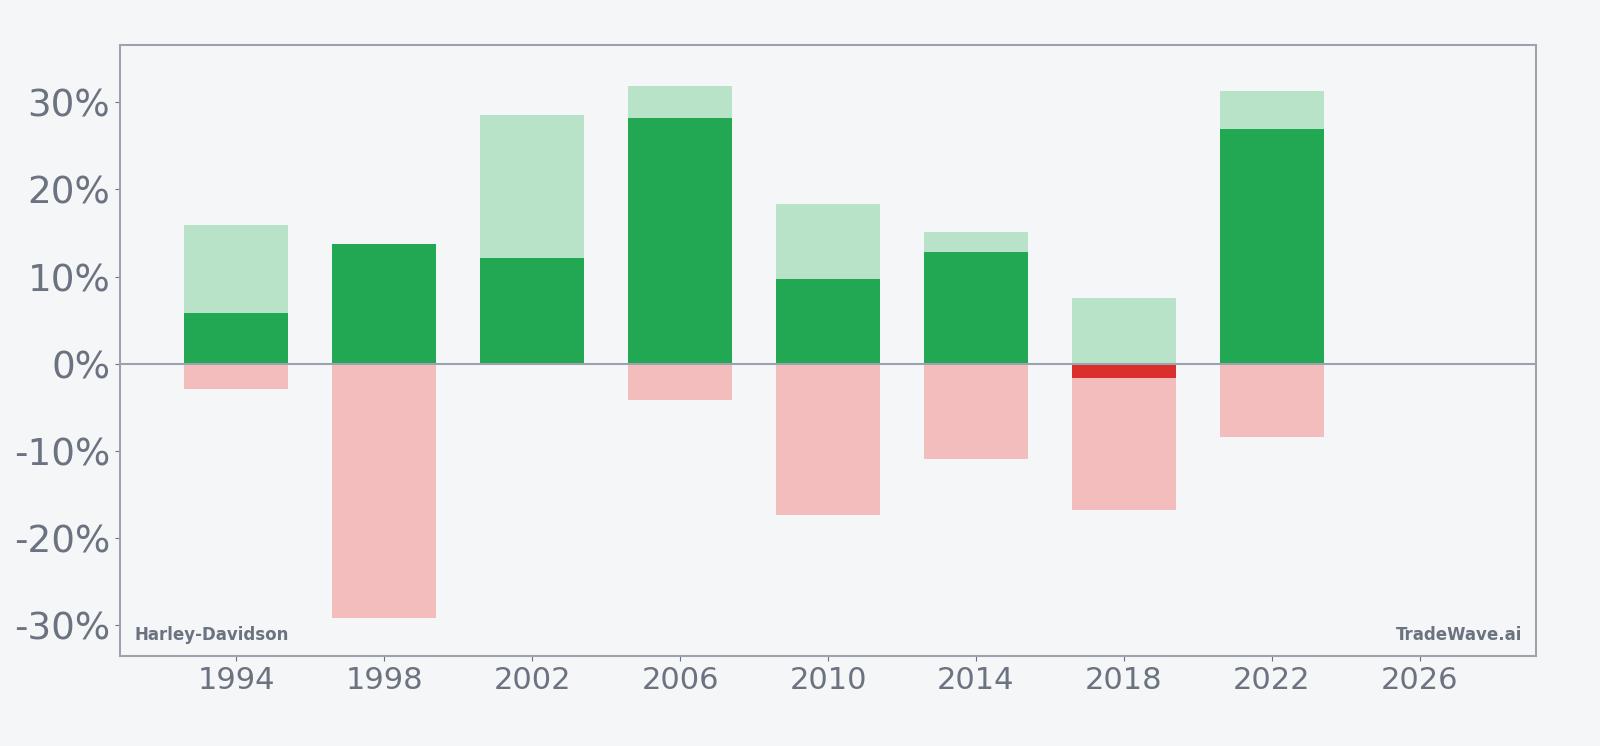
The combined net/MFE/MAE view shows that upside potential has often been larger than the final net result, with several years posting 15% to 30% peak rallies inside the window. At the same time, adverse excursions have at times reached the mid-teens, which means even winning years have not been low-volatility rides for Harley-Davidson holders.
History does not guarantee future results; adverse excursions (MAE) can be large even in winning windows.
Why does Harley-Davidson (HOG) follow this seasonal pattern?
One likely driver is the way Harley-Davidson’s demand and financing cycles line up with late-summer and autumn riding seasons, when dealers clear inventory and consumers often make big-ticket purchases. Analysts have also pointed to the clustering of earnings reports and strategy updates in this part of the year, which can reset expectations and unlock re-rating moves in midterm election years when policy and tariff headlines are active.[5] The pattern may also reflect institutional portfolio repositioning around industrial and consumer-discretionary names as investors adjust to the evolving policy backdrop in the middle of the presidential cycle.
What is driving Harley-Davidson (HOG) today?
Harley-Davidson closed the latest session at $25.36, down 2.0% on the day, with roughly 1.77 million shares changing hands against a 20-day average volume of about 3.07 million. The stock sits well above its 50-day moving average near $24.39 but remains about 14.5% below its 52-week high and roughly 50.7% above its 52-week low, a wide band that captures the volatility of the past year.
Fundamentally, the company is still working through the fallout from tariffs and a strategic reset. In July 2025 Harley-Davidson disclosed that U.S. and related tariffs had imposed material costs, contributing to a second-quarter profit miss and a decision to withhold annual guidance as management reassessed the outlook.[1] In the same period the company sold a loan portfolio valued at more than $5 billion to KKR and PIMCO, a move that generated about $1.25 billion in cash and reduced debt by roughly $450 million, giving the balance sheet more flexibility even as operating headwinds persisted.[1]
Later in 2025, Harley-Davidson’s third-quarter report showed that the franchise could still deliver when product and pricing lined up. The company reported profit of $377 million, or $3.10 per share, with revenue up about 23% to $1.07 billion, helped by robust demand for high-margin custom touring models and the launch of a smaller “Sprint” bike aimed at entry-level riders.[3] That mix shift toward more affordable models and profitable touring bikes has become a central plank of the turnaround story.
By May 2026, new CEO Artie Starrs was leaning into that strategy, outlining a plan focused on lower-priced motorcycles, the dealer network and the parts and accessories business to support volumes and margins.[5] In the same update, Harley-Davidson reported first-quarter 2026 net income of $25 million, or $0.22 per share, on revenue of about $1.2 billion, down roughly 12%, and flagged that tariff-related costs had reached $45 million in the quarter.[5] Those numbers underscored how much of the investment case still hinges on execution in a tough macro and policy environment.
The chart below situates the latest move in its recent multi-month context and overlays a short-term seasonal projection.
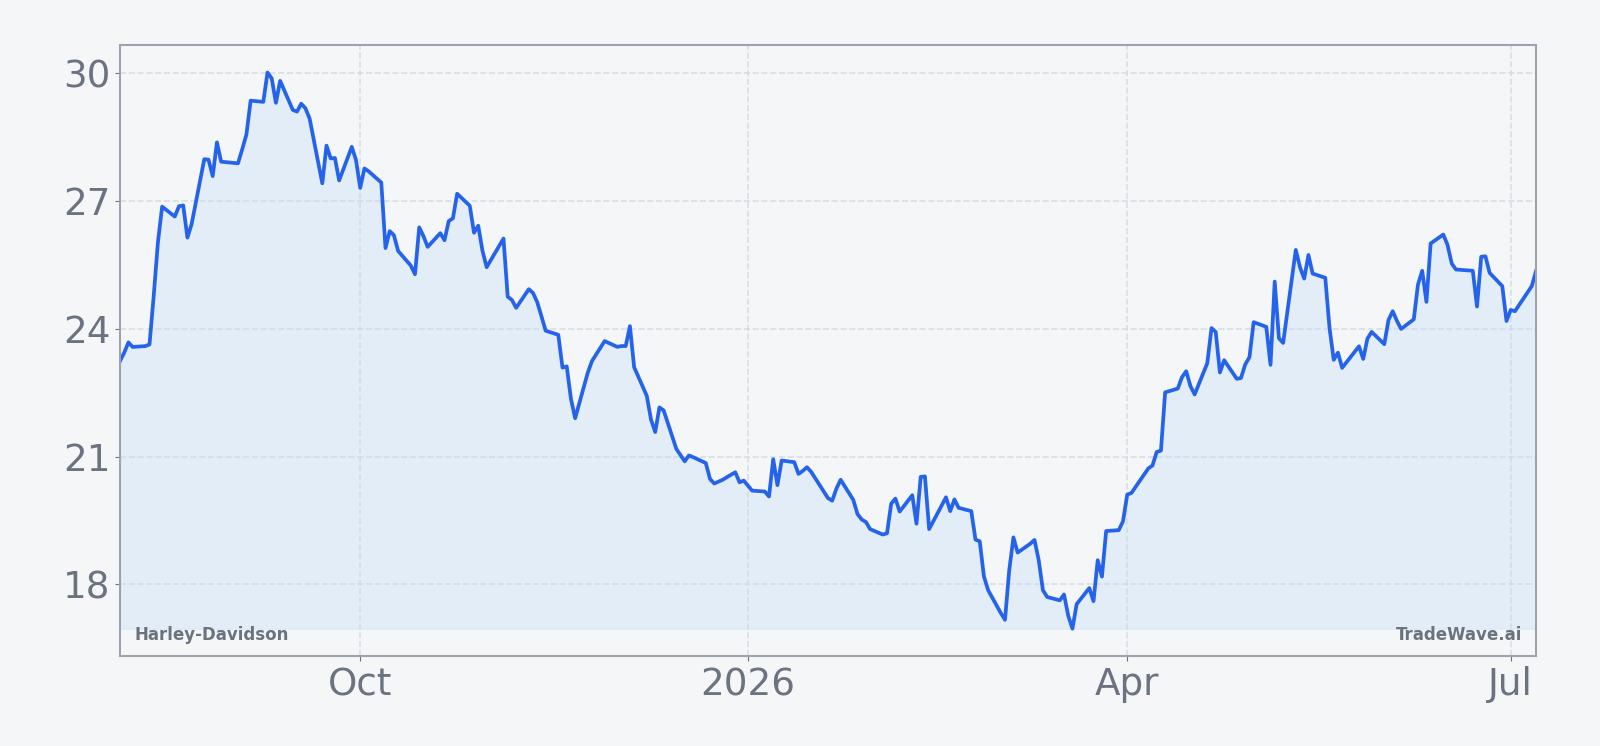
Sector-wide, the motorcycle and broader automotive complex has been dealing with slowing demand among entry-level buyers and guidance withdrawals across peers as tariff uncertainty and higher financing costs weigh on big-ticket purchases.[2] For Harley-Davidson, that backdrop makes the upcoming seasonal window more relevant, because historical midterm-year strength has often coincided with periods when the macro narrative looked challenging but the stock still managed to grind higher.
What should traders watch in this Harley-Davidson seasonal window?
The next iteration of this 118-day window begins on Aug 5, so the key watchpoint is how Harley-Davidson trades as that date approaches and once the window is underway. On the calendar side, investors will be tracking any fresh tariff or trade headlines, as well as the company’s next earnings update, for signs that the strategy around affordable models and dealer-led growth is gaining traction in a midterm-year policy environment.[5]
On the tape, the 50-day moving average near $24.39 and the 52-week high around $29.65 are natural reference levels. Historically, strong years in this window have seen the stock build on early strength and push to new highs, while the weaker 2018 pattern featured a mid-window drawdown that never fully recovered by the end of the period. If Harley-Davidson can hold above its recent support zone and show constructive volume as the window opens, that would be more consistent with the seven winning cycles than with the lone losing one.
Finally, traders should monitor intraperiod volatility as the window progresses. Past midterm-year cycles have delivered double-digit maximum favorable moves but also mid-teens adverse excursions, so sharp pullbacks inside an otherwise positive trend have been part of the historical playbook. If this year’s window again features strong rallies that survive those drawdowns, it would fit the established Harley-Davidson seasonal trend; if instead the stock breaks down and fails to recover, it would mark only the second clear miss for this pattern in the last eight midterm election years.
Sources
- Reuters: Harley-Davidson sells $5 bln loan portfolio; tariff headwinds persist (Jul 30, 2025)
- Reuters: Harley-Davidson misses second-quarter profit estimates as tariffs weigh (Jul 30, 2025)
- Reuters: Harley-Davidson's third-quarter profit rises (Nov 4, 2025)
- Reuters: Harley-Davidson bets on affordable models, dealer network in latest turnaround effort (May 5, 2026)
About this seasonal analysis
Seasonal pattern data is sourced from TradeWave.ai, which analyzes historical price behavior across annual calendar windows going back up to 30 years. Read the full data methodology or the book The 100-Year Pattern by Afshin Moshrefi (2026 edition). Past performance of seasonal patterns does not guarantee future results. This article is for informational purposes only and does not constitute investment advice.