Amazon (AMZN) Has Rallied in 6 of 6 Late-July Midterm Windows, Averaging 5.32% Gains
Amazon is approaching a late-July trading window that has never been negative in past midterm election years, with the stock still about 12.5% below its 52-week high.
Price as of Jul 8, 2026: $243.62 (last close).

What is the seasonal pattern for Amazon (AMZN)?
Amazon has risen in 6 of 6 midterm-year late-July windows during this 17-day stretch, with an average gain of 5.32% in winning years.
- 6 for 6 in this window, with Amazon averaging 5.32% gains in winning years across the last six midterm election cycles.
- The upcoming 17-day window starts Jul 31, 2026 and has historically favored long positions in AMZN during midterm election years.
- Percent Profitable is 100%, with 6 winners and 0 losers in the historical sample.
- Median profit in the window is 5.57%, pointing to a fairly consistent upside skew rather than one or two outlier years.
- The TradeWave Ratio of 3.23 suggests price has typically traveled meaningfully in the trade direction within the window, not just at the close.
- Even in winning years, adverse moves inside the window have at times been sharp, so traders have had to sit through drawdowns before gains materialized.
According to historical data from TradeWave.ai, this late-July stretch has behaved very differently from an average month on the calendar for Amazon. The next section walks through how that pattern has played out across past midterm election years and what it means for the upcoming window.
How has Amazon (AMZN) traded in the late-July midterm-year window?
Amazon has risen in all six midterm election years during this late-July 17-day window, averaging 5.32% gains with a 5.57% median profit. The next iteration of that window begins on Jul 31, 2026, with shares last changing hands at 243.62, about 12.5% below the 52-week high of 278.56 and roughly 24.3% above the 52-week low of 196.00. That combination of a clean historical win streak and a stock trading well off its recent peak is what makes this specific Amazon trading window stand out on the calendar.
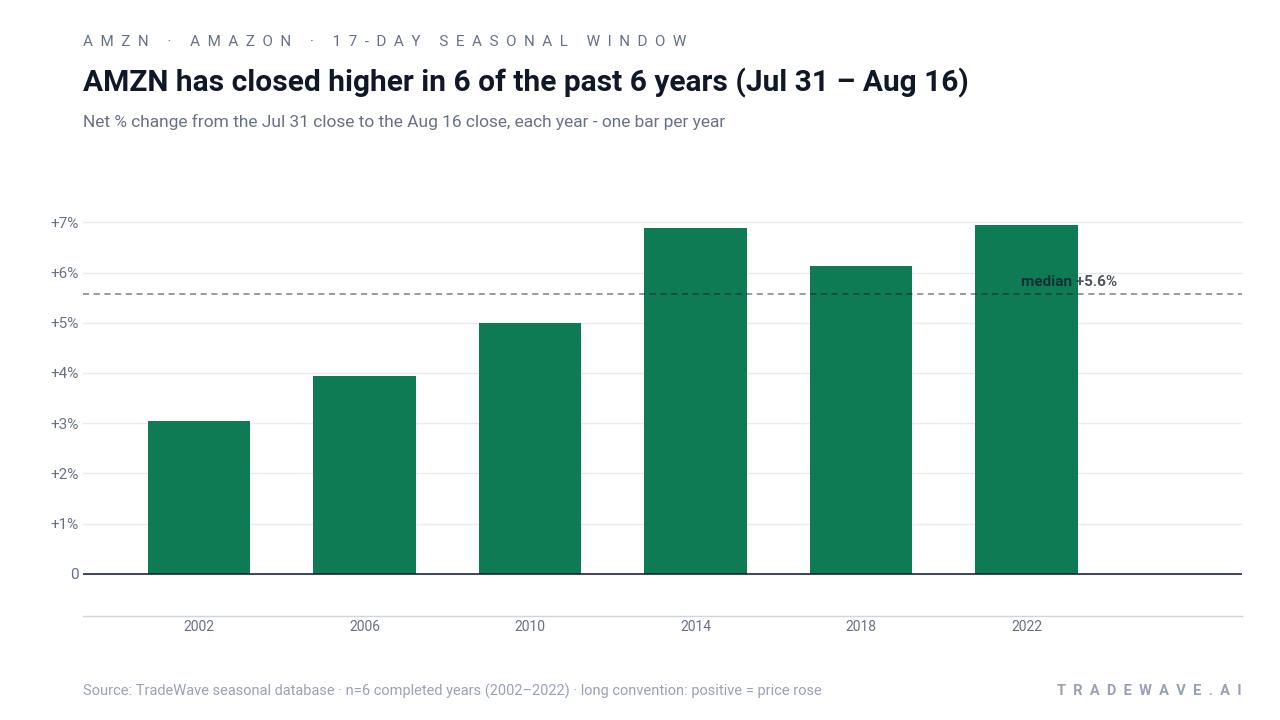
Grouping the data by the presidential election cycle matters here because Amazon’s strongest late-July behavior has clustered specifically in midterm election years, not across random calendar years. Policy uncertainty, shifting fiscal priorities and positioning ahead of the historically stronger pre-election year often change how mega-cap tech trades in the back half of the midterm year, and this window sits right in that transition zone.
The trade direction for this pattern is explicitly long, and every one of the six historical windows has finished in positive territory. Average profit of 5.32% and a 36% cumulative return across the sample show that the gains have not been marginal. The median outcome of 5.57% is close to the average, which suggests the window has delivered fairly steady upside rather than relying on a single blockbuster year.
Looking at individual years, 2022 stands out as one of the stronger examples, with a 6.94% net return and a maximum favorable move of 8.26% from the entry price. On the softer side, 2002 still finished higher by 3.04% but saw a maximum adverse move of -11.62% inside the window, a reminder that even “all green” patterns can involve uncomfortable drawdowns before they resolve higher.
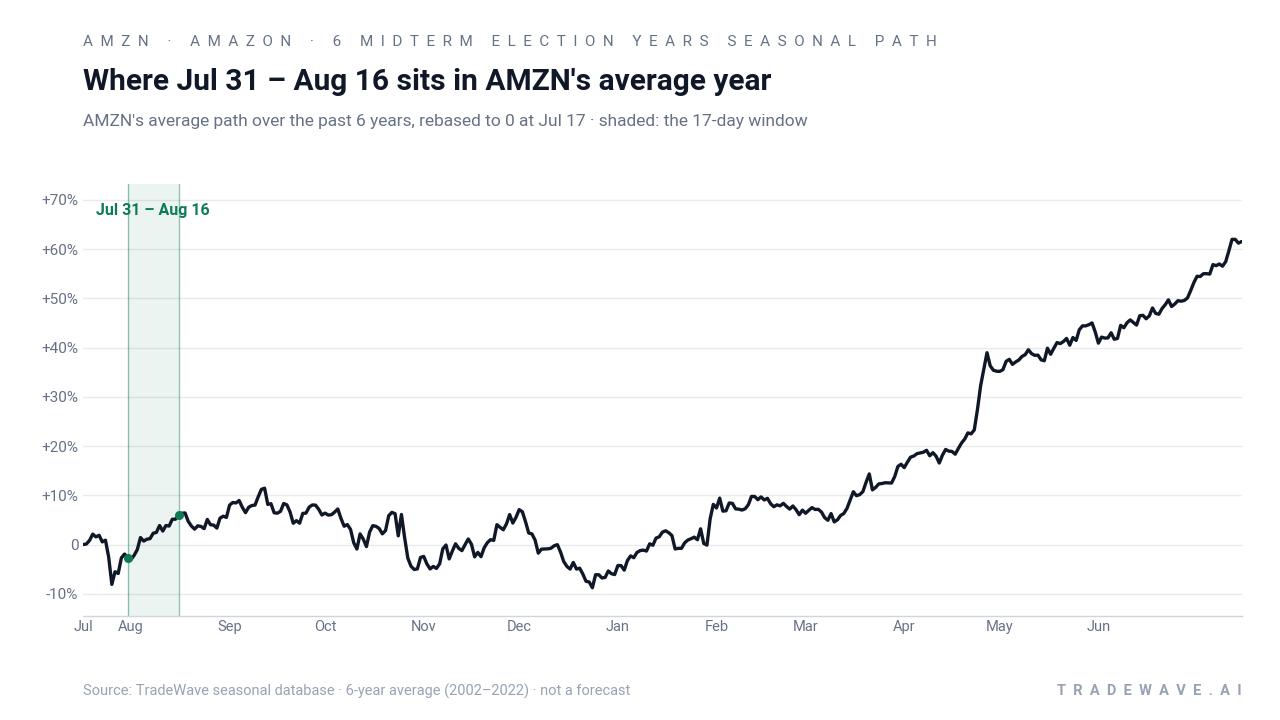
The historical seasonal trend line for this window slopes higher in a relatively steady fashion, with much of the average gain accruing across the middle of the 17-day span rather than in a single burst at the start or end. That profile suggests a tendency for Amazon to grind higher through this stretch in midterm years, even when the broader tape is choppy.
Year-by-year bars that include both peak rallies and worst drawdowns show how much room the stock has historically had to move inside the window.
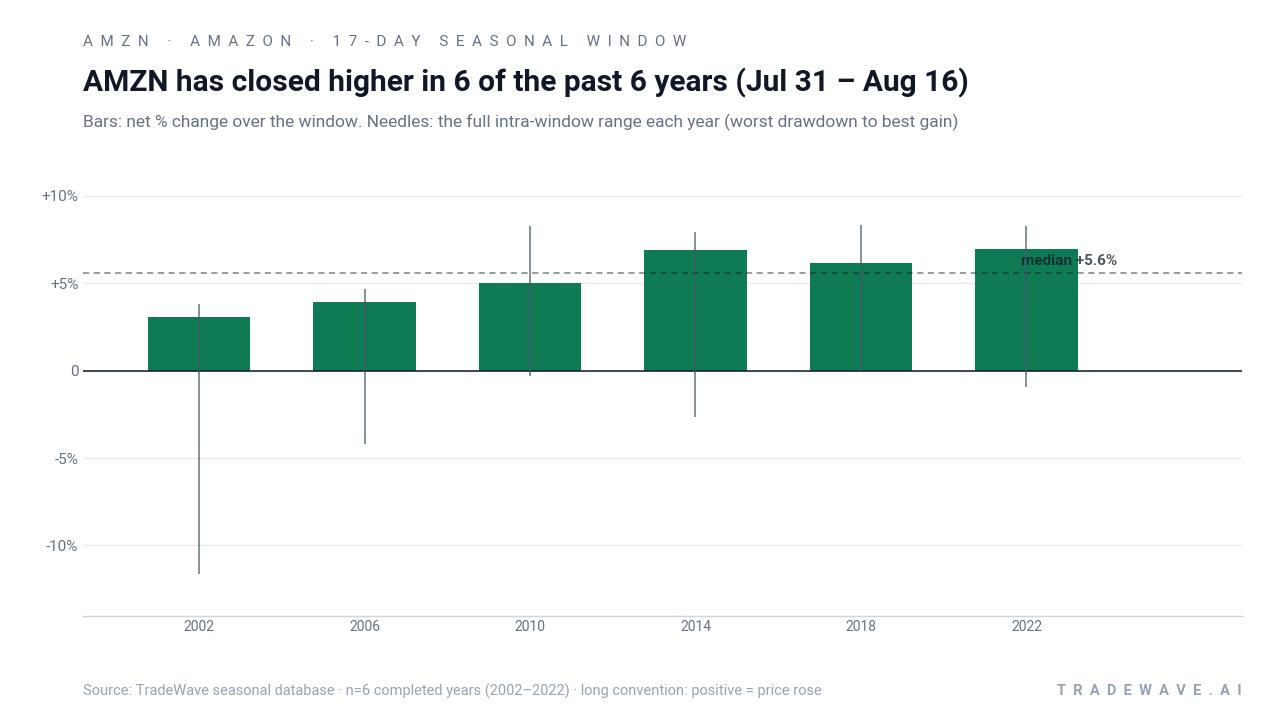
The stacked net, MFE and MAE bars underline that upside potential has often been larger than the final net gain, with several years showing 7% to 8% peak rallies inside the window. At the same time, adverse excursions have occasionally been deep, particularly in 2002, which saw an intraperiod drawdown of -11.62% before finishing higher. Add it up: six straight winning windows, solid average gains and a history of sizable swings both ways inside the 17-day span.
History does not guarantee future results; adverse excursions (MAE) can be large even in winning windows.
Why does Amazon (AMZN) follow this seasonal pattern?
One likely driver is the way Amazon’s earnings calendar and guidance cadence line up with the midterm election year, with late-July often sitting between Q2 guidance updates and investor positioning for the stronger pre-election year. Analysts have pointed to institutional portfolio rebalancing around mega-cap tech and cloud leaders as fiscal and regulatory signals evolve, which can concentrate flows into names like Amazon during this stretch. The pattern may also reflect sector rotation into growth and AI-linked cloud exposure as investors look past midterm uncertainty toward the historically more supportive pre-election year backdrop.
What is driving Amazon (AMZN) today?
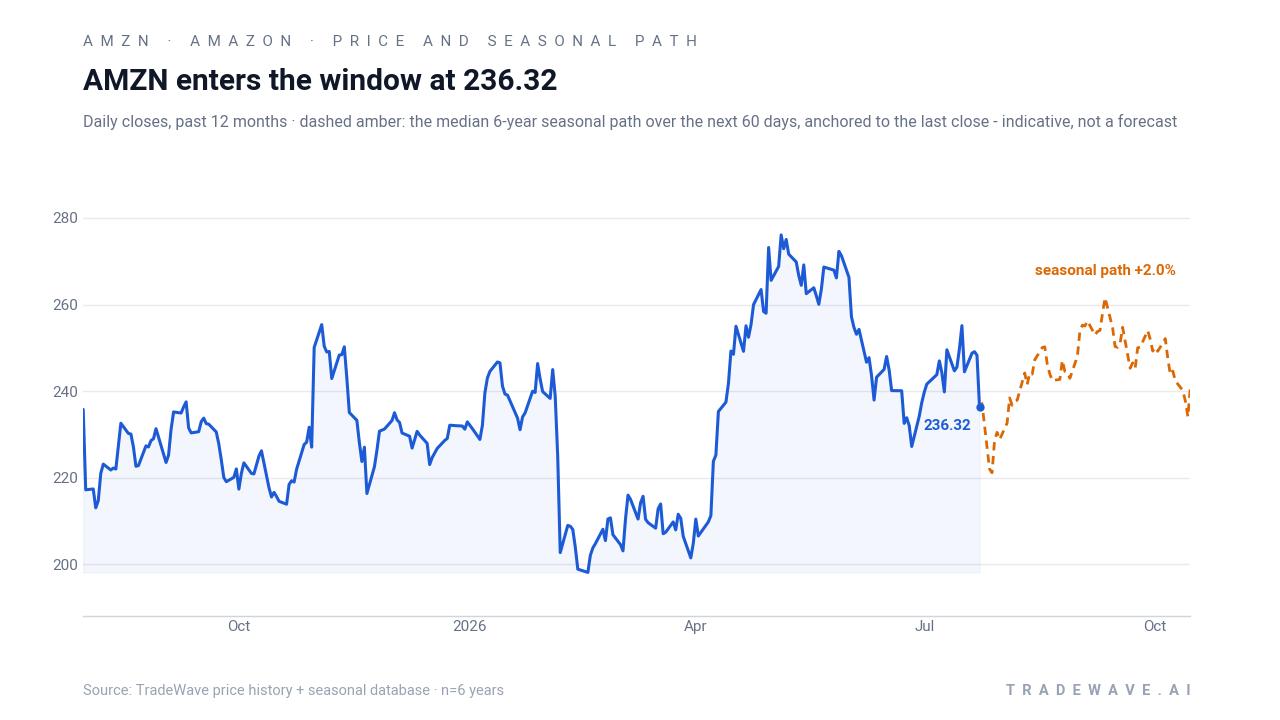
Amazon closed Thursday at 243.62, down 0.96% on the day, leaving the stock about 12.5% below its 52-week high of 278.56 and roughly 24.3% above its 52-week low of 196.00. The shares are trading below their 50-day moving average of 254.60 on lighter-than-average volume compared with the 20-day average of about 62.6 million shares, a sign that the recent drift has been more about digestion than a rush for the exits.
In April 2026, Amazon reported Q1 revenue of $181.5 billion and EPS of $2.78, beating analyst expectations on both metrics, with AWS revenue of $37.6 billion and ex-currency growth of 28% that topped forecasts.[1] Management guided Q2 revenue to a range of $194 billion to $199 billion, implying 16% to 19% growth, while flagging that higher AI-related capex would weigh on free cash flow even as cloud and advertising margins improved.[1][4] That mix of strong top-line growth and heavier investment has kept the stock in a tug-of-war between investors focused on near-term cash generation and those leaning into the longer-term AI and cloud story.
In August 2025, Reuters highlighted how Amazon shares slumped after a period when cloud computing growth underwhelmed some investors, underscoring how sensitive the stock can be to even small shifts in AWS momentum.[5] In October 2025, Business Insider and CNBC coverage around Q3 earnings expectations and a UBS target hike framed Amazon as a laggard within the “Magnificent 7,” with the bull case hinging on a re-acceleration in AWS and AI monetization.[2][3] Those debates around cloud growth, AI infrastructure spending and advertising leverage remain central to how traders interpret each new data point heading into the back half of the midterm election year.
The chart below situates the latest move in its recent multi-month context and overlays the upcoming seasonal projection.
What should traders watch as the late-July window approaches?
First, the calendar: the 17-day window starting Jul 31 lands in the mid part of the midterm election year and leads directly into the historically stronger pre-election year, a phase that has often been friendlier to risk assets. Traders will be watching whether Amazon’s price can reclaim the 50-day moving average near 254.60 ahead of the window, or whether it enters the stretch still under that short-term trend line, which would frame any seasonal strength as a potential mean-reversion move rather than a continuation of an existing uptrend.
Second, earnings and guidance tone around AWS and AI capex will matter for how the seasonal pattern interacts with fundamentals. The April 2026 report showed that strong cloud and advertising growth can coexist with heavier investment, and any follow-on commentary about the pace of AI infrastructure spending versus free cash flow could influence how aggressively investors lean into the historical late-July strength.[1][4] If the stock responds positively to incremental cloud or advertising data into the window, that would rhyme with prior midterm-year episodes where Amazon climbed despite macro noise.
Third, watch volatility inside the window, not just the end result. Past years have seen maximum favorable moves in the 7% to 8% range and, in at least one case, a double-digit intraperiod drawdown before finishing higher. If Amazon starts to swing more sharply day to day as the window opens, that would be consistent with the historical pattern of sizable excursions in both directions before the final outcome is known.
Finally, because Amazon is a key weight in major indices and a bellwether for cloud and AI spending, any outsized move during this late-July stretch could ripple through broader tech and growth benchmarks. A repeat of the historical pattern, with the stock grinding higher through the window, would support the narrative that investors are willing to look past midterm-year policy noise toward the pre-election year. A clear break from that pattern, especially if accompanied by softer AWS commentary or a renewed focus on capex pressure, would be an early sign that this cycle is diverging from the last six midterm years.
Sources
- Yahoo Finance, "Amazon reports Q1 earnings that top analyst estimates amid artificial intelligence push" (Apr 29, 2026).
- Business Insider, "Amazon earnings on deck with focus on AI and AWS as the stock lags Mag 7" (Oct 30, 2025).
- CNBC, "UBS lifts Amazon price target ahead of e-commerce giant’s earnings" (Oct 28, 2025).
- Seeking Alpha, "Amazon blows past AWS estimates while AI investments dent free cash flow" (Apr 29, 2026).
- Reuters, "Amazon slumps after cloud computing growth underwhelms investors" (Aug 1, 2025).
About this seasonal analysis
Seasonal pattern data is sourced from TradeWave.ai, which analyzes historical price behavior across annual calendar windows going back up to 30 years. Read the full data methodology or the book The 100-Year Pattern by Afshin Moshrefi (2026 edition). Past performance of seasonal patterns does not guarantee future results. This article is for informational purposes only and does not constitute investment advice.