With Shorts Winning 6 of 7 Midterm Windows, Copart (CPRT) Faces Fresh Slide
Copart is heading toward a 76-day midterm-election-year stretch that has historically favored downside moves, just as the stock trades close to its 52-week low.
Price as of Jul 8, 2026: $28.59 (last close).

What is the seasonal pattern for Copart (CPRT)?
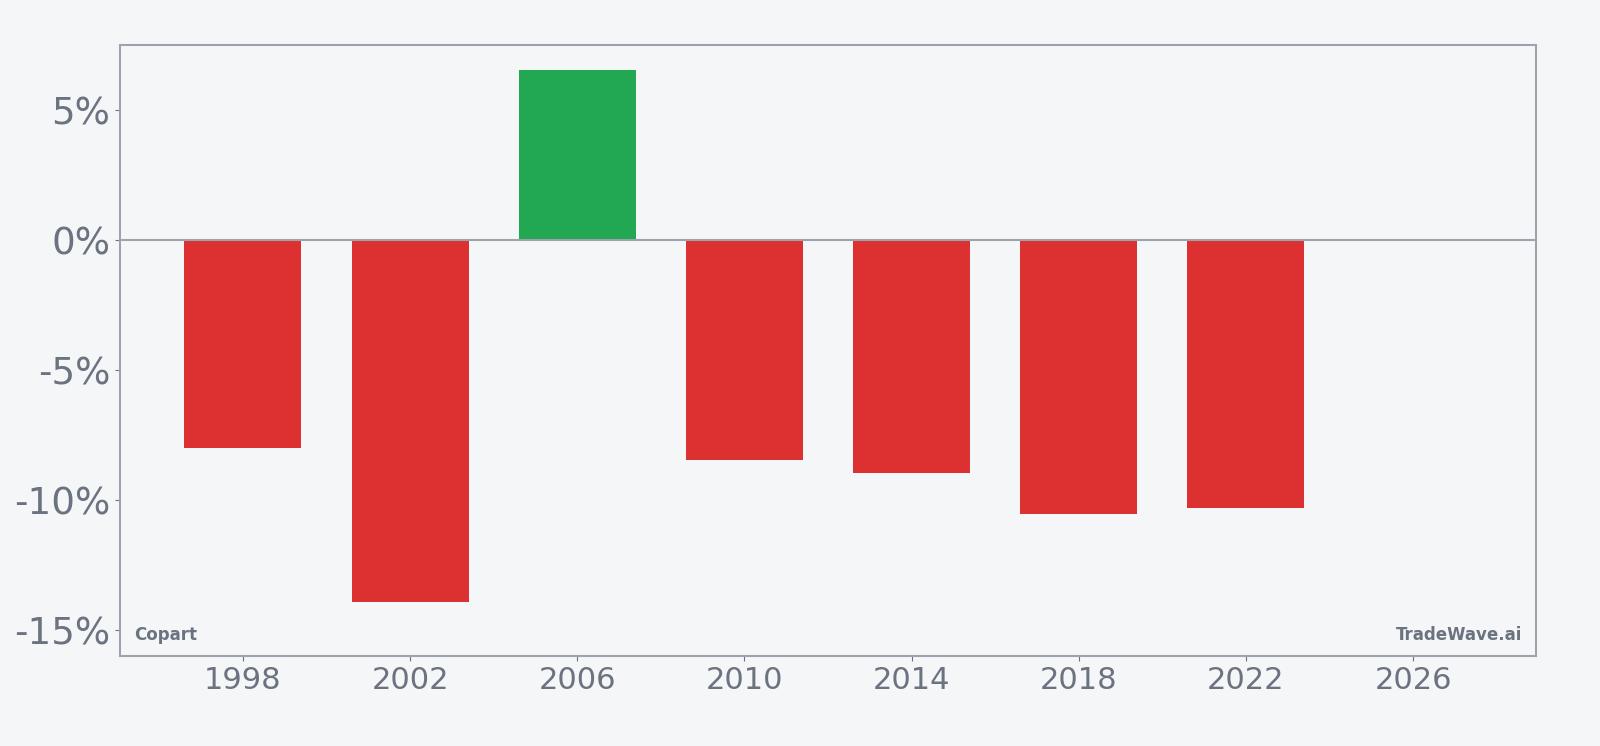
Copart has moved lower in 6 of 7 midterm-election-year windows during this 76-day stretch, with an average gain of 10.03% in winning years for the short side.
- 6-for-7 record in this window, with the short side averaging 10.03% gains in winning years.
- Seasonal window begins Jul 20, 2026 and runs for 76 calendar days across the last 7 midterm election years.
- Percent Profitable is 86%, with 6 winning years for shorts and just 1 losing year.
- Including all years, Avg Profit - All is 8%, reflecting one unfavorable squeeze against the short pattern.
- TradeWave Ratio of 1.54 suggests price has typically traveled meaningfully in the trade direction within the window.
- Historical drawdowns inside the window have been sizable at times, underscoring that even short-favored patterns can see sharp rallies before rolling over.
According to historical data from TradeWave.ai, this midterm-election-year stretch has behaved very differently from an average quarter for Copart, with a clear directional bias for short setups.
How has Copart (CPRT) traded in this midterm-year seasonal window?
Copart has moved in favor of the short side in 6 of the last 7 midterm-election-year windows for this 76-day stretch, with shorts posting an average 10.03% gain in winning years. The next iteration of that window begins on Jul 20, 2026, with the stock currently at 28.59, about 43.0% below its 52-week high of 50.11 and only about 2.7% above its 52-week low of 27.85. That combination of a historically short-friendly window and a stock already hugging the bottom of its one-year range gives this Copart trading window unusual tactical importance for both bulls and bears.
Grouping the data by the presidential election cycle matters here because this window only looks at the last 7 midterm election years, a phase that often brings policy uncertainty, regulatory noise and shifting expectations for infrastructure and auto-related spending. Copart sits in the crosshairs of those themes as a salvage and auction platform tied to vehicle volumes, insurance behavior and used-car pricing, all of which can react to mid-cycle macro and policy shifts.
Across those seven midterm-year samples, the short side has been favored in 6 cases, with only one year delivering a net loss for shorts by the end of the 76-day window. The 8% Avg Profit - All shows that even after including that losing year, the pattern has still leaned meaningfully in favor of downside outcomes for Copart during this slice of the calendar. For traders who track CPRT seasonal trends, that 86% Percent Profitable figure is unusually high for a single-stock short pattern.
The per-year table shows that the strongest short-friendly years include 2002, 2018 and 2022, each with double-digit net declines over the window. In 2002, for example, the short side captured a 13.92% net move as Copart weakened from an entry price of 0.79 to 0.68, while 2018 and 2022 both saw more than 10% net downside from higher absolute price levels. The lone losing year for shorts, 2006, delivered a 6.51% net gain for longs as the stock rose from 1.69 to 1.80 over the period.
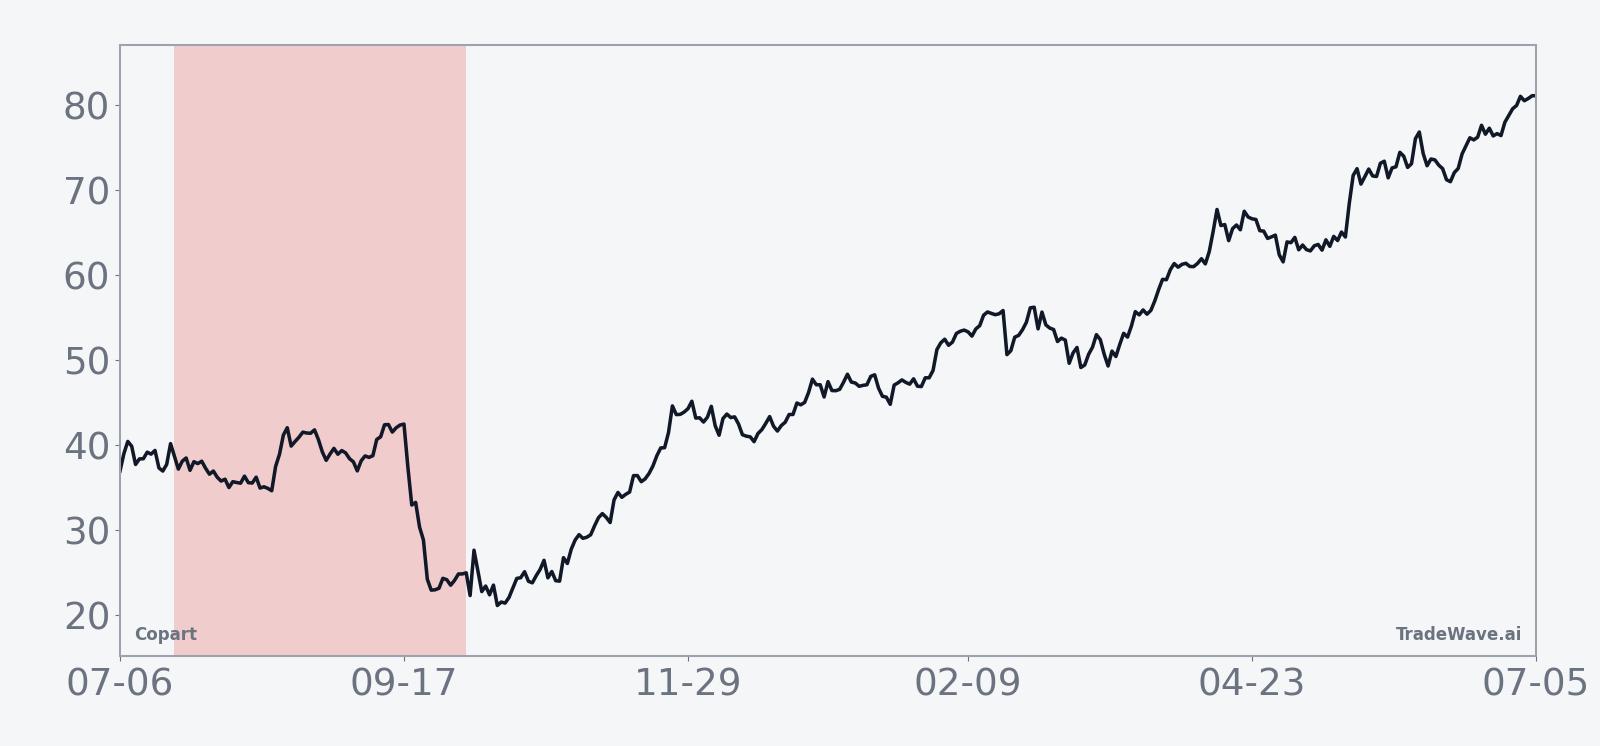
The historical seasonal average suggests that weakness for Copart in this window has tended to build gradually rather than collapse all at once. The trend line slopes modestly in favor of shorts across much of the 76 days, with only brief countertrend rallies. That profile fits a pattern where the stock drifts lower as the midterm-year macro and policy backdrop grinds on, instead of reacting to a single shock.
A combined view of net returns and intraperiod swings shows how far Copart has typically moved in both directions before the window closes.
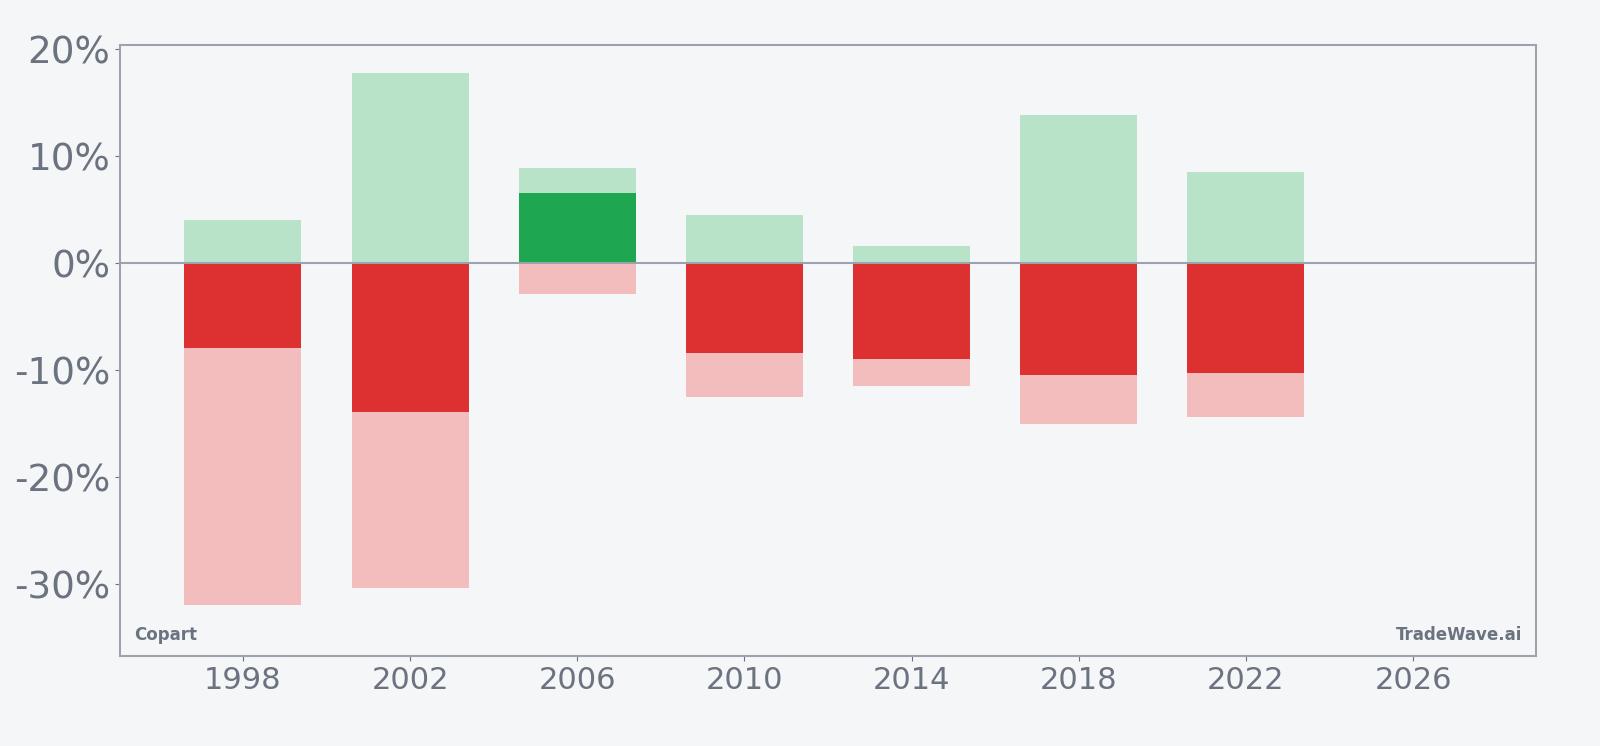
The bars with maximum favorable and adverse excursions show that even in winning years for shorts, Copart has often staged sizable rallies before rolling over. In 2002 and 2018, for instance, maximum favorable moves for shorts coincided with maximum adverse excursions that reached into the mid-teens, meaning the stock could swing 10% to 15% against the trade before ultimately finishing lower. That mix of strong TradeWave Ratio and chunky MAE underscores that this Copart trading window has historically rewarded patience and risk control more than quick, one-way bets.
History does not guarantee future results; adverse excursions (MAE) can be large even in winning windows.
Why does Copart (CPRT) follow this seasonal pattern?
One likely driver is the way midterm election years cluster regulatory and fiscal headlines that matter for autos, insurance and infrastructure, all of which touch Copart’s salvage and auction volumes. Analysts often point to midyear portfolio repositioning and sector rotation in this phase, as investors rebalance exposure to economically sensitive names ahead of the year before the presidential election, which has historically been more risk-on. This pattern may also reflect how insurers and fleet operators adjust claims, write-offs and auction activity around midyear, creating a recurring rhythm in Copart’s fundamentals that shows up in the stock pattern analysis.
What is driving Copart (CPRT) today?
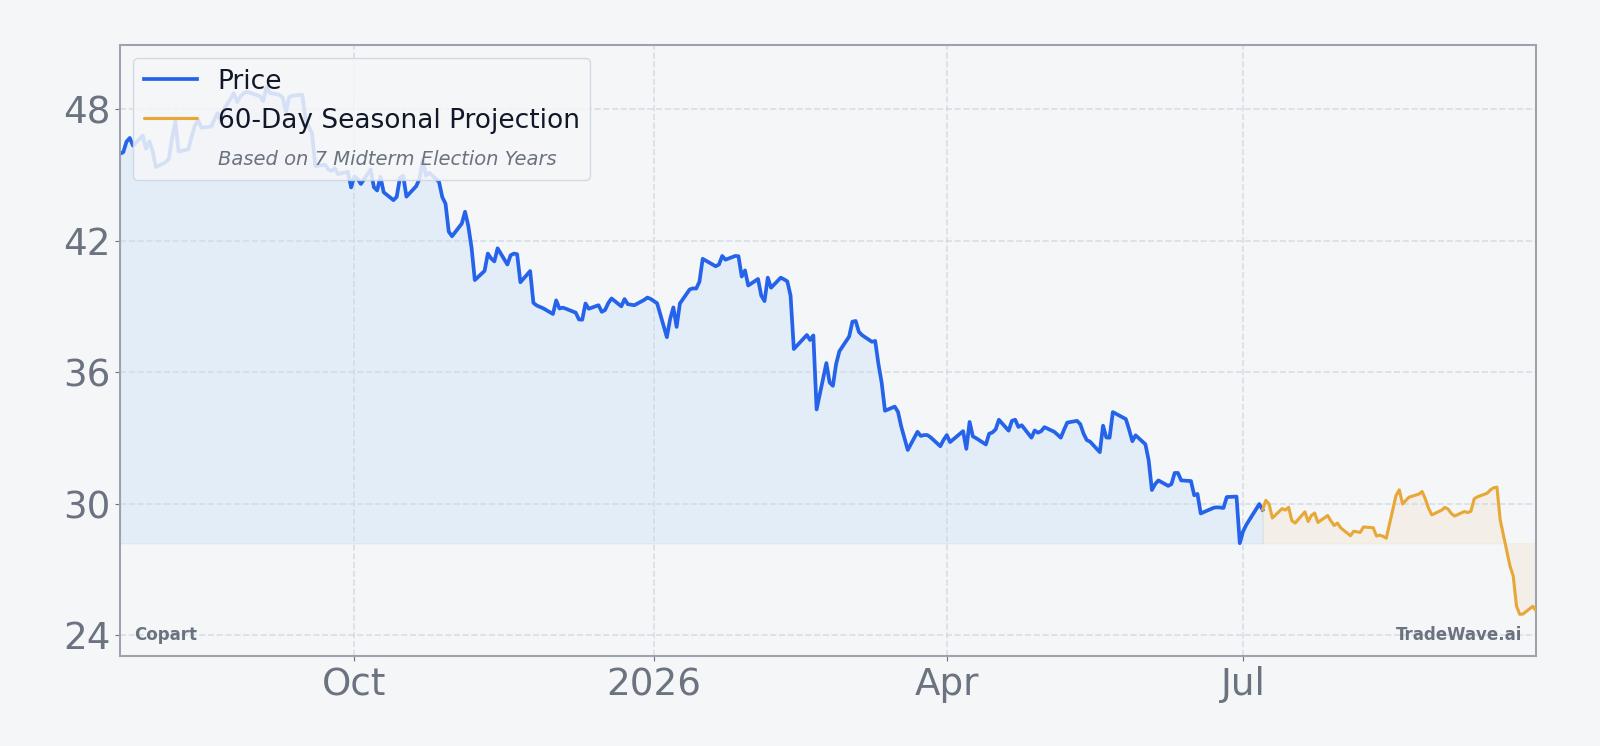
Copart shares closed the prior session at 28.59, down 2.3% on the day, leaving the stock about 43.0% below its 52-week high of 50.11 and only about 2.7% above its 52-week low of 27.85. The one-month return sits at -5.46%, with the stock trading below its 50-day moving average of 31.73 and on slightly lighter-than-average 20-day volume of roughly 13.9 million shares. With no fresh earnings or major company-specific catalysts in the past two months, the move looks more like part of a broader reset in high-multiple growth and specialty industrial names than a reaction to a single headline.
The chart below situates the latest move in its recent multi-month context and overlays a short-term seasonal projection.
What should traders watch in this Copart (CPRT) seasonal window?
First, the calendar: the 76-day midterm-year window starts on Jul 20, 2026, so price action in the days just before and after that date will show whether Copart respects its historical seasonality or breaks the pattern. A firm bounce that lifts the stock decisively away from the 27.85 area and back above the 50-day moving average would argue that buyers are willing to fade the usual midterm-year weakness. A failure to hold that 52-week low, especially on rising volume, would be more in line with the historical short-favored Copart trading window.
Second, watch how intraperiod swings evolve relative to the past. In prior cycles, maximum adverse excursions against the short side have often reached double digits before the trade ultimately worked, which means sharp rallies inside the window have not been unusual. If Copart starts the window with a fast 8% to 12% squeeze higher and then stalls, that would still fit the historical pattern of choppy but ultimately lower midterm-year behavior. A clean, low-volatility grind higher through the entire 76 days, by contrast, would mark a clear break from the CPRT seasonal trend.
Finally, keep an eye on the policy and macro calendar that tends to shape midterm-year trading. Any shifts in infrastructure spending, auto-safety regulation, insurance capital rules or credit conditions for consumers could alter expectations for salvage volumes and used-car pricing, which are key drivers for Copart’s business. If those headlines skew supportive just as the seasonal window opens, they could blunt or even reverse the historical downside bias; if they add uncertainty or pressure to the auto and insurance complex, they could reinforce the pattern and extend the stock’s slide.
Sources
About this seasonal analysis
Seasonal pattern data is sourced from TradeWave.ai, which analyzes historical price behavior across annual calendar windows going back up to 30 years. Read the full data methodology or the book The 100-Year Pattern by Afshin Moshrefi (2026 edition). Past performance of seasonal patterns does not guarantee future results. This article is for informational purposes only and does not constitute investment advice.