Despite AI Capex Boom, ASML Holding (ASML) Nears Midterm Window That’s 100% Bearish
ASML Holding is heading toward a short, historically bearish midterm-election-year trading window even as the stock trades near record highs on AI-fueled demand.
Price as of Jul 20, 2026: $1,762.76 (intraday).

What is the seasonal pattern for ASML Holding (ASML)?
ASML Holding has fallen in 7 of 7 midterm-election-year windows starting around Jul 30, with an average 4.73% gain for short positions in winning years.
- 7 for 7 in this window for shorts, with average winning-year profits of 4.73% over 12 trading days.
- The upcoming midterm-year window runs from Jul 30 for 12 trading days and has historically favored downside moves in ASML Holding.
- Percent Profitable is 100%, with 7 winners and 0 losers for the short-side pattern across the last seven midterm election years.
- The TradeWave Ratio is 1.21, indicating that price typically travels meaningfully in the trade direction within the window before settling.
- The Sharpe ratio of 0.99 shows a relatively strong risk-adjusted profile for this short pattern, though individual years have seen sizable swings.
- Historical maximum adverse excursions have reached more than 20% in the worst year, underscoring that rallies against the short can be sharp even in winning setups.
According to historical data from TradeWave.ai, this midterm-election-year stretch has behaved very differently from an average summer for ASML Holding. The next section walks through how that pattern has played out in prior cycles and what it means for the upcoming 12-day window.
How has ASML Holding (ASML) traded in this late-July midterm-year window?
ASML Holding has delivered profits for short positions in all seven midterm-election-year windows starting around Jul 30, with average gains of 4.73% over 12 trading days. Shares finished Monday at 1,760.04, up 0.7% on the day and about 12.0% below their 52-week high of 1,999.96, after an 80% surge year to date. That combination of a clean bearish seasonal record and a stretched price backdrop is what makes this specific ASML seasonal trend stand out for traders watching the next few weeks.
Grouping the data by the presidential election cycle matters here because this pattern only shows up in midterm election years, not across random Jul–Aug windows. Midterm years often bring policy uncertainty around regulation, export controls and fiscal priorities, which can hit capital-spending leaders like ASML differently than in the pre-election year that follows.
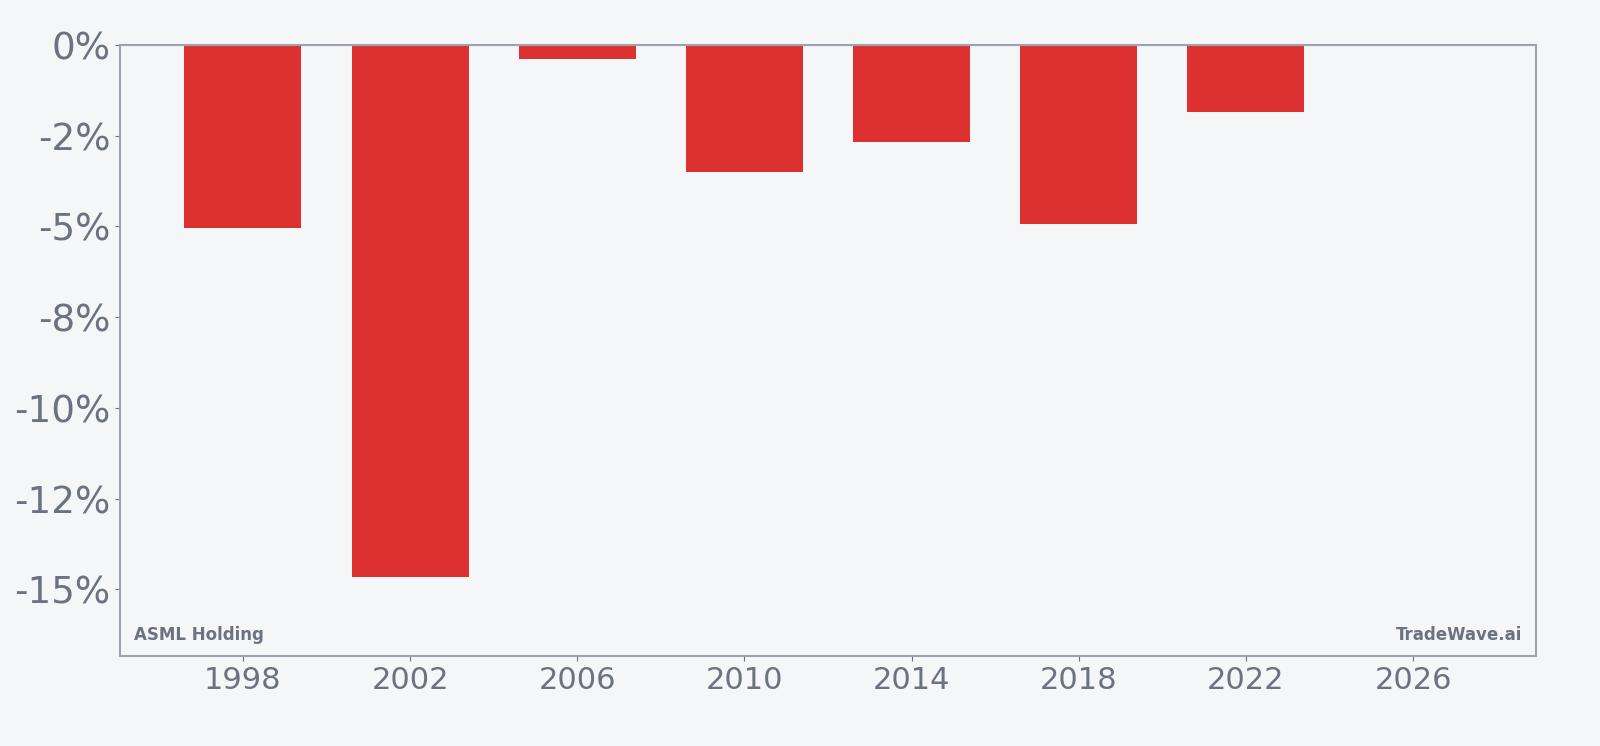
Historically, this 12-day ASML Holding trading window has been a clean short-side pattern. Percent Profitable is 100%, with 7 winners and 0 losers, and the cumulative return across those midterm-year samples is 37% for the short direction. Average profit of 4.73% per window means that in a typical winning year, the stock has dropped enough during the window to deliver a mid-single-digit gain to shorts, even though the broader AI and semiconductor equipment seasonal outlook has often been constructive outside this slice.
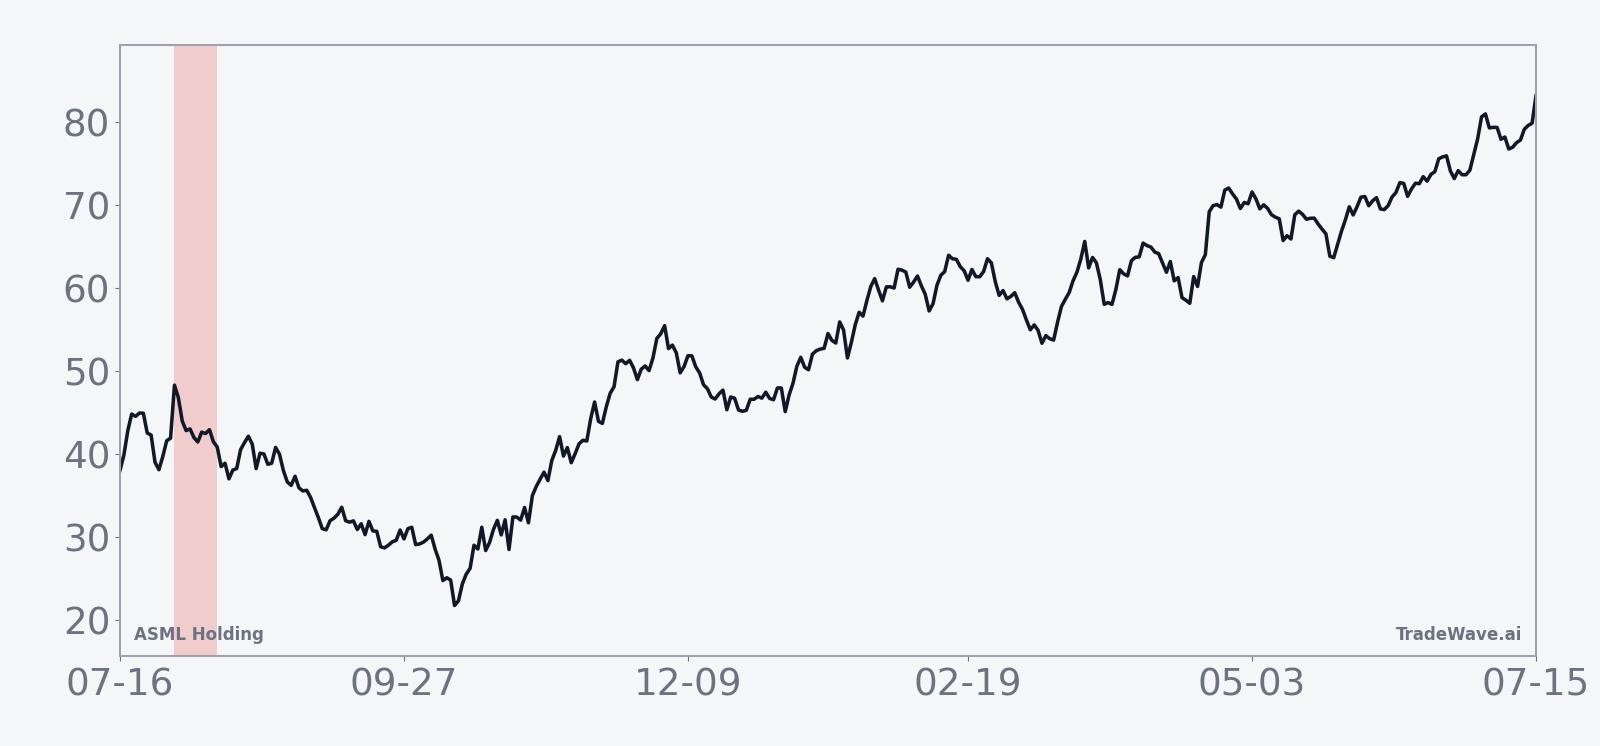
The historical seasonal average trend for this window slopes lower, with much of the downside typically accruing in the middle of the 12-day span rather than in a single gap. That profile fits a pattern where ASML often starts the window near short-term highs and then bleeds lower as midterm-year macro and policy headlines intersect with positioning in high-multiple AI beneficiaries.
Year-by-year bars with maximum favorable and adverse moves show how far ASML has tended to swing inside the window before closing.
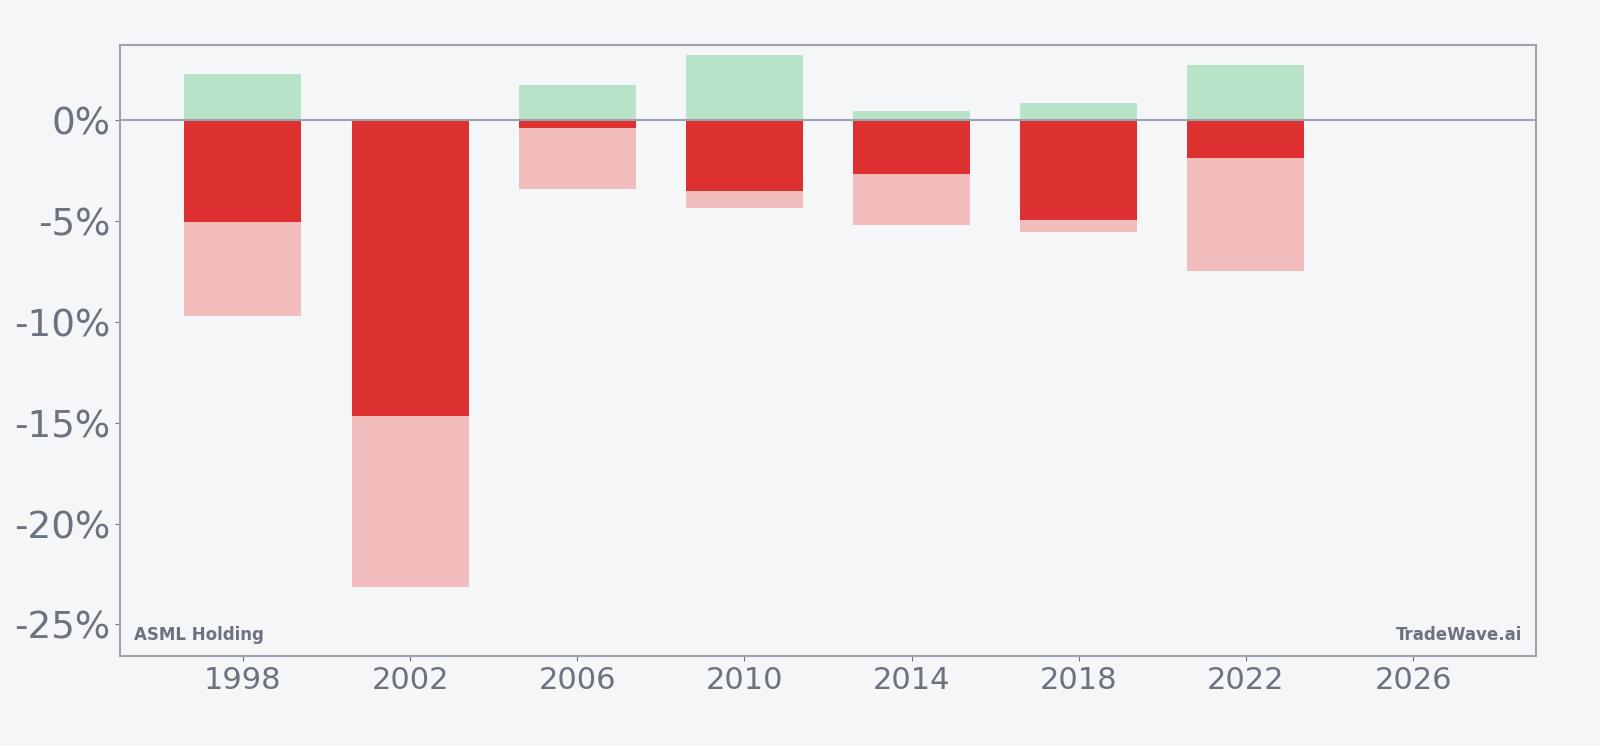
The per-year bars show that even in winning short years, intraperiod swings have been meaningful. In 2002, for example, the net return for the short was about 14.65%, with the best point-to-peak move in the trade direction at roughly 2.04% and the worst drawdown against the short at about 23.12%, illustrating how MAE can dwarf the final outcome in volatile years. In milder years like 2006, the net gain for shorts was only 0.4%, with a modest 1.76% maximum favorable move and a 3.42% maximum adverse move, underscoring that this ASML seasonal pattern can range from grindy to violent depending on the macro backdrop.
Across the seven midterm-year samples, the TradeWave Ratio of 1.21 suggests that price typically travels a fair distance in the trade direction within the window, independent of where it finishes. The Sharpe ratio of 0.99 indicates that, based on end-of-window outcomes, the risk-adjusted profile has been relatively strong for a short pattern, even though individual years have seen double-digit intraperiod rallies and selloffs. Add it up: seven for seven winning short windows, mid-single-digit average profits and a history of sizable swings make this one of the more distinctive ASML seasonal trends on the calendar.
History does not guarantee future results; adverse excursions (MAE) can be large even in winning windows, and traders can face sharp rallies against the trade before the pattern plays out.
Why does ASML Holding (ASML) follow this seasonal pattern?
One likely driver is the way midterm election years cluster regulatory and export-control headlines around advanced chips, which can hit sentiment for a capital-spending bellwether like ASML just as summer liquidity thins. Analysts have also pointed to institutional portfolio repositioning around midyear, as funds rebalance big AI winners and adjust exposure to semiconductor equipment ahead of the stronger pre-election year. This late-July window may reflect that combination of policy uncertainty and profit-taking in a stock that often sits near highs after strong first-half performance.
What is driving ASML Holding (ASML) today?
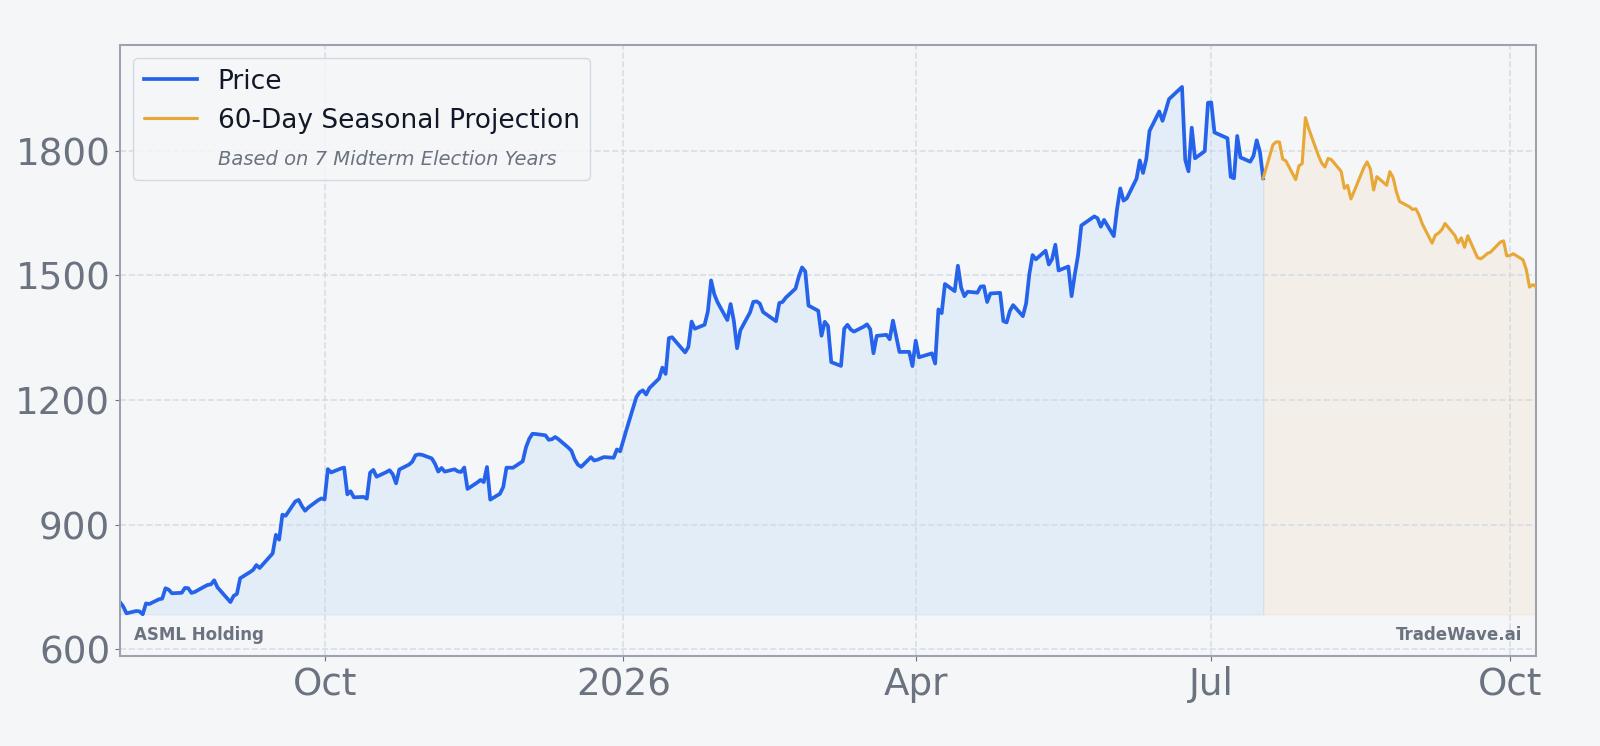
ASML Holding closed at 1,760.04 on Monday, up 12.46 points or 0.7%, after a run that has left the stock about 160.2% above its 52-week low of 676.31 and roughly 12.0% below its 52-week high of 1,999.96. The move comes on the heels of second-quarter results on Jul 15 in which ASML boosted sales expectations, citing strong AI-related investment in semiconductor manufacturing and a robust order book that stretches through 2027.[1] Reuters reported on Jul 20 that demand for the company’s extreme ultraviolet lithography systems remains so strong that ASML is nearly sold out of its flagship EUV tools for 2027, reinforcing its central role in the semiconductor equipment sector.[2]
In Q1, ASML had already raised its full-year sales outlook to between €36 billion and €40 billion and reiterated a gross margin target of 51% to 53%, framing 2026 as a year of strong execution rather than a pause in the AI buildout.[3] That backdrop has helped the stock hit record highs earlier this year and kept analysts broadly positive, with recent coverage highlighting ASML as a potential candidate to become Europe’s first trillion-dollar company as AI-driven capex accelerates.[2] Against that bullish fundamental and macro story, the approaching historically weak midterm-year seasonal window stands out as a potential volatility pocket rather than a simple trend continuation.
The chart below situates the latest move in its recent multi-month context alongside a 60-day seasonal projection.
What should traders watch as this ASML seasonal window approaches?
First, the calendar: the 12-day midterm-year window begins on Jul 30, so price action in the days just before that date will shape how stretched or consolidated ASML looks as the pattern kicks in. A push back toward the 52-week high near 2,000 into the start of the window would echo several prior cycles where shorts had to absorb early rallies before the historical downside emerged. Second, watch how AI and capex headlines evolve after the latest earnings beat; any shift in tone on export restrictions to China or on the pace of foundry spending could either reinforce or blunt the typical midterm-year softness.[1][2]
Third, intraperiod behavior will matter as much as the final outcome. In prior years, maximum adverse excursions against the short have reached double digits, so a sharp squeeze higher inside the window would not, by itself, contradict the historical pattern. What would challenge it is a sustained break to new highs that holds through the end of the 12-day stretch, something that has not happened in the last seven midterm election years. Finally, traders will be watching whether ASML’s moves spill over into broader semiconductor equipment names; if the stock follows its historical midterm-year pattern and wobbles into early August, that could briefly cool a sector that has been one of the clearest winners of the AI cycle.[2]
Sources
- Barron's: ASML Stock Jumps as Earnings Ride the Wave of AI Spending (Jul 14, 2026)
- CNBC: Morgan Stanley upgrades ASML, says AI tailwinds will boost the stock (Sep 22, 2025)
- The Motley Fool: Why ASML Stock Is Sinking Today (Apr 15, 2026)
- Yahoo Finance (GuruFocus): ASML Jumps on Analyst Double Upgrade Citing AI Cycle (Jan 2, 2026)
- CNBC: ASML hits record high on AI boost — and analysts see plenty of room to run (Jan 16, 2026)
- Reuters: Could AI chip boom make ASML Europe's first trillion-dollar firm? (Jul 20, 2026)
About this seasonal analysis
Seasonal pattern data is sourced from TradeWave.ai, which analyzes historical price behavior across annual calendar windows going back up to 30 years. Read the full data methodology or the book The 100-Year Pattern by Afshin Moshrefi (2026 edition). Past performance of seasonal patterns does not guarantee future results. This article is for informational purposes only and does not constitute investment advice.