9 of 9: Applied Materials (AMAT) Has Dropped Every Time in This 27-Day Late-July Window
Applied Materials is heading into a late-July seasonal window that has delivered consistent downside in past years, just as the stock trades well below its 52-week high after a sharp one-month pullback.
Price as of Jul 20, 2026: $525.70 (last close).

What is the seasonal pattern for Applied Materials (AMAT)?
Applied Materials has fallen in 9 of 9 years during this late-July 27-day window, with an average gain of 5.75% in winning years for a short position.
- 9 for 9 in this window for shorts, with Applied Materials declining every year and delivering an average 5.75% move in favor of the trade.
- The upcoming pattern runs from Jul 31 for 27 trading days, a historically bearish late-July to August stretch for AMAT.
- Percent Profitable is 100%, with 9 winners and 0 losers for the short-side strategy across the nine-year lookback.
- Average winner gains of 5.75% for shorts stack into a 64% cumulative return over the sample, supported by a Sharpe ratio of 1.74.
- A TradeWave Ratio of 2.2 signals that price has typically traveled meaningfully in the trade direction within the window, even before final closes.
- Intraperiod swings have been sizable, with several years showing double-digit adverse moves against the stock, underscoring volatility risk for longs during this AMAT seasonal trend.
According to historical data from TradeWave.ai, this late-July stretch has behaved very differently from an average month for Applied Materials, and the next iteration is about to start.
How has Applied Materials (AMAT) traded in this late-July seasonal window?
Applied Materials has declined in 9 of 9 years during the 27-day window that begins on Jul 31, a perfect record for short sellers with an average 5.75% gain in winning years. Today the stock closed at $525.70, about 28.9% below its 52-week high of $739.67 after sliding 14.81% over the past month. That combination of a strong historical bearish window and a stock already well off its highs makes this Applied Materials trading window one of the more unusual setups on the semiconductor calendar.
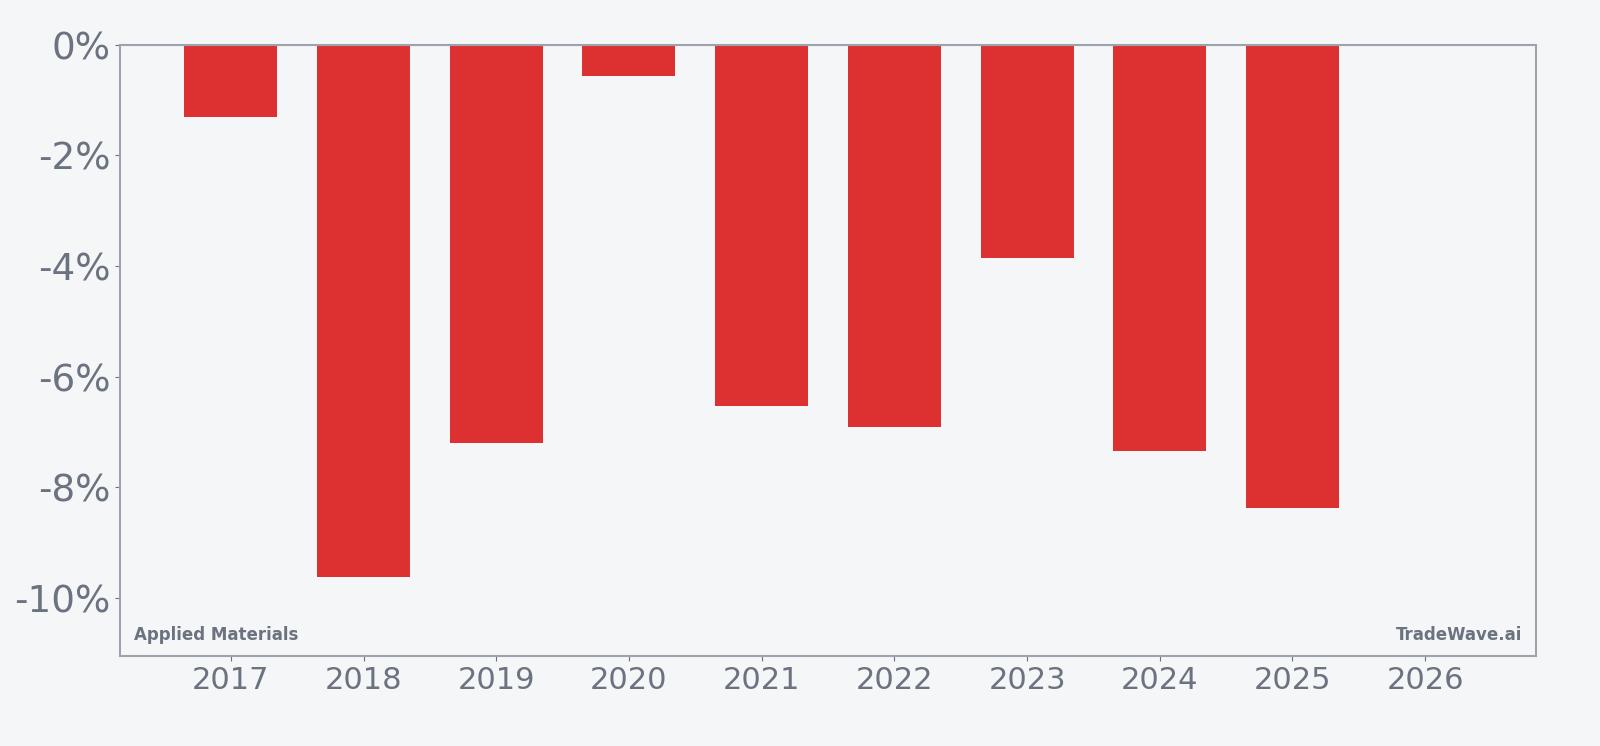
Because the trade direction is short, negative net returns in the per-year table represent favorable years for the pattern. Across 2017 through 2025, every iteration of this Applied Materials seasonal trend shows the stock finishing the window lower, with net moves ranging from a modest 0.56% drop in 2020 to a 9.62% slide in 2018. Add it up and the cumulative return for the strategy is 64%, which is unusually strong for a window that lasts just under six weeks each year.
The average winner gain of 5.75% for shorts sits alongside a median profit of 6.91%, which tells you the typical outcome has leaned toward the stronger side of that average rather than being skewed by a single outlier year. The Sharpe ratio of 1.74, based on end-of-window outcomes, points to a favorable risk-adjusted profile compared with many short-term stock pattern analyses. For traders who track historical seasonality, a 100% Percent Profitable record with nine winners and zero losers is rare, especially in a large-cap semiconductor equipment name.
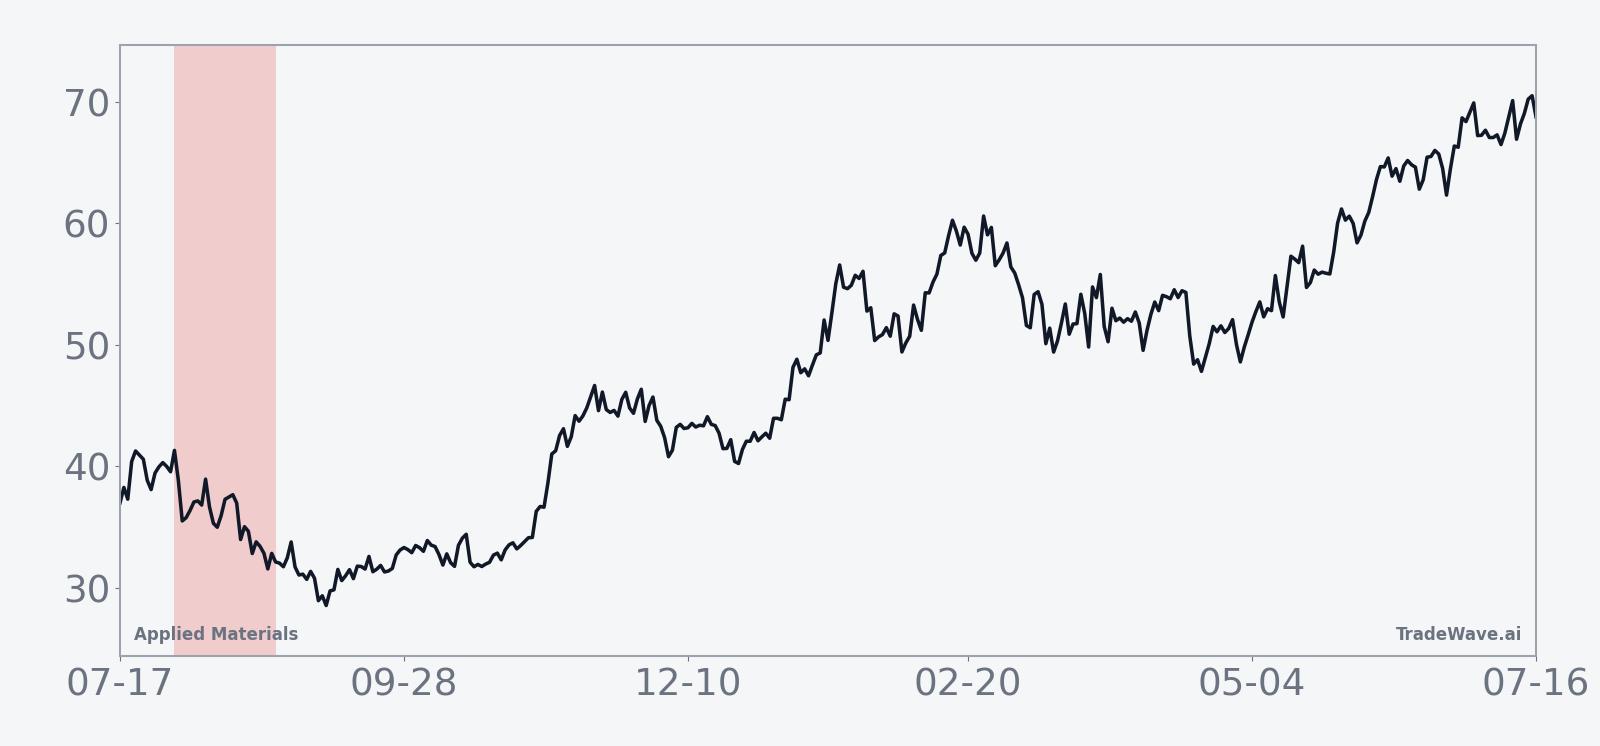
The historical seasonal average suggests that much of the move for shorts has tended to build in the middle of the window rather than in the first few days. The cumulative curve slopes steadily in favor of the short position, with only brief countertrend rallies, which fits a picture of persistent but not crash-like pressure on the stock during this slice of the calendar.
Year-by-year bars that include both best and worst intraperiod swings show how far AMAT has tended to travel in each direction before the window closes.
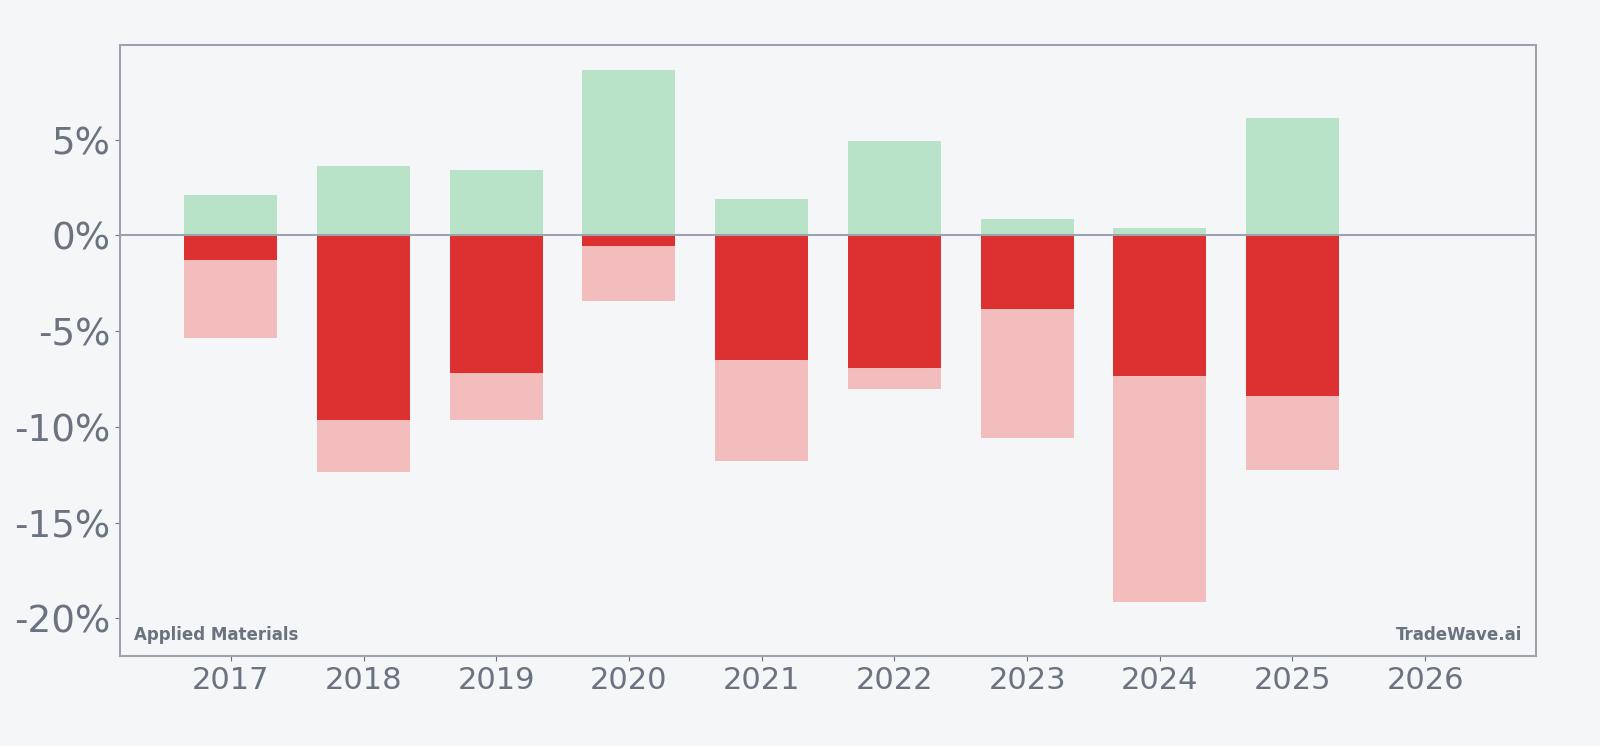
The stacked bars that combine net return with maximum favorable excursion and maximum adverse excursion show a window that has offered both meaningful follow-through and real risk. In strong years for the pattern such as 2018 and 2025, the stock not only finished the window down 9.62% and 8.37% respectively, but also saw maximum adverse moves against the short position of 12.36% and 12.28%, meaning longs endured double-digit drawdowns at some point in the stretch. In 2024, the stock’s worst intraperiod drawdown from the entry was 19.13%, even though the final net move was a 7.35% decline, underscoring how volatile this Applied Materials trading window can be for both sides of the tape.
History does not guarantee future results; adverse excursions can be large even in winning windows, and traders should size risk accordingly.
Why does Applied Materials (AMAT) follow this seasonal pattern?
One likely driver is the way Applied Materials’ earnings calendar and guidance updates often cluster around late summer, a period when chipmakers reassess capital spending plans and export-control headlines can hit order books. Analysts have also pointed to broader semiconductor sector rotation, with investors trimming high-beta equipment names after strong first-half runs and reallocating around midyear as visibility on next-year wafer fab budgets firms up.[5] This late-July seasonal pattern may reflect that recurring mix of earnings risk, macro uncertainty around China demand, and institutional portfolio repositioning rather than any single catalyst.
What is driving Applied Materials (AMAT) today?
Applied Materials closed Monday at $525.70, down 0.75% on the day and roughly 28.9% below its 52-week high of $739.67, after a bruising 14.81% slide over the past month on heavy volume relative to its 20-day average of about 11.8 million shares. The stock’s 50-day moving average sits near $527.34, so price is now hovering just below that short-term trend line, a spot where traders often debate whether a pullback is just a pause in a longer uptrend or the start of something more serious.
In August 2025, Applied Materials shocked investors by guiding its fiscal fourth-quarter revenue and earnings below Wall Street expectations, citing a pause in China demand, customers digesting capacity, and uncertainty around U.S. export licenses for advanced chipmaking tools.[6][7] Shares slumped roughly 11% to 13% in extended and after-hours trading around that report, a reminder of how quickly sentiment can flip in this name when guidance shifts.[7] Later in September 2025, Morgan Stanley upgraded the stock to overweight and raised its 12-month price target, arguing that improving memory pricing and derisking in China and leading-edge logic supported a more constructive view on the semiconductor equipment cycle.[1]
By early 2026, analysis of Applied Materials’ positioning against key rival ASML highlighted both the upside from AI-driven chip demand and the risks tied to valuation and China exposure, framing the stock as a high-quality but cyclical way to play the semiconductor equipment boom.[5] Against that backdrop, the current pullback looks less like an isolated event and more like another chapter in a stock that tends to overshoot in both directions as investors recalibrate expectations for wafer fab spending, export rules and competitive dynamics.
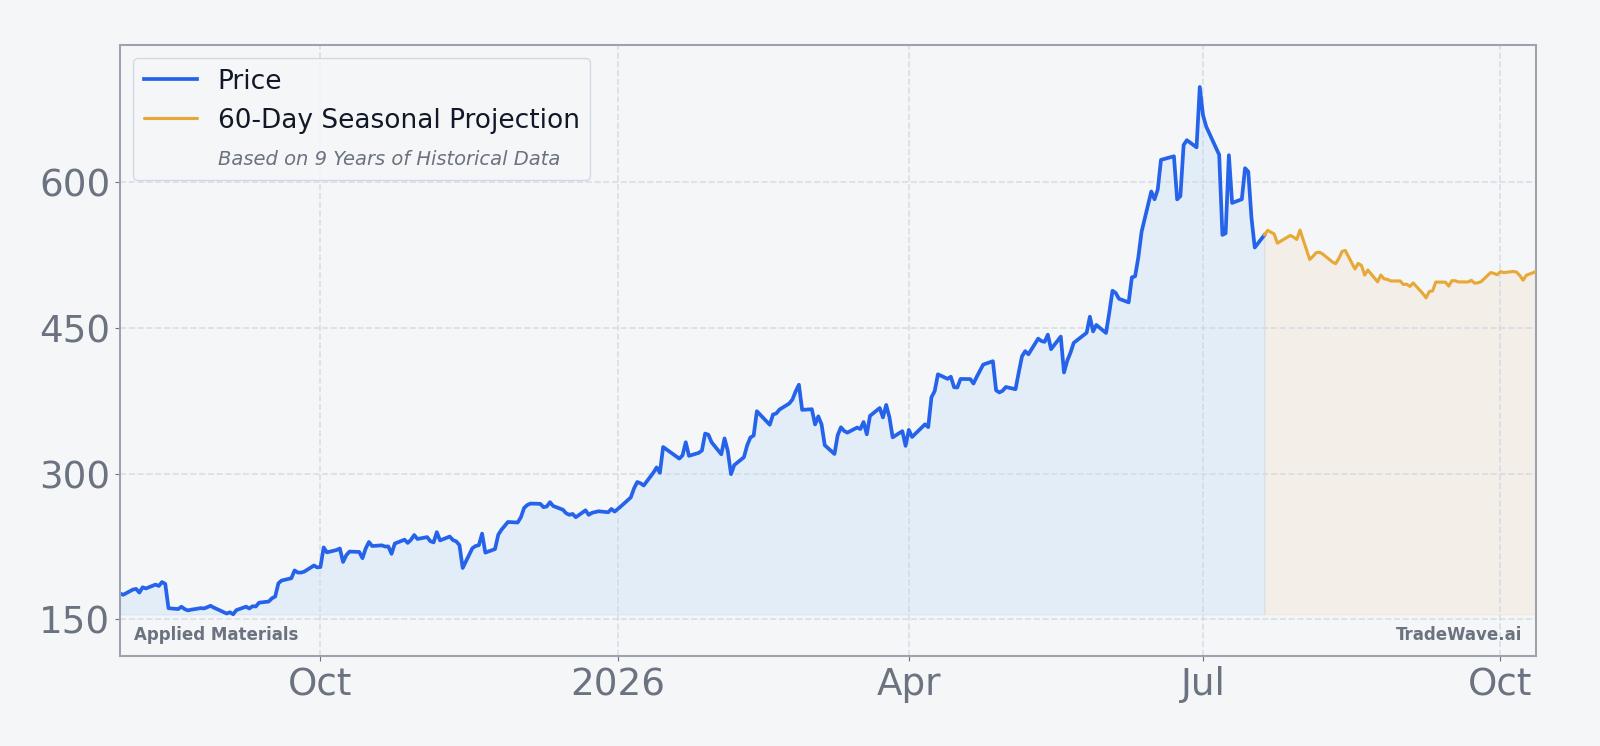
The chart below shows how that volatility has played out over the past year, along with a 60-day seasonal projection overlay for context.
What should traders watch in this Applied Materials seasonal window?
The key test for this year’s late-July window will be whether Applied Materials respects the historical pattern of grinding lower or instead stabilizes above the $500 area and starts to rebuild toward its 50-day moving average. A firm hold of support with shrinking intraday ranges would contradict the typical AMAT seasonal trend, while another leg down that accelerates in the middle of the window would line up closely with the nine-year history.
On the fundamental side, any updates on China export licenses, tariff negotiations or signs that customers are resuming paused orders could quickly change the narrative around next year’s wafer fab budgets.[6][7] Traders will also be watching how Applied Materials trades relative to other semiconductor equipment names; if the whole group weakens while AMAT underperforms, it would fit the historical pattern of this Applied Materials trading window being a soft spot on the sector calendar.[1][5]
Levels matter too. The 52-week low near $153 is far away, but the stock’s behavior around the $500 round number and the $527.34 50-day moving average will offer early clues about whether sellers still control the tape. If the stock spends most of the window below that moving average with rallies getting sold, it would echo prior years where the short-side pattern delivered steady downside rather than a single shock event.
For investors who do not trade seasonality, the takeaway is simpler: this is a period when Applied Materials has historically been more vulnerable to bad news and position clean-up than to sustained breakouts. Watching how the stock behaves into and through this 27-day stretch will show whether that historical seasonality still has teeth in a market dominated by AI enthusiasm and shifting export rules.
Sources
- CNBC: Morgan Stanley raises Applied Materials rating, sees another 10% upside (Sep 22, 2025)
- Forbes: What Is Going On With AMAT Stock? (Dec 30, 2025)
- Forbes: Why Is AMAT Stock Surging (Dec 3, 2025)
- Seeking Alpha: Applied Materials tumbles as it expects decline in Q4 revenue (Aug 14, 2025)
- Forbes: Can AMAT Break ASML’s Monopoly? (Jan 30, 2026)
- Reuters: Applied Materials' forecast hit by China pause, export-license woes; shares down 13% (Aug 14, 2025)
- Reuters: Applied Materials sees lower-than-expected quarterly revenue, shares slump (Aug 14, 2025)
About this seasonal analysis
Seasonal pattern data is sourced from TradeWave.ai, which analyzes historical price behavior across annual calendar windows going back up to 30 years. Read the full data methodology or the book The 100-Year Pattern by Afshin Moshrefi (2026 edition). Past performance of seasonal patterns does not guarantee future results. This article is for informational purposes only and does not constitute investment advice.