Microsoft (MSFT) Has Rallied in 9 of 9 Midterm Windows From Jul 23, Averaging 26.49% Gains
Microsoft is heading toward a midterm-election-year seasonal window that has never been negative in this dataset, even as the stock trades well below its 52-week high and investors weigh AI growth against heavy capex.
Price as of Jul 8, 2026: $383.34 (last close).

What is the seasonal pattern for Microsoft (MSFT)?
Microsoft has risen in 9 of 9 midterm-election-year windows starting around Jul 23, with an average gain of 26.49% in winning years.
- 9 for 9 in this window, with Microsoft averaging 26.49% gains across all winning years.
- The upcoming window begins on Jul 23, 2026 and spans 279 calendar days, covering the late midterm year into the pre-election year.
- Percent Profitable is 100%, with 9 winners and 0 losers in the last 9 midterm-election-year cycles.
- Average annualized return in the window is 25.53%, with a Sharpe ratio of 1.4 based on end-of-window outcomes.
- The TradeWave Ratio of 1.54 indicates that price has typically traveled meaningfully in the long direction within the window, even beyond the final close.
- Individual years have seen sizable intraperiod swings, with maximum favorable moves above 60% in some cycles and double-digit drawdowns in others.
According to historical data from TradeWave.ai, this midterm-election-year stretch has behaved very differently from an average calendar year for Microsoft. The next section walks through how that pattern has played out in prior cycles and what it means for the upcoming window.
How has Microsoft (MSFT) traded in past midterm-year windows starting in late July?
Microsoft has risen in all 9 midterm-election-year windows that began around Jul 23 and ran for 279 calendar days, averaging 26.49% gains with a long bias. The stock finished the prior session at 383.34, down 1.4% on the day and about 29.9% below its 52-week high of 546.77, leaving plenty of room between current levels and the top of its recent range. This combination of a clean historical win streak and a sizable gap to the prior high is why this specific Microsoft trading window stands out on the calendar.
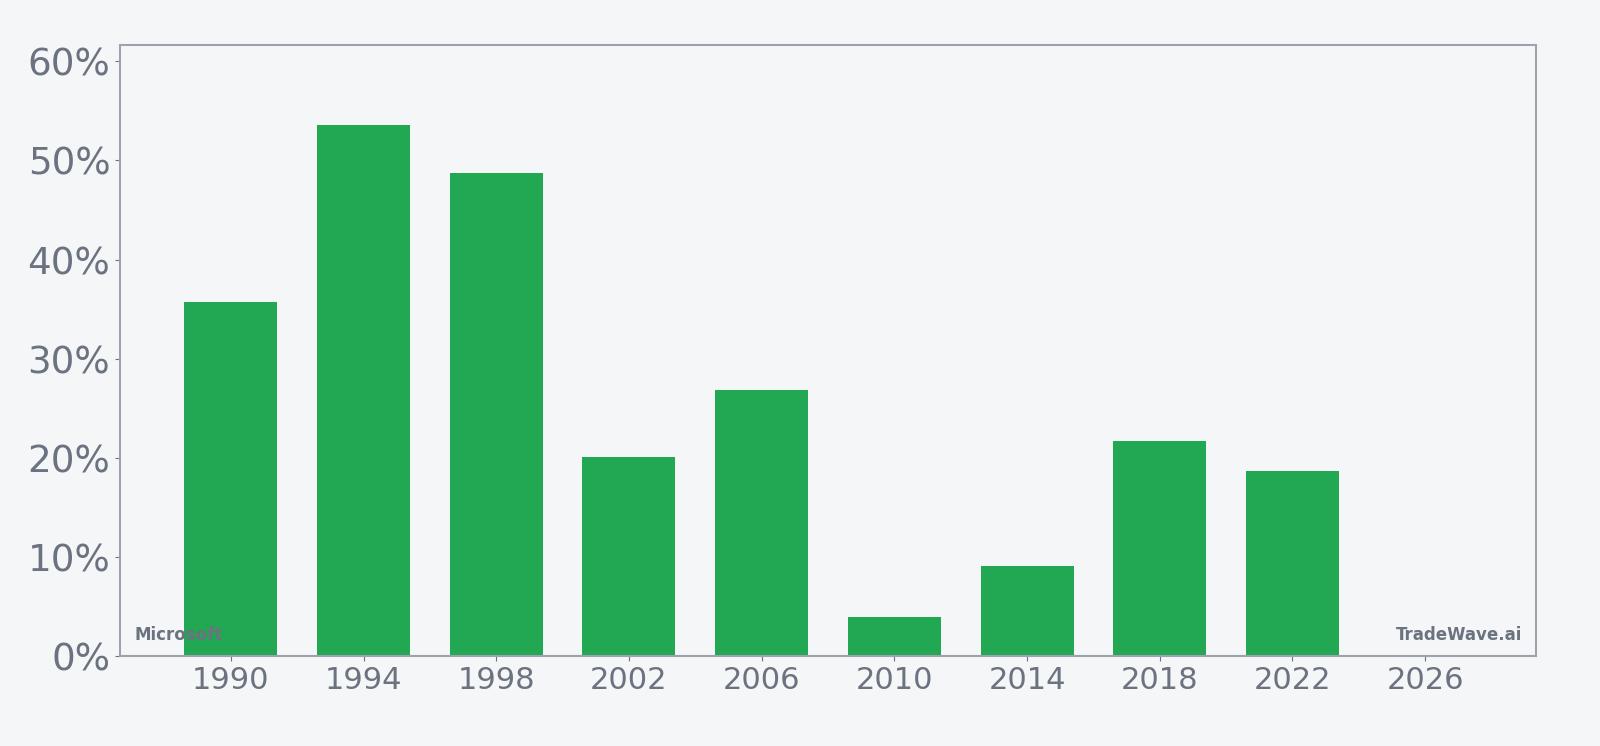
Grouping the data by the presidential election cycle matters here because this window straddles the late midterm election year and the run-up to the presidential pre-election year, a phase that has often coincided with clearer policy visibility and stronger risk appetite. In this pattern, the trade direction is explicitly long, so the focus is on how consistently Microsoft has rewarded bullish exposure during this slice of the calendar rather than on short-term noise.
Across the nine midterm-election-year samples, Microsoft’s average profit of 26.49% sits on top of a 25.53% annualized return, which reflects the long 279-day span of the window. Median profit of 21.69% shows that the gains are not just driven by one or two outlier years; more than half of the cycles delivered returns north of 20%. Add it up: the cumulative return across all nine windows is 673%, a reminder of how powerful this specific Microsoft seasonal trend has been when it lines up with the election calendar.
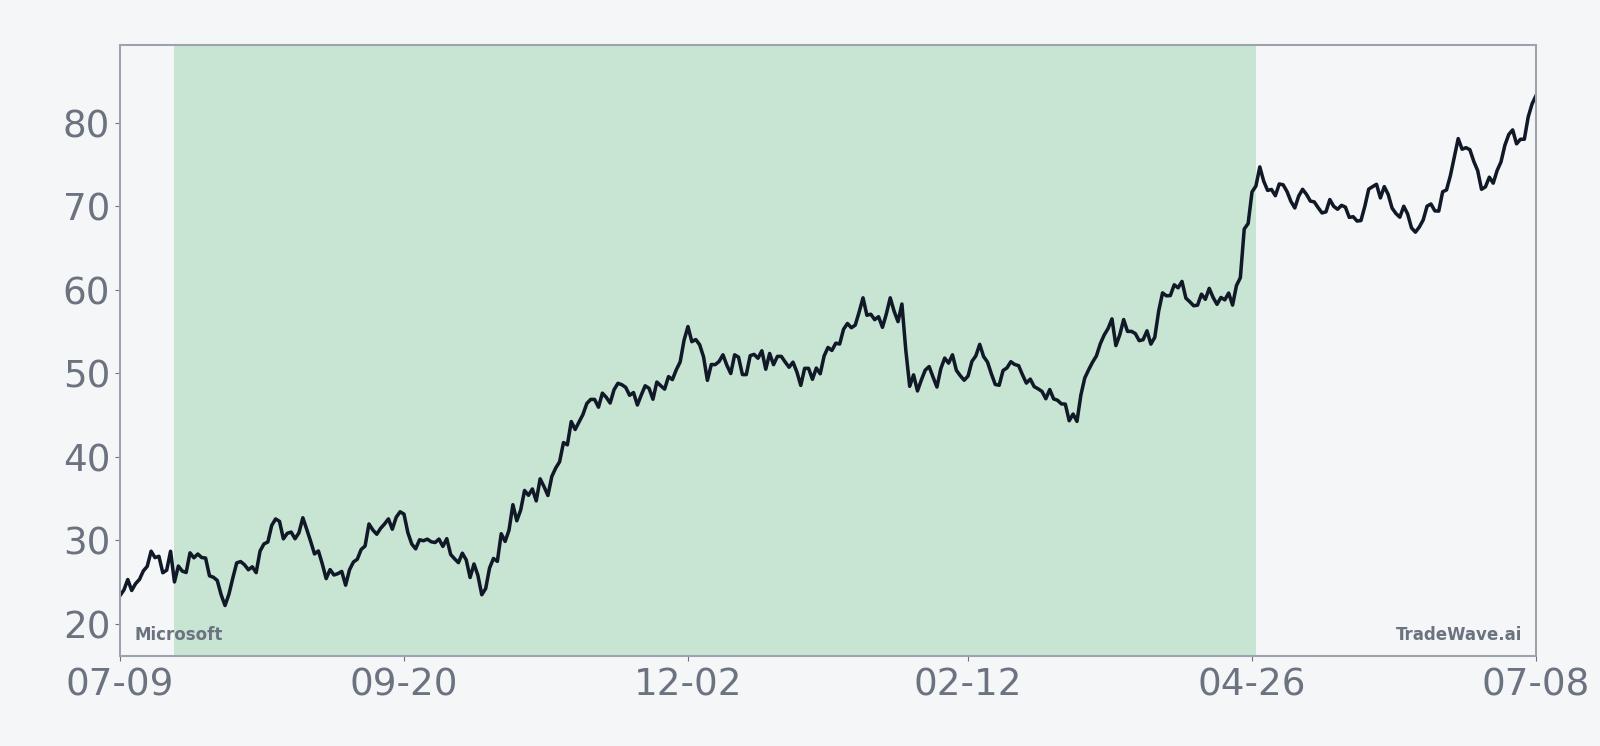
The historical seasonal average curve for this Microsoft trading window slopes higher in a relatively steady fashion, with gains tending to accrue across much of the 279-day span rather than clustering in a single short burst. There are softer patches inside the window, but the typical path shows pullbacks being followed by renewed strength, which is consistent with a long-bias pattern that has not produced a losing year in this sample.
Year-by-year bars that include both peak run-ups and worst drawdowns help show how much the stock has swung inside the window before finishing higher.
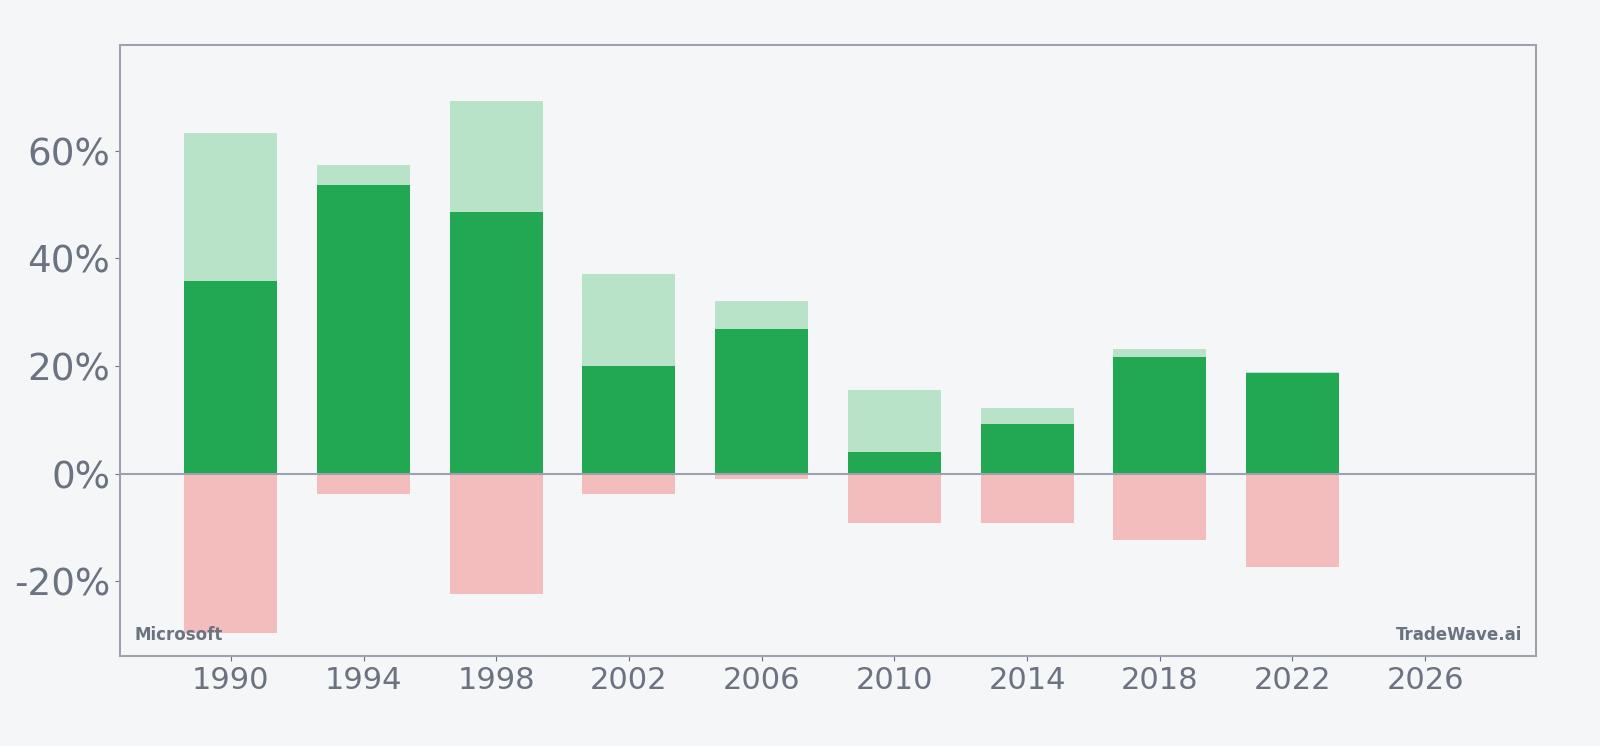
The per-year bars that combine net returns with maximum favorable and adverse excursions show why this window has mattered for both bulls and risk managers. In strong years like 1990 and 1998, Microsoft’s best intraperiod moves topped 60%, while the worst drawdowns still reached into the 20% range, underscoring that even winning windows carried real downside swings. In more moderate years such as 2010 and 2014, peak run-ups were smaller and drawdowns were contained, but the pattern still finished positive, which fits with a TradeWave Ratio of 1.54 that points to meaningful travel in the trade direction inside the window.
History does not guarantee future results; adverse excursions (MAE) can be large even in winning windows.
Why does Microsoft (MSFT) follow this seasonal pattern?
One likely driver is the way Microsoft’s earnings calendar and enterprise budget cycles line up with the midterm-to-pre-election phase, when corporate IT and AI spending plans often firm up after policy uncertainty eases. Analysts have also pointed to institutional portfolio repositioning around the end of the midterm year and into the pre-election year, which can favor mega-cap growth and cloud leaders. This pattern may also reflect broader sector rotation into technology as investors anticipate looser financial conditions and stronger earnings breadth heading into a presidential election year.
What is driving Microsoft (MSFT) today?
Microsoft shares closed at 383.34 in the prior session, down 1.4% on the day and roughly 29.9% below the 52-week high of 546.77, after a choppy stretch that has left the stock down about 6.9% over the past month. The pullback comes after a powerful run that saw the company cross the $4 trillion market-cap mark in 2025 on the back of strong cloud and AI demand, including a fiscal Q4 2025 revenue and EPS beat that pushed the stock more than 8% higher in after-hours trading at the time.[3] In Apr 2026, Microsoft again topped expectations for fiscal Q3 2026, with revenue of $82.89 billion and adjusted EPS of $4.27, helped by roughly 40% year-over-year Azure growth and an AI business annual revenue run rate cited at $37 billion, up 123% year over year.[2][4] Those results reinforced the narrative that AI-driven enterprise demand and cloud workloads remain the core macro drivers for the stock, even as investors debate how far heavy AI infrastructure capex can stretch margins.[4][5]
The chart below situates the latest move in its recent multi-month context, alongside a short-term seasonal projection.
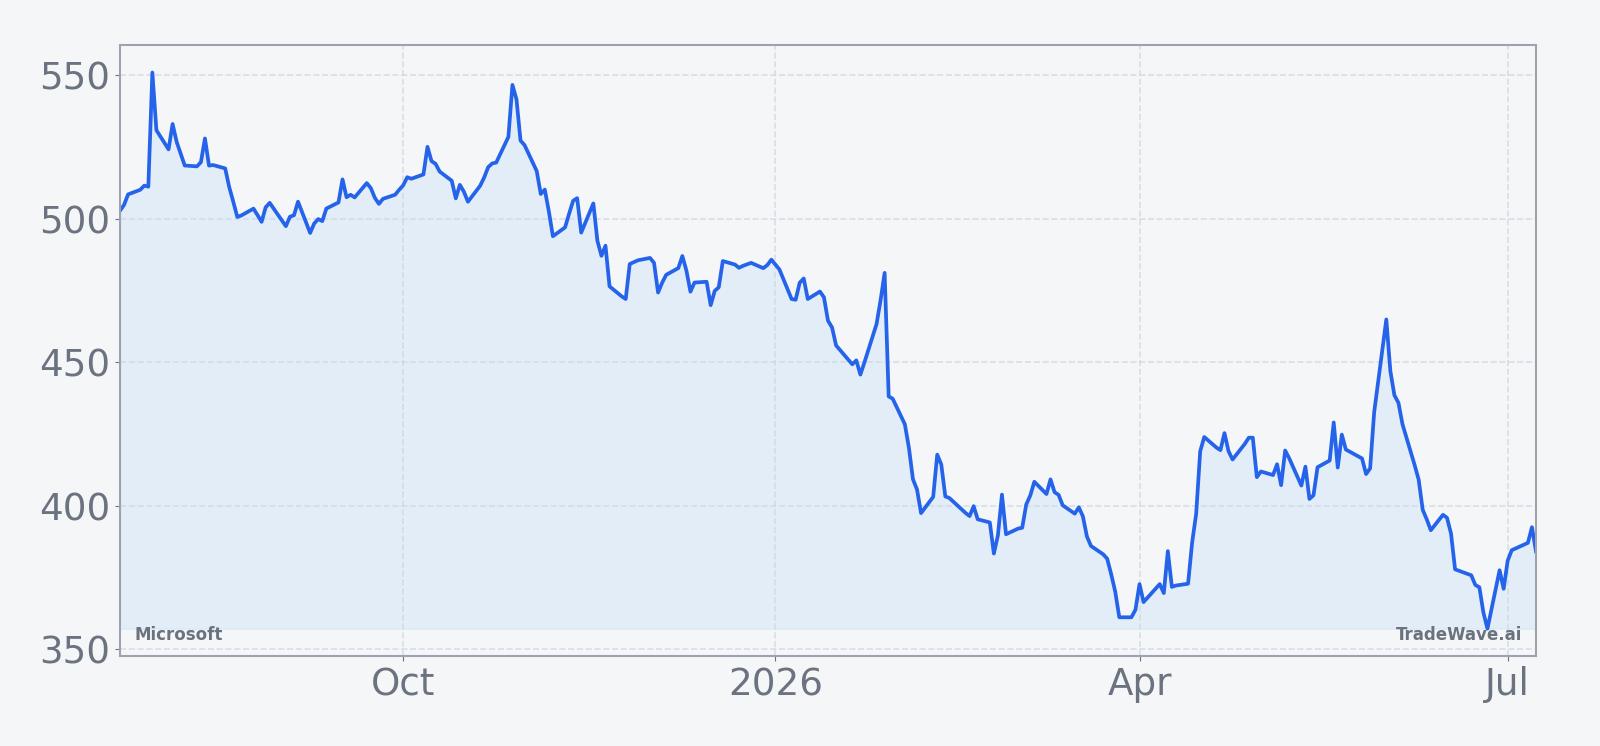
From a macro and sector standpoint, Microsoft sits at the center of the cloud and AI trade, with Intelligent Cloud revenue of about $34.68 billion in the reported Q3 2026 quarter and Azure growth near 40% year over year.[2][4] Coverage from early 2026 highlighted a $37 billion AI revenue run rate and rapid adoption of Copilot seats, reinforcing the idea that AI is becoming a structural, not cyclical, driver for the business.[4][5] At the same time, some analysts have flagged the scale of AI-related capex, with figures in the tens of billions of dollars raising questions about long-term return on investment and potential pressure on free cash flow.[4] Short interest has remained low, with one February 2026 analysis citing short interest of about 0.79%, which suggests that positioning has not been heavily skewed against the stock despite valuation debates.[8]
All of this plays out in a midterm election year, a phase that often brings policy noise around regulation, taxation and antitrust for mega-cap tech, but also sets up the transition into the pre-election year that has historically been friendlier for risk assets. For Microsoft, the seasonal window starting on Jul 23 sits right at that handoff, overlapping a period when AI and cloud spending plans for the following fiscal year are typically locked in and when investors start to look through near-term capex toward multi-year earnings power. The historical seasonality does not override those fundamentals, but it gives traders a clear map of how this stock has tended to behave when the political and policy calendar looks similar.
What should traders watch as this Microsoft seasonal window approaches?
First, the calendar: the 279-day window begins on Jul 23, 2026, so price action in the next two weeks will set the starting point for a regime that has historically delivered double-digit gains for Microsoft. Second, levels: with the stock about 29.9% below its 52-week high, traders will be watching whether Microsoft can reclaim its 50-day moving average around 404.66 and then build a base toward the low-400s before the window opens, or whether further weakness pushes it closer to the 52-week low near 349.20. Third, catalysts: while no specific earnings date is listed beyond the April 2026 report, the next set of results and any updated commentary on AI revenue run rate, Azure growth and capex plans will be key checkpoints for whether the fundamental story still lines up with the historical seasonal bias.[2][4][5]
Finally, behavior inside the window will matter as much as the end result. In prior cycles, even winning years saw double-digit drawdowns at points during the 279-day stretch, so traders will be watching how Microsoft reacts to pullbacks: do dips attract buyers quickly, keeping adverse moves contained, or do they deepen and linger despite the historical pattern. If the stock can pair continued AI-driven revenue strength and manageable capex with the kind of steady, stair-step advance seen in past midterm-election-year windows, it would fit the long-bias seasonal script. A choppy or flat path, by contrast, would mark a clear break from a 9-for-9 record that has quietly defined this part of the calendar for Microsoft.
Sources
- Seeking Alpha: Microsoft keeps Outperform rating as Wedbush sees 'robust' Q4 results (Jul 25, 2025).
- Seeking Alpha: Microsoft perks up as Q3 results top estimates (Apr 29, 2026).
- Business Insider: Microsoft Stock Surges After It Posts Another Earnings Beat (Jul 30, 2025).
- Yahoo Finance: Microsoft tops Q3 estimates, says AI business up 123% year over year (Apr 29, 2026).
- The Motley Fool: Is It Time to Buy Microsoft Stock as Its Backlog Soars? (Jan 30, 2026).
- Seeking Alpha: Microsoft's Lack Of Leadership In AI, Wait (Feb 16, 2026).
About this seasonal analysis
Seasonal pattern data is sourced from TradeWave.ai, which analyzes historical price behavior across annual calendar windows going back up to 30 years. Read the full data methodology or the book The 100-Year Pattern by Afshin Moshrefi (2026 edition). Past performance of seasonal patterns does not guarantee future results. This article is for informational purposes only and does not constitute investment advice.