Apple Inc. (AAPL) Has Rallied in 10 of 10 Midterm Windows, Averaging 53.03% Gains
Apple Inc. is trading just below its 52-week high as it approaches a midterm-election-year seasonal window that has never produced a losing year in this dataset, raising the stakes for a stock that anchors the broader tech trade.
Price as of Jul 7, 2026: $310.66 (last close).
What is the seasonal pattern for Apple Inc. (AAPL)?
Apple Inc. has risen in 10 of 10 midterm-election-year windows starting around Jul 20 and lasting 353 calendar days, with an average gain of 53.03% in winning years.
- 10 for 10 in this window, with Apple Inc. averaging 53.03% gains across all winning years.
- Seasonal window begins Jul 20, 2026 and runs for 353 calendar days, covering the back half of the midterm election year into the following pre-election year.
- Percent Profitable is 100%, with 10 winners and 0 losers in the last 10 midterm-election-year cycles.
- Trade Direction is long, supported by a TradeWave Ratio of 1.39 and a Sharpe ratio of 1.13 for this pattern.
- Individual years have seen maximum favorable moves as high as 158.5% and adverse drawdowns as deep as -40.67% inside the window, underscoring meaningful volatility.
- Cumulative return across all 10 windows totals 4,965%, highlighting how powerful this specific Apple Inc. trading window has been in midterm-election years.
According to historical data from TradeWave.ai, Apple’s behavior in midterm-election years has followed a distinct long-duration pattern that differs sharply from its average calendar-year performance.
How has Apple Inc. (AAPL) traded in this midterm-year seasonal window?
Apple Inc. has risen in all 10 of the last midterm-election-year windows that start around Jul 20 and run for 353 calendar days, averaging 53.03% gains with a long bias. The stock finished the prior session at $310.66, down 0.6% on the day and about 2.1% below its 52-week high of $317.40. This combination of a clean 10-for-10 historical record and a price sitting just under record territory gives the upcoming Apple Inc. trading window unusual weight for both stock pattern analysis and broader tech sentiment.
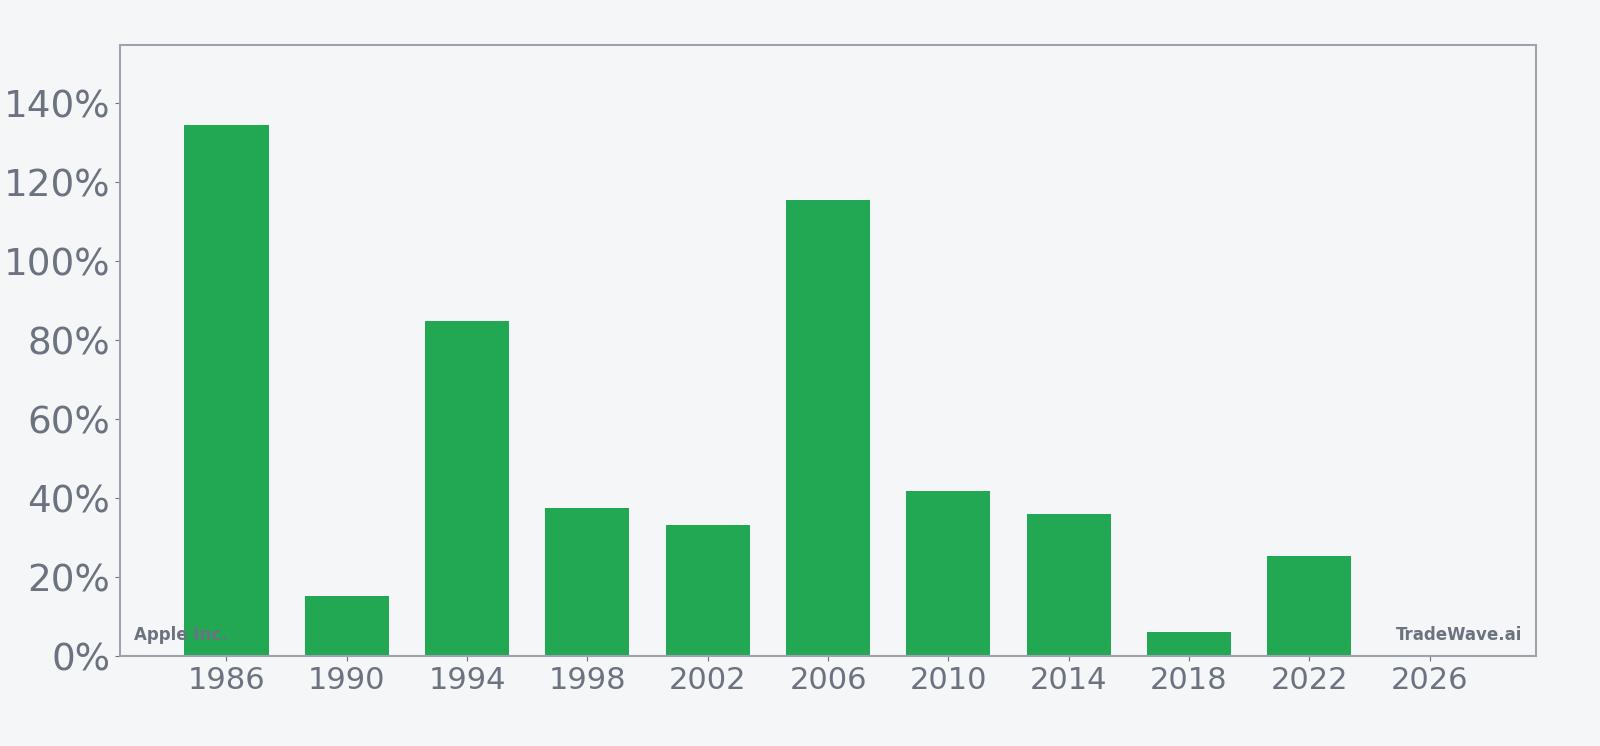
Grouping the data by the presidential election cycle matters here because this window straddles the back half of the midterm election year and the following pre-election year, a stretch when policy visibility typically improves and risk appetite in large-cap tech has often recovered from earlier midterm volatility. In this pattern, the trade direction is explicitly long, and every one of the 10 historical midterm-election-year windows delivered a positive net return for Apple Inc., from a modest 6.07% gain in 2018 to a 134.59% surge in 1986.
The average profit of 53.03% across all winning years reflects how powerful this Apple Inc. seasonal trend has been when the window runs its full 353-day course. The strongest years, such as 2006 with a 115.42% net return and 1986 with 134.59%, show that when the stock has aligned with this midterm-year seasonal pattern, the upside has not just been steady but explosive in some cycles. Even the softer outcomes, like 2018’s 6.07% gain, still finished in the green for a long position.
Intraperiod swings have been meaningful. Maximum favorable moves inside the window have ranged from 22.38% in 2018 to 158.5% in 1986, while maximum adverse moves have stretched as deep as -40.67% in 1990. That profile means Apple Inc. has often given traders both a sizable run-up and a real drawdown within the same seasonal window, a reminder that a strong historical bias does not translate into a smooth ride.
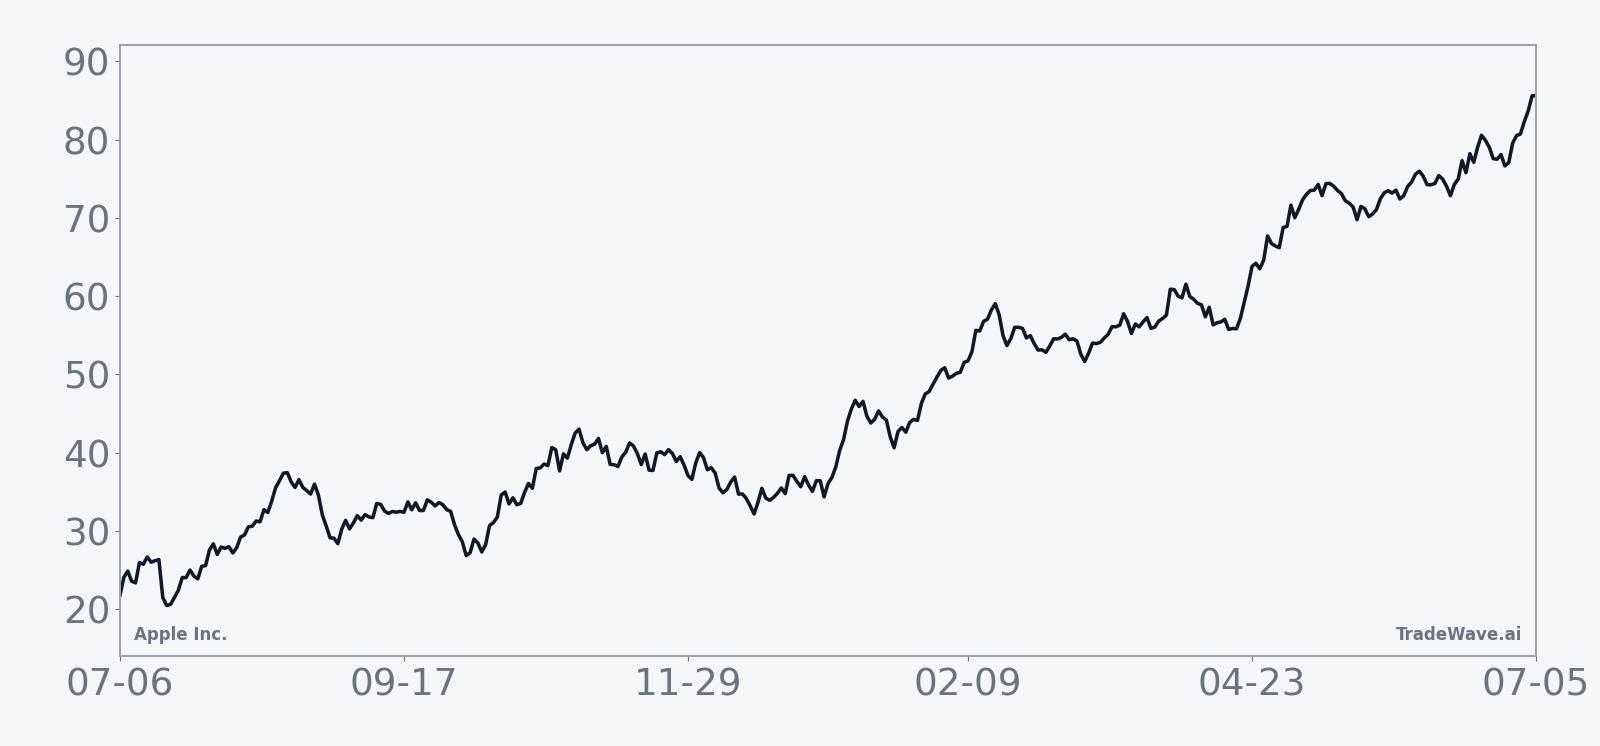
The historical seasonal average trend line slopes higher for most of the 353-day span, with relatively steady gains rather than a single short burst. That suggests the typical pattern has been a grind higher across the midterm back half and into the pre-election year, rather than a quick spike that fades. The cumulative return chart for this window, which aggregates performance across all 10 cycles, climbs persistently, reflecting the 4,965% total gain that this specific Apple Inc. trading window has delivered over the sample.
A stacked view of net returns alongside peak rallies and worst drawdowns shows how much room Apple has historically had to run, and how deep the dips have gone, inside this window.
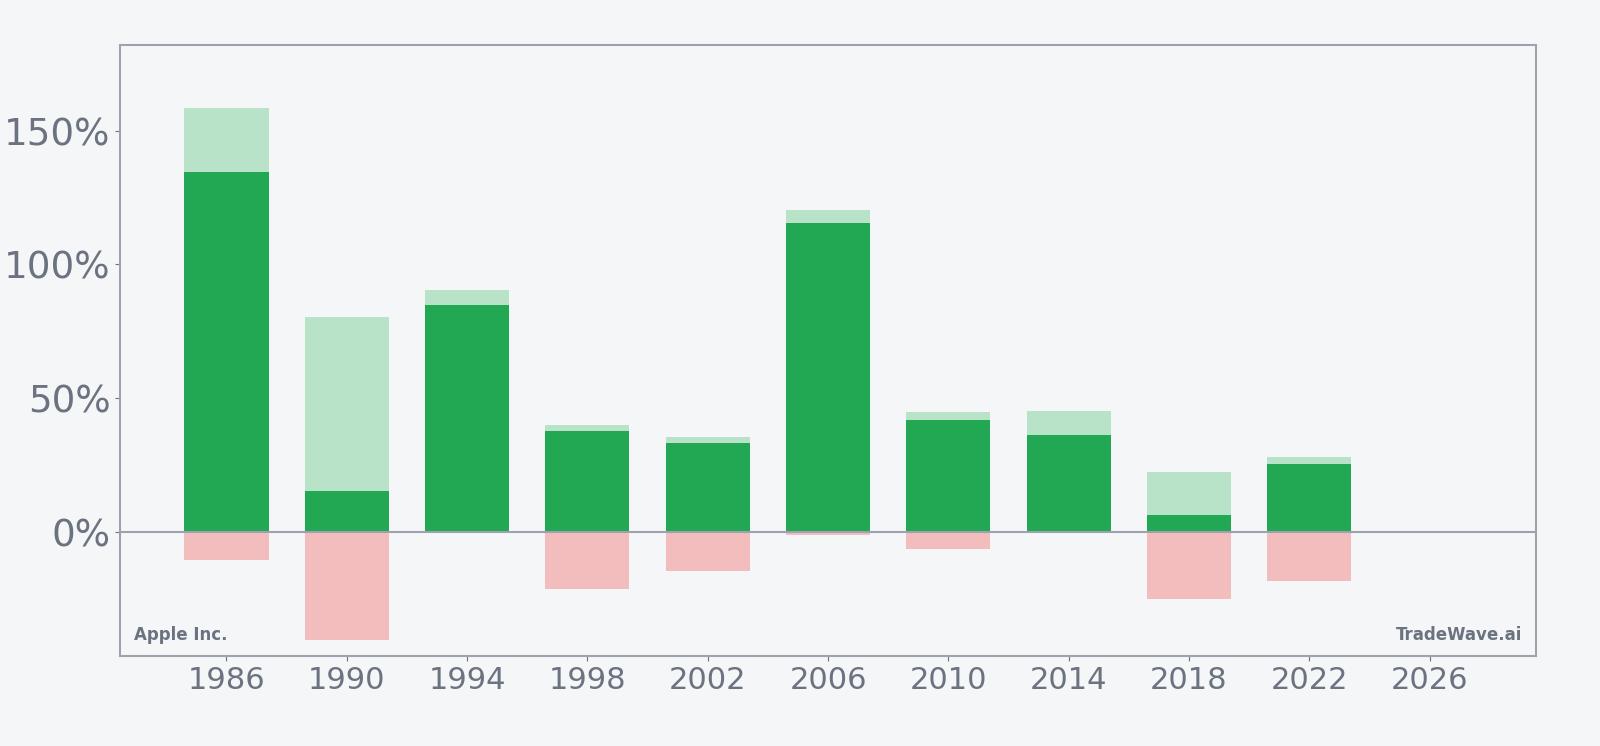
Across the per-year bars, the combination of strong net gains and sizable maximum favorable excursions, alongside occasional deep maximum adverse excursions, paints this as a historically bullish but volatile long regime for Apple Inc. Ten for ten is a rare record for any large-cap stock in a window this long, and that consistency is the single most important takeaway from this seasonal pattern.
History does not guarantee future results; adverse excursions (MAE) can be large even in winning windows.
Why does Apple Inc. (AAPL) follow this seasonal pattern?
One likely driver is the way Apple’s product and earnings calendar lines up with the political cycle, with major iPhone launches and holiday quarters often landing as policy uncertainty fades after the midterm election year. Analysts have also pointed to institutional portfolio rebalancing and renewed risk appetite in the pre-election year, which can funnel flows back into mega-cap tech leaders like Apple. This pattern may also reflect how consumer spending and corporate IT budgets recover once midterm-year volatility in rates and regulation gives way to a clearer policy path.
What is driving Apple Inc. (AAPL) today?
Apple Inc. shares closed the latest session at $310.66, down 0.6% on the day, after trading between $310.15 and $315.48 on volume of about 42 million shares. That leaves the stock roughly 2.1% below its 52-week high of $317.40, with the 50-day moving average sitting lower at $294.19 and 20-day average volume near 69.3 million shares, a setup that keeps Apple in a firm uptrend but with lighter trading than its recent norm.
In April 2026, Apple reported fiscal second-quarter revenue of $111.2 billion and earnings per share of $2.01, both ahead of Wall Street estimates, helped by strong iPhone 17 demand and solid Greater China performance.[1] The company highlighted a global memory shortage tied to AI data center build-out as a factor for the broader industry, underscoring how Apple’s supply chain is now intertwined with the same AI infrastructure boom driving other mega-cap tech names.[1] In February 2026, Wedbush described a prior Apple sell-off as “unwarranted” and argued that 2026 could be the company’s “year of AI,” pointing to new AI features and monetization opportunities as key catalysts for the stock.[6]
The chart below places the latest pullback in the context of Apple’s past year of trading and a short-term seasonal projection.
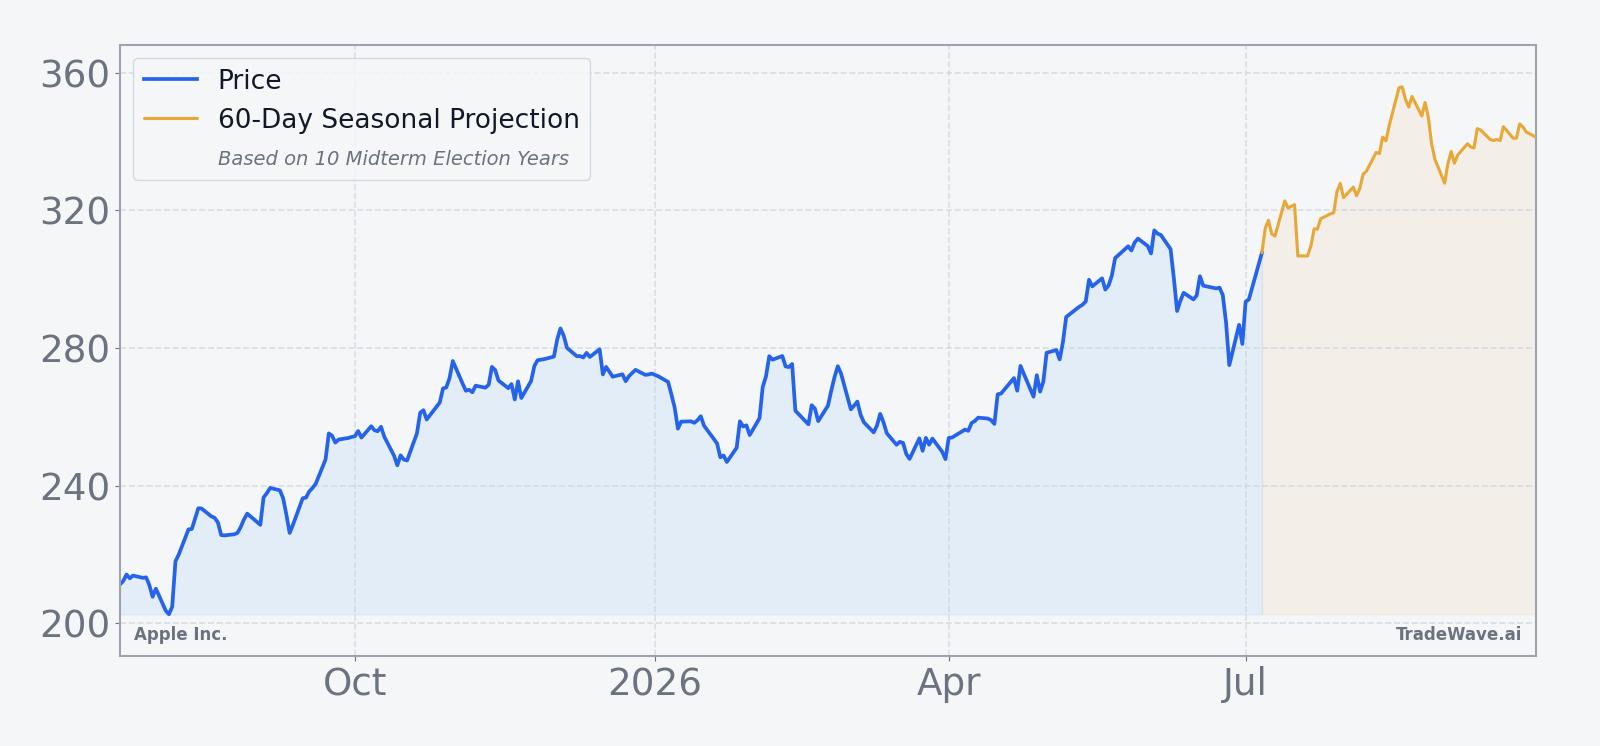
From a macro and policy standpoint, Apple sits at the center of several 2026 themes that intersect with this election-cycle seasonal pattern. The AI-driven memory shortage mentioned in the April report ties Apple’s hardware roadmap directly to data center investment and cloud spending, both of which are sensitive to fiscal and regulatory decisions in Washington.[1] At the same time, Apple’s role in consumer electronics and services means any shifts in tax policy, trade rules or digital regulation during the midterm election year can ripple quickly through its earnings outlook, which helps explain why the midterm-to-pre-election stretch has historically been such a distinct trading regime for the stock.
What should traders watch as this Apple Inc. seasonal window approaches?
First, the calendar: the 353-day midterm-election-year window for Apple Inc. begins on Jul 20, 2026, so price action in the next couple of weeks will set the starting point for a pattern that has never produced a losing year in this dataset. Second, levels: traders will be watching whether Apple can break and hold above the $317.40 52-week high as the window opens, or whether another rejection near that area signals a choppier start than the historical average. Third, catalysts: any updates on iPhone 17 demand, AI feature rollouts, or supply-chain constraints tied to the AI memory shortage could either reinforce or challenge the bullish historical seasonality, especially as investors weigh how Apple fits into the broader 2026 “year of AI” narrative.[1][6] Finally, behavior inside the window will matter: if Apple again delivers strong rallies with contained drawdowns, it would echo the prior 10 cycles, while a deep and persistent selloff would mark a clear break from the stock’s established midterm-year seasonal trend.
Sources
- Yahoo Finance: Apple tops Q2 earnings estimates on strong iPhone, China sales (Apr 30, 2026)
- Seeking Alpha: Apple projects 13%-16% revenue growth for March quarter as iPhone demand drives record results (Jan 29, 2026)
- Seeking Alpha: Apple Q3 revenue crushes estimates by nearly $5B, shares edge higher (Jul 31, 2025)
- Seeking Alpha: Apple plans new features for iPhone satellite services: report (Nov 10, 2025)
- Reuters: Apple revenue forecast beats estimates as iPhone sales soar (Jul 31, 2025)
- Seeking Alpha: Apple sell-off 'unwarranted,' as Wedbush says 2026 is the tech giant's year of AI (Feb 17, 2026)
- Business Insider: Apple is reporting earnings today after reaching a historic $4 trillion market cap (Oct 30, 2025)
- MarketWatch: With Apple stock near a record high as earnings loom, here’s the options trade to make (Oct 20, 2025)
- CNBC: Apple gave up its earnings pop. How to trade it from here (Oct 31, 2025)
- CNBC: Big volatility priced into Apple as earnings come into focus (Apr 30, 2026)
About this seasonal analysis
Seasonal pattern data is sourced from TradeWave.ai, which analyzes historical price behavior across annual calendar windows going back up to 30 years. Read the full data methodology or the book The 100-Year Pattern by Afshin Moshrefi (2026 edition). Past performance of seasonal patterns does not guarantee future results. This article is for informational purposes only and does not constitute investment advice.