McKesson Corporation (MCK) Has Risen in 6 of 6 Aug 2-Jul 15 Midterm Windows, Averaging 20.98% Gains
McKesson Corporation is trading about 14.3% below its 52-week high just as it moves into a midterm-year seasonal window that has never produced a losing year in the past six cycles.
Price as of Jul 31, 2026: $856.19 (last close).

What is the seasonal pattern for McKesson Corporation (MCK)?
McKesson Corporation has risen in 6 of 6 midterm-year Aug 2–Jul 15 windows, with an average gain of 20.98% in winning years.
- 6 for 6 in this window, averaging 20.98% gains in winning years across the last six midterm election cycles.
- Percent Profitable is 100%, with 6 winners and 0 losers in the Aug 2–Jul 15 McKesson Corporation trading window.
- Avg Profit of 20.98% compares with a 211% cumulative return from repeatedly holding only this seasonal slice.
- The TradeWave Ratio (TWR) of 3.24 signals that price has typically traveled meaningfully in the long direction within the window.
- A Sharpe ratio of 2.89 points to a historically strong risk-adjusted profile for this MCK seasonal trend.
- Individual years have still seen sizable intraperiod drawdowns, including a worst adverse move of about 27.77% in 2002 before finishing higher.
According to historical data from TradeWave.ai, this midterm-year stretch for McKesson Corporation has behaved very differently from an average calendar year. TradeWave.ai's seasonal database flags the Aug 2–Jul 15 window as one of the stock's most consistently positive regimes across the last six midterm election cycles.
How has McKesson Corporation (MCK) traded in the Aug 2–Jul 15 midterm-year window?
McKesson Corporation has finished higher in every single Aug 2–Jul 15 window across the last six midterm election years, averaging gains of 20.98% for long positions. The latest iteration of that 348-day window began on Aug 2 with the stock around 850 and it now trades at 856.19, about 14.3% below its 52-week high of 999.00. That combination of a strong historical seasonal pattern and a pullback from the highs is what makes this stretch stand out on the healthcare providers seasonal outlook.
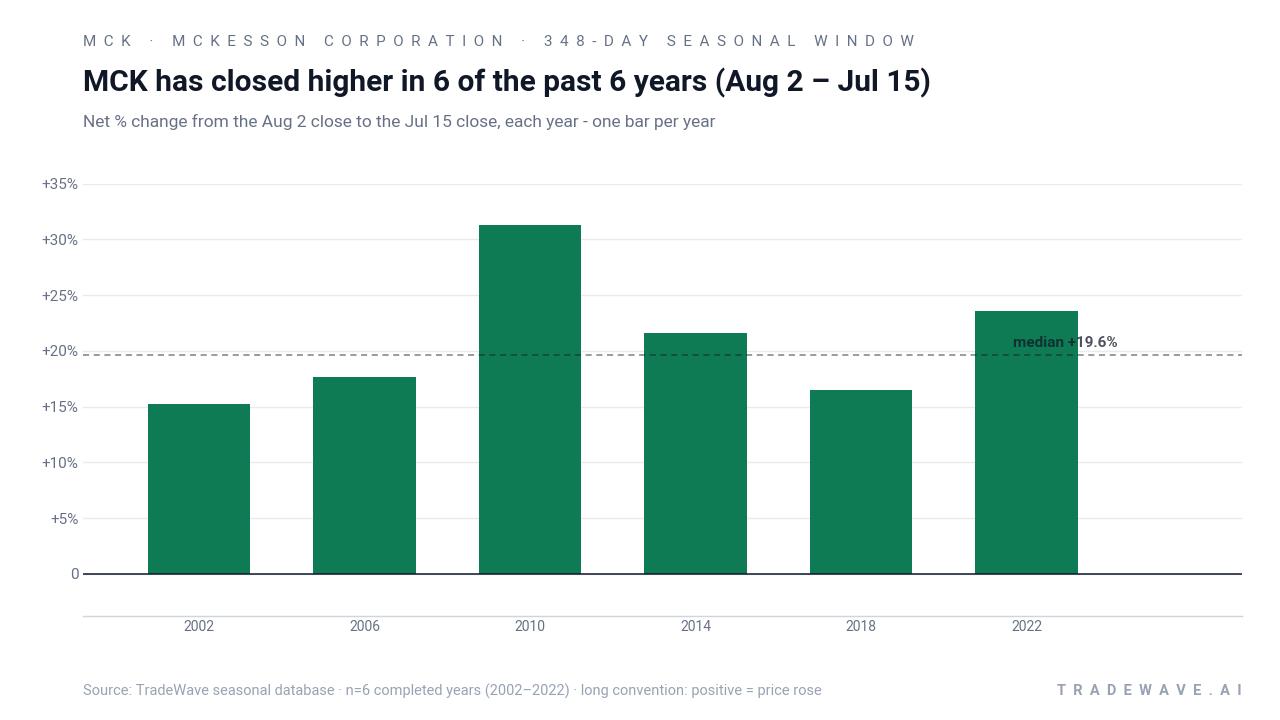
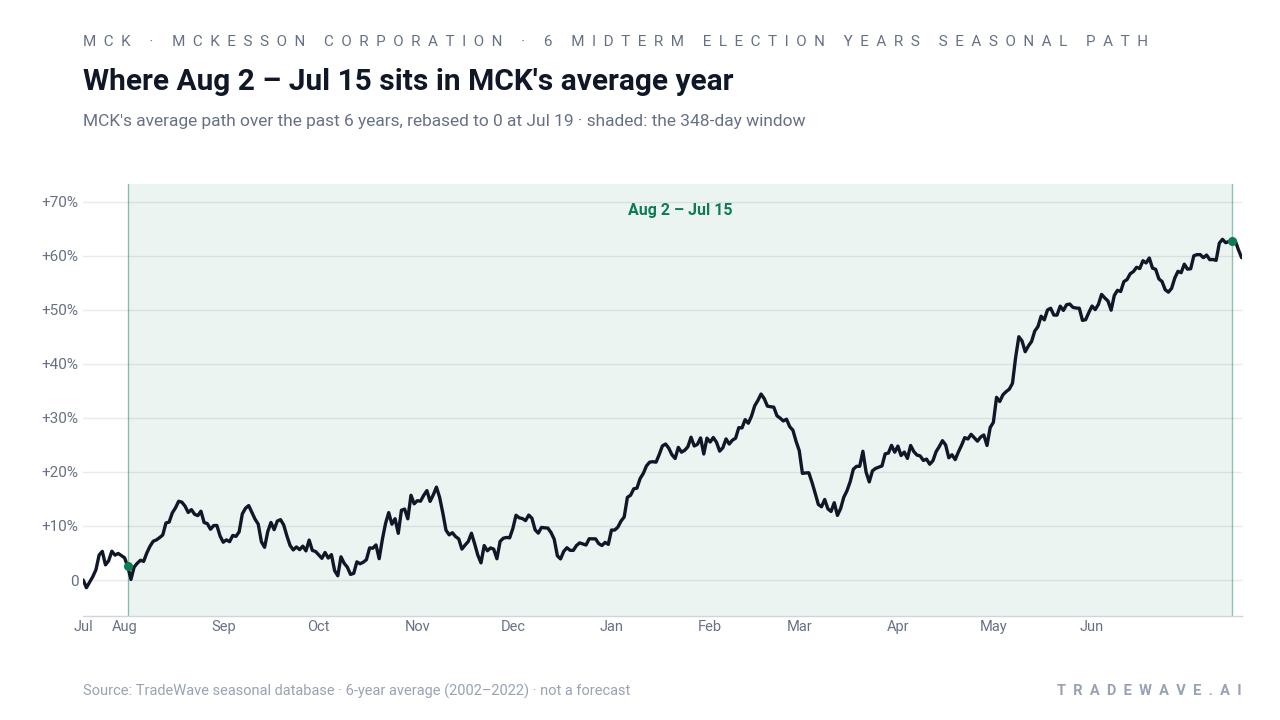
Because this pattern is grouped by the presidential election cycle, it only looks at midterm election years, which tend to feature heavier policy noise and reimbursement debates for healthcare distributors. For McKesson, the typical midterm-year playbook has been a long, grinding advance from late summer into the following July, rather than a quick earnings pop.
Year-by-year ranges show how much the stock has typically swung inside the window before finishing higher.
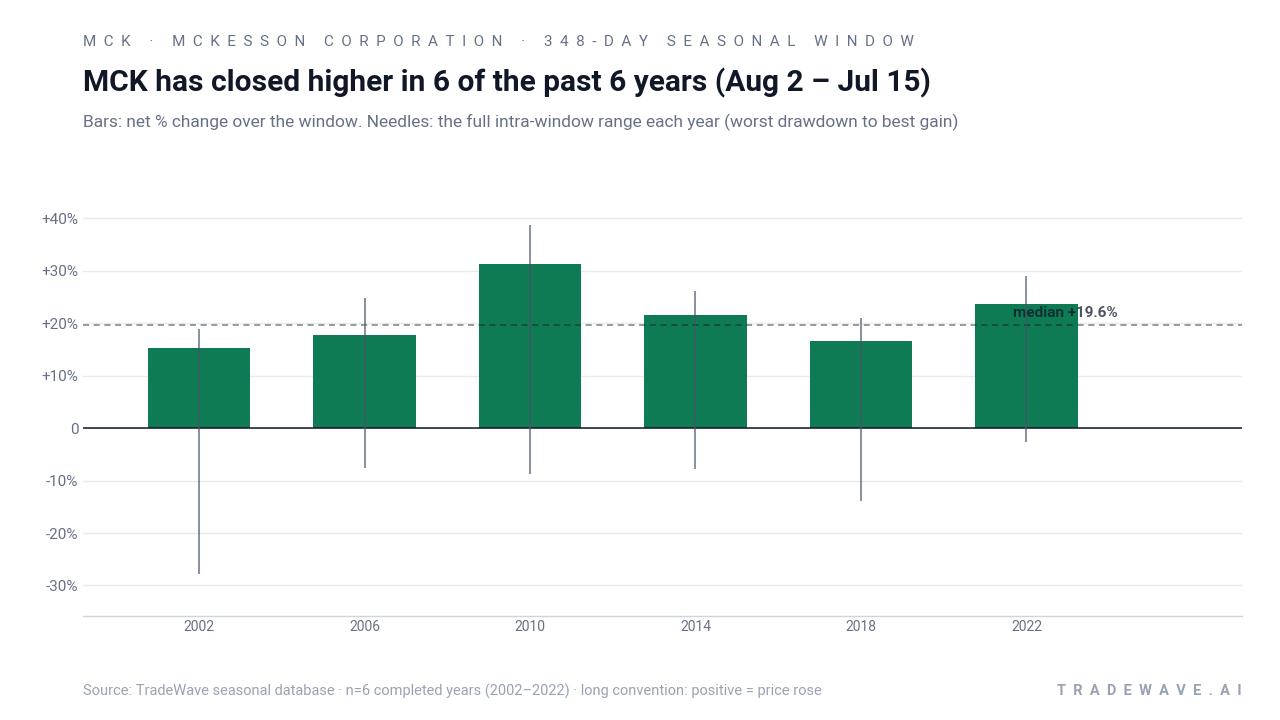
Across the six completed midterm-year windows, the strongest net gain came in 2010, when McKesson returned 31.26% between the Aug 2 entry and the Jul 15 exit, after reaching a best point-to-peak move of 38.63% and weathering a worst drawdown of 8.69% from entry. The softest outcome was still positive, a 15.23% gain in 2002, but that year also carried the deepest intraperiod hit, with the stock down as much as 27.77% at one point before recovering. That mix of strong finishes and sometimes sharp mid-window swings is exactly what the MFE and MAE profile is flagging.
The cumulative chart of this McKesson Corporation trading window shows what happens if an investor had only held the stock during this specific slice of each midterm election year. Stacking the six completed windows compounds to roughly 211% total return, which is unusually high for a single recurring calendar regime. Add it up: six midterm-year windows, six wins, and a long-only seasonal strategy that has historically delivered double-digit gains more often than not.
History does not guarantee future results; adverse excursions (MAE) can be large even in winning windows.
Why does McKesson Corporation (MCK) follow this seasonal pattern?
One likely driver is the way healthcare distributors sit at the intersection of policy and spending in midterm election years, when Washington often debates reimbursement formulas and drug pricing but rarely delivers immediate structural change. Analysts have also pointed to the clustering of McKesson’s fiscal-year guidance updates and large-cap healthcare portfolio rebalancing in the back half of the year, which can funnel steady institutional demand into this window.[2] The pattern may also reflect a broader risk-on tilt that often emerges as midterm uncertainty fades and investors rotate back into defensive growth names like McKesson.
What is driving McKesson Corporation (MCK) today?
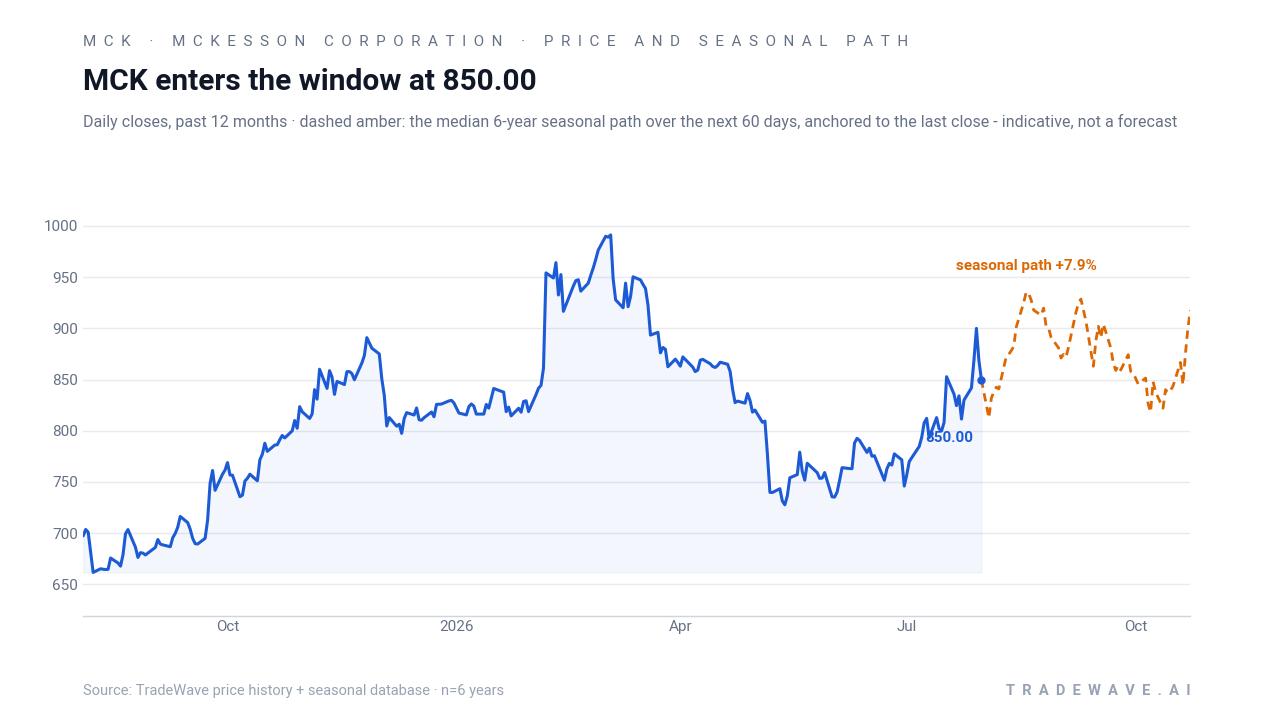
McKesson Corporation shares closed Monday at 856.19, down 1.1% on the day, leaving the stock about 14.3% below its 52-week high of 999.00 and well above its 52-week low near 633.26. The pullback comes just two days before the company is scheduled to report quarterly earnings on Aug 5, with Wall Street looking for roughly $9.44 in EPS on $104.39 billion in revenue, which would mark continued year-over-year growth for the drug distributor.[3] In June, McKesson reported fiscal Q4 revenue of $96.3 billion and full-year sales of $403.4 billion, with EPS of $13.71 for the quarter and $38.38 for the year, numbers that several analysts described as solid against a backdrop of reimbursement pressure and sector multiple compression.[2]
Analyst sentiment remains constructive heading into this midterm-year seasonal window. MarketBeat data compiled in early July showed a “Moderate Buy” consensus rating on McKesson and a blended price target around $960.53, implying upside from current levels even after the stock’s strong multi-year run.[1] Zacks and Yahoo Finance coverage through July highlighted McKesson as a trending healthcare providers name, citing its scale, consistent earnings delivery and exposure to secular demand from an aging population, while also flagging reimbursement and labor costs as ongoing risks for margins.[4][6][7][11]
The chart below situates the latest move in its recent multi-month context and overlays the median 60-day seasonal path for this window.
What should traders watch in this McKesson Corporation seasonal window?
The first checkpoint is Wednesday’s earnings report and any update to McKesson’s long-range plan, which could either reinforce or blunt the historical midterm-year seasonal strength if guidance shifts meaningfully.[2][3] Price-wise, traders will be watching how the stock behaves around the 800–900 band that has defined recent trading; a sustained push back toward the 52-week high near 999.00 would be more in line with the historical pattern, while a break toward the low 700s would mark a clear deviation. On the policy side, any fresh headlines on drug pricing, reimbursement formulas or Medicare negotiations could inject volatility into this window, especially given the sector’s sensitivity to Washington’s fiscal stance.[11] Finally, behavior inside the window will matter: if McKesson once again grinds higher after any early drawdowns, it would echo the prior six midterm-year cycles, while a flat or sharply negative path would be a rare break from a pattern that, so far, has been six for six.
Sources
- MarketBeat: Dividend Assets Capital LLC Invests $3.55 Million in McKesson Corporation (MCK) (Jul 6, 2026).
- Yahoo Finance: Here is What Analysts Are Saying About McKesson Corporation (MCK) (Jun 5, 2026).
- Yahoo Finance (SG): McKesson (MCK) Stock Dips While Market Gains: Key Facts (Jul 31, 2026).
- Zacks: What is the current Price Target and Forecast for McKesson (MCK) (Aug 1, 2026).
- ChartMill: McKesson Corp (NYSE:MCK): A Strong Growth Stock Nears a Technical Breakout (Apr 9, 2026).
- Yahoo Finance: McKesson Corporation (MCK) Is a Trending Stock: Facts to Know Before Betting on It (Jul 4, 2026).
- Yahoo Finance: McKesson Corporation (MCK) is Attracting Investor Attention: Here is What You Should Know (Jul 13, 2026).
- Yahoo Finance: Healthcare providers & services sector overview including McKesson (Jul 13, 2026).
About this seasonal analysis
Seasonal pattern data is sourced from TradeWave.ai, which analyzes historical price behavior across annual calendar windows going back up to 30 years. Read the full data methodology or the book The 100-Year Pattern by Afshin Moshrefi (2026 edition). Past performance of seasonal patterns does not guarantee future results. This article is for informational purposes only and does not constitute investment advice.