Amphenol (APH) Has Rallied in 8 of 8 Midterm Aug 28-Apr 2 Runs, Averaging 14.96% Gains
Amphenol shares just jumped more than 6% and sit about 10.5% below their 52-week high as the stock approaches a midterm-year seasonal window that has never produced a losing run in the past eight cycles.
Price as of Jul 30, 2026: $159.82 (last close).

What is the seasonal pattern for Amphenol (APH)?
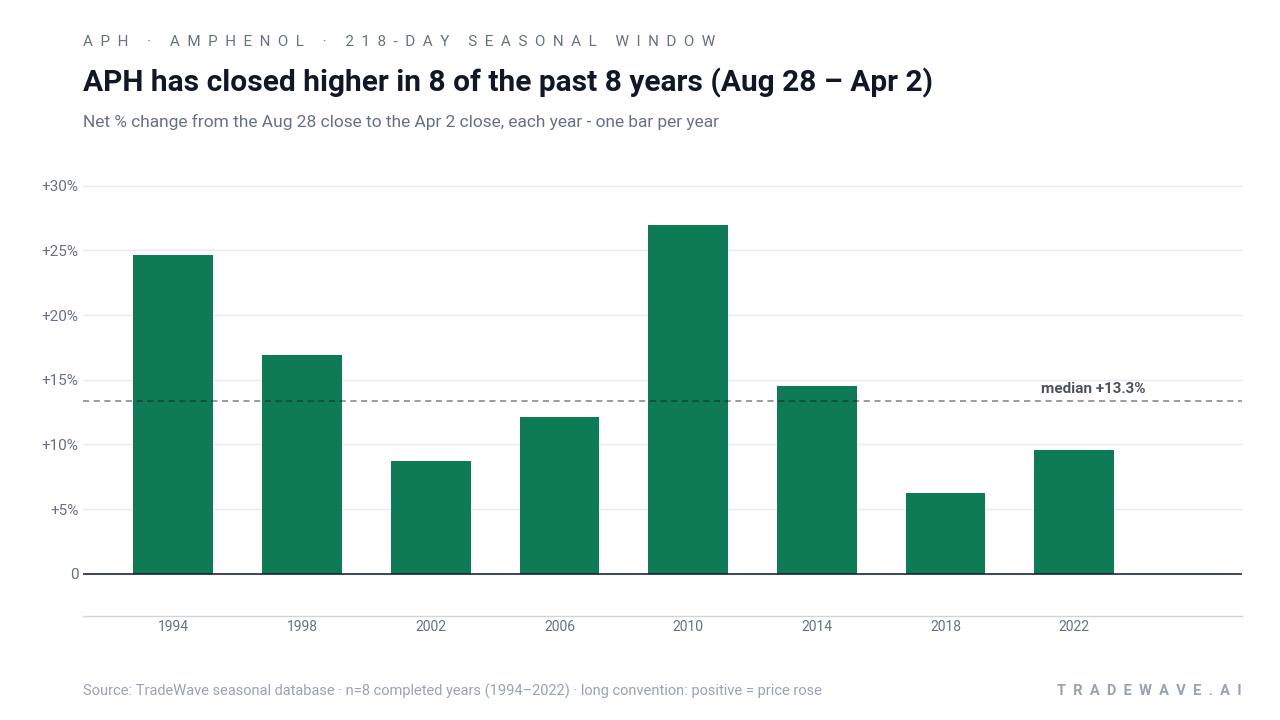
Amphenol has risen in 8 of 8 midterm-election-year windows running from Aug 28 to Apr 2, with an average gain of 14.96% in winning years.
- 8 for 8 in this window, with Amphenol averaging 14.96% gains across all winning years.
- Seasonal window runs 218 days from Aug 28 to Apr 2 in the last 8 midterm election years.
- Percent Profitable is 100%, with 8 winners and 0 losers in the historical sample.
- Trade Direction is long, supported by a TradeWave Ratio of 1.6 and a Sharpe ratio of 1.68.
- Individual years have seen strong upside bursts, but some windows included double-digit drawdowns before finishing higher.
- Cumulative gains from stacking this specific window across cycles add up to roughly 200%.
According to historical data from TradeWave.ai, this midterm-election-year stretch has behaved very differently from an average calendar period for Amphenol, and the next iteration is less than a month away.
How strong is Amphenol (APH) in the upcoming Aug 28 seasonal window?
Amphenol has closed higher in every single Aug 28 to Apr 2 midterm-election-year window since 1994, averaging gains of 14.96% across eight cycles. Today the stock finished at 159.82, up 6.3% on the session and trading about 10.5% below its 52-week high of 178.52. With that backdrop, the next 218-day window starting Aug 28 looks less like a quirky calendar stat and more like a defined regime that has repeatedly rewarded long exposure in this name.
Grouping the data by the presidential election cycle matters here because this is a midterm election year, and policy uncertainty, spending debates and sector rotation often cluster differently in mid-cycle than in election or pre-election years. The Aug 28 to Apr 2 window sits in the back half of the midterm year and runs into the early part of the year before the presidential election, a span that has often coincided with improving risk appetite in cyclical and tech hardware names.
This seasonal window begins on Aug 28 and spans 218 days. Historically, during this period in the last eight midterm election years, Amphenol has shown a strong bullish tendency in line with the long trade direction. Percent Profitable is 100%, with 8 winners and 0 losers, so every completed midterm-year run in this slice of the calendar has finished higher. Average profit of 14.96% means that across those eight windows, the typical gain from the Aug 28 close to the Apr 2 close has been just under 15% for long positions.
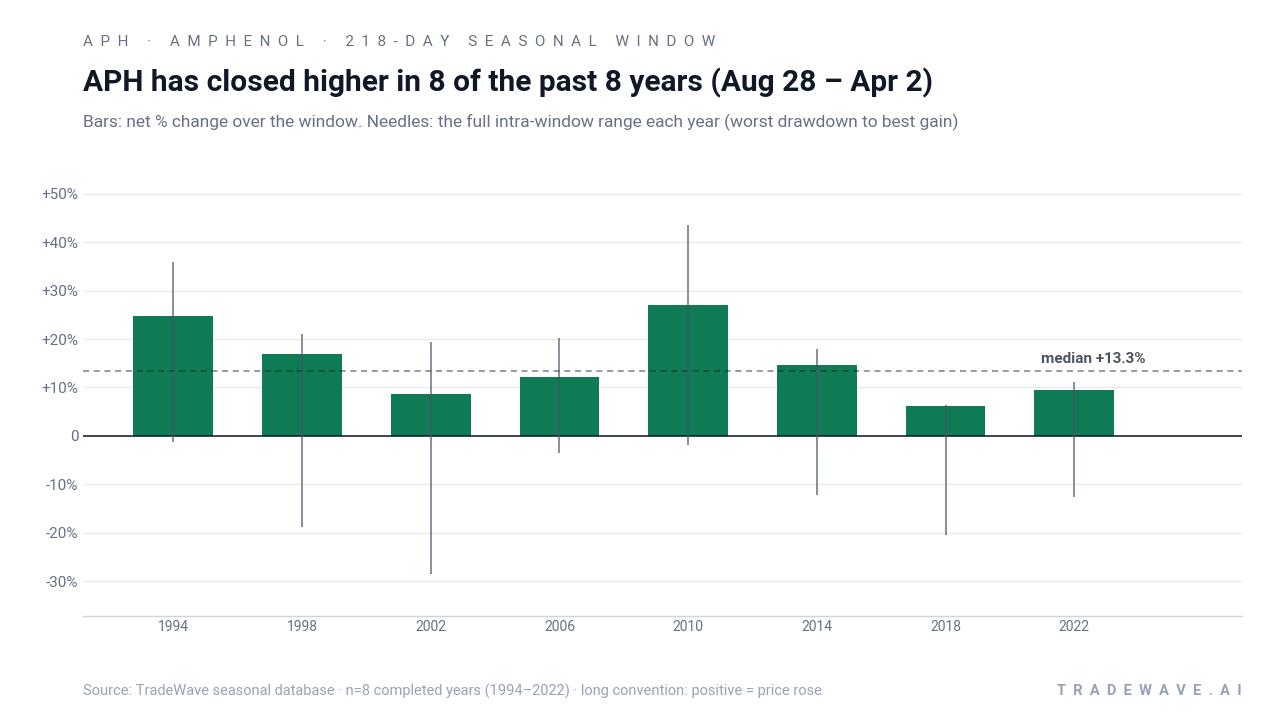
The per-year record shows how that plays out in practice. The strongest window came in 2010, when Amphenol gained 26.94% between entry and exit, with a maximum favorable move of 43.45% at the best point in the window. The softest outcome was 2018, which still finished up 6.23% but saw a relatively modest maximum favorable move of 6.35% and a deeper intraperiod drawdown.
Intraperiod swings have not been trivial. In 2002, the stock ultimately gained 8.7% over the window, but the worst drawdown from the entry price reached 28.47% at one point. Several other years, including 1998, 2014 and 2018, also saw double-digit adverse moves before recovering to finish positive. That is where the MFE/MAE profile matters: maximum favorable excursions have often been large, but the worst adverse excursions have sometimes been large too, underscoring that this has been a high-conviction but not low-volatility stretch.
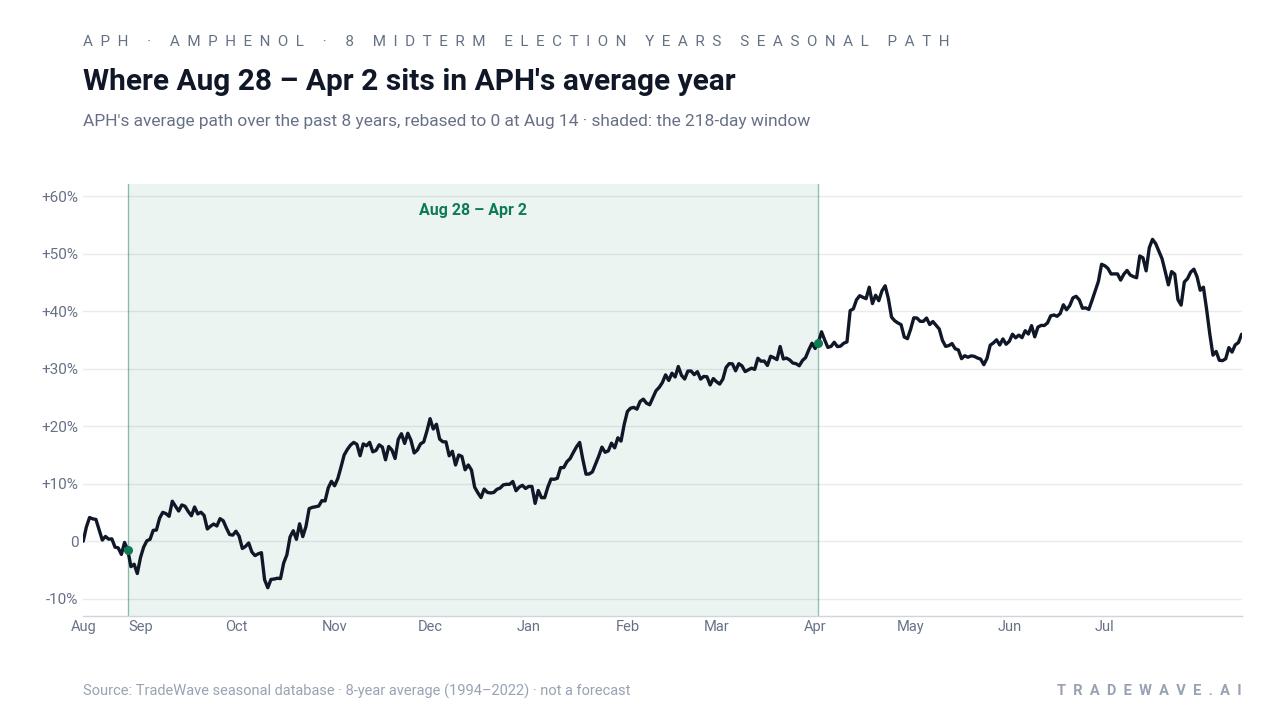
The trend chart of the average year in this window shows a pattern of early strength that tends to build as the calendar moves through the fourth quarter and into the first quarter of the year before the presidential election. The typical path is not a straight line, but the bias is upward, with pullbacks along the way that have historically been followed by renewed gains rather than prolonged breakdowns.
Year-by-year bars with full intraperiod ranges show how upside and drawdowns have coexisted in this window.
The cumulative chart of this midterm-year window compounds to roughly 200% across the eight-sample history, which is what you get by stacking each 218-day run back-to-back. Add it up: eight straight wins, double-digit average gains and a long-only profile that has historically rewarded patience through volatility. History does not guarantee future results, but the consistency across cycles is hard to ignore.
History does not guarantee future results; adverse excursions (MAE) can be large even in winning windows.
Why does Amphenol (APH) follow this seasonal pattern?
One likely driver is the way Amphenol’s earnings calendar and capital spending cycles line up with the broader presidential election cycle. Analysts have pointed to networking, storage and AI-related demand as key themes, and those budgets often get locked in during the back half of the midterm year and the run-up to the presidential election, which can support orders and sentiment into spring.[2][3] The pattern may also reflect institutional portfolio repositioning around fiscal year-ends, when investors lean into high-quality tech hardware names as visibility on the next year’s spending improves.
What is driving Amphenol (APH) today?
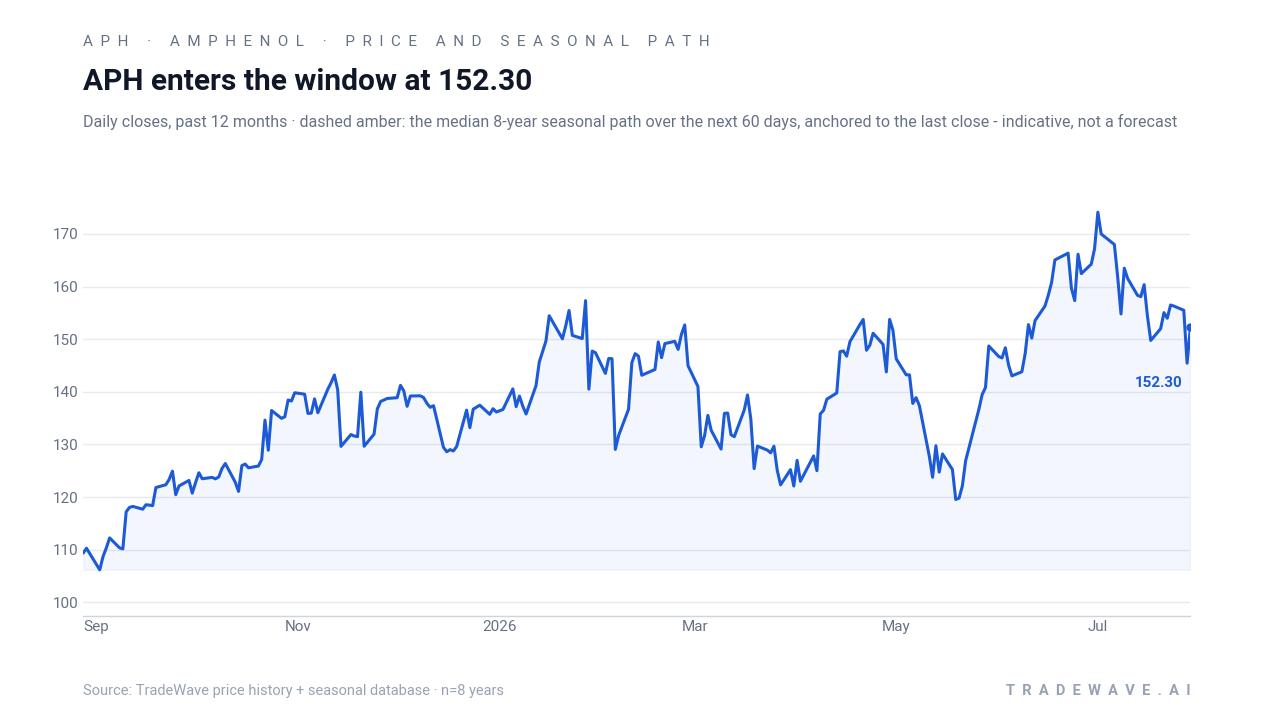
Amphenol closed Friday at 159.82, up 9.51 points or 6.3% on the day, with roughly 10.7 million shares changing hands versus a 20-day average volume of about 6.7 million. The stock is about 10.5% below its 52-week high of 178.52 and well above its 52-week low near 101.37, trading modestly above its 50-day moving average around 152.13, which keeps the broader uptrend intact.
The near-term driver is earnings. Amphenol was scheduled to report fiscal second-quarter 2026 results around late July, with previews flagging expectations for adjusted EPS of about $1.16 versus $0.81 a year earlier and strong year-on-year revenue growth after a prior quarter that saw sales jump 58.4%.[1][2] Analysts have been leaning into the story around networking infrastructure, storage components and AI-related content, arguing that these end markets give Amphenol leverage to data center and cloud build-outs as well as automotive and industrial connectivity demand.[2][3]
On the sell-side, Simply Wall St’s aggregation of broker targets cited a consensus price objective around 189.39, reflecting a constructive medium-term view even after the stock’s run into earnings.[3] Sector commentary has also been broadly positive, with Amphenol framed as a diversified tech hardware and electronics supplier that benefits from multiple secular themes rather than a single product cycle.[1][2] That mix has helped the stock hold up better than some more cyclical peers during bouts of macro volatility.
One counterpoint is insider activity. MarketBeat filings show that CEO Richard Adam Norwitt sold 61,072 shares on May 1 at an average price of $143.90, part of roughly 130,775 shares insiders have sold over the past 90 days, even though insiders still own about 1.42% of the company.[4][5] Insider selling does not automatically signal trouble, but in a stock that has rallied hard into a historically strong seasonal window, traders will be watching whether executives continue to trim positions or step back.
The chart below situates the latest move against the past year of trading and the median 60-day seasonal path.
What should traders watch as the Aug 28 window approaches?
First, the calendar. The upcoming 218-day window begins on Aug 28 and runs through Apr 2, covering the back half of this midterm election year and the early months of the year before the presidential election. Historically, that has been a constructive phase for risk assets as policy uncertainty starts to clear and investors look ahead to potential fiscal and regulatory shifts.
Second, earnings follow-through. If Amphenol can back up the bullish expectations around Q2 with solid numbers and guidance that keeps fiscal 2026 EPS tracking toward the roughly $4.76 analysts expect, it would align the fundamental story with the bullish seasonal backdrop.[1][2] Weak guidance or signs of slowing AI and networking demand would not erase the historical pattern, but it would make it harder for the stock to track the typical midterm-year seasonal trend.
Third, price levels. On the upside, traders will be watching whether Amphenol can retest the 52-week high near 178.52 as the window opens and then hold any breakout rather than slipping back into the prior range. On the downside, the 50-day moving average around 152 and the zone around 140, where the CEO’s May sale took place, are likely to be viewed as important support bands if volatility picks up.[4][5]
Finally, insider and positioning signals. Continued insider selling at higher prices or a sharp shift in institutional holdings would be a sign that some large holders are using strength into the seasonal window to lighten up, which could blunt the historical pattern’s impact.[4][5] Conversely, if insider activity stabilizes and flows into tech hardware and electronics funds remain steady, it would suggest that the long-running Aug 28 to Apr 2 seasonal trend still has room to matter in this cycle.
Sources
- Barchart – Earnings Preview: What To Expect From Amphenol's Report (Jun 30, 2026)
- Yahoo Finance / StockStory – Earnings To Watch: Amphenol (APH) Reports Q2 Results Tomorrow (Jul 29, 2026)
- Yahoo Finance / Simply Wall St – Amphenol (APH) Stock Sees Modest Fair Value Lift After Analyst Target Increases (Jul 29, 2026)
- MarketBeat – Amphenol Corporation $APH Shares Sold by Epoch Investment Partners Inc. (Jul 26, 2026)
- MarketBeat – Livforsakringsbolaget Skandia Omsesidigt Has $5.24 Million Stock Holdings in Amphenol Corporation $APH (Jul 15, 2026)
About this seasonal analysis
Seasonal pattern data is sourced from TradeWave.ai, which analyzes historical price behavior across annual calendar windows going back up to 30 years. Read the full data methodology or the book The 100-Year Pattern by Afshin Moshrefi (2026 edition). Past performance of seasonal patterns does not guarantee future results. This article is for informational purposes only and does not constitute investment advice.