9-for-9 Midterm Win Streak: Microsoft (MSFT) Enters 354-Day Window Averaging 35.95% Gains
Microsoft is entering a historically powerful 354-day midterm-year trading window just as AI-fueled earnings momentum collides with a stock still well below its 52-week high.
Price as of Jul 31, 2026: $464.72 (last close).

What is the seasonal pattern for Microsoft (MSFT)?
Microsoft has risen in 9 of 9 midterm-year windows starting Aug 3 and lasting 354 days, with an average gain of 35.95% in winning years.
- 9 for 9 in this window, with Microsoft gaining an average 35.95% in each winning year across the last 9 midterm election cycles.
- Percent Profitable is 100%, with 9 winners and 0 losers over the Aug 3 to Jul 22 trading window.
- The pattern is long-biased, with a Trade Direction of “long” and a TradeWave Ratio of 1.32, indicating strong historical travel in the upside direction within the window.
- The Sharpe ratio of 1.26 reflects a favorable risk-adjusted profile for this specific Microsoft seasonal trend.
- Individual years have seen net gains ranging from about 7.78% to 75.42%, showing both consistency and the potential for outsized upside.
- The window sits in the midterm election year, a phase where policy and spending decisions often reshape tech and AI leadership narratives.
According to historical data from TradeWave.ai, this midterm-year stretch has behaved very differently from an average year for Microsoft, with a distinct long-biased seasonal profile that traders rarely see discussed in day-to-day coverage.
How strong is this midterm-year seasonal window for Microsoft (MSFT)?
Microsoft has closed higher in every single Aug 3 to Jul 22 midterm-year window across the last 9 cycles, averaging a 35.95% gain with no losing years. Shares finished Monday at 464.72, up 3.0% on the day and about 15.0% below their 52-week high of 546.77, leaving room above if the historical pattern repeats.
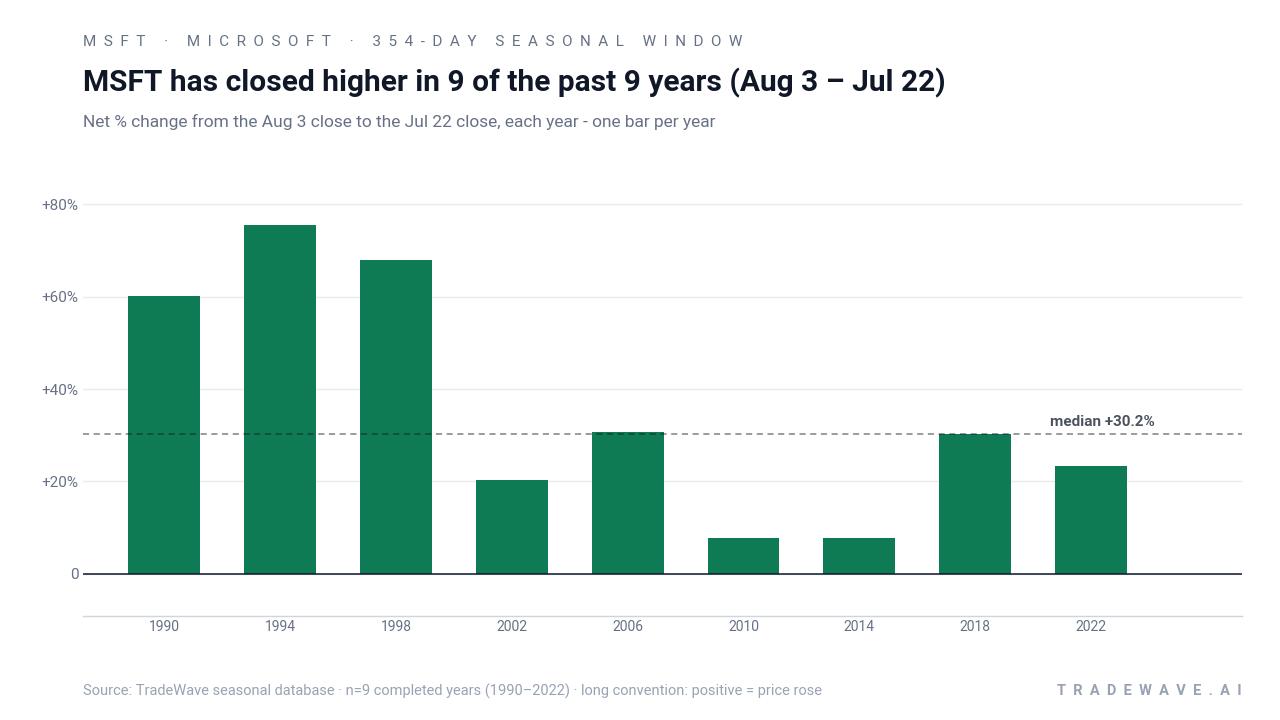
Grouping the data by the presidential election cycle matters here because this window sits in the midterm election year, when Washington’s policy mix on spending, regulation and AI infrastructure often shifts and can reshape leadership within mega-cap tech. The pattern phase in this study is “the last 9 midterm election years,” while the calendar phase is also a midterm election year, so the historical and current backdrops line up cleanly.
Across those 9 midterm-year windows, Microsoft’s trade direction is long, and every completed sample has been profitable. Percent Profitable is 100%, with 9 winners and 0 losers, and the average gain across all years is 35.95%, helped by several outsized rallies. The median profit of 30.21% shows that even when you strip out the biggest outliers, the typical outcome has still been a double-digit advance.
Individual years show how wide the range can be. The strongest midterm-year window in this sample was 1994, when Microsoft gained 75.42% between the early August entry and the late July exit, while 1990 and 1998 also delivered gains above 60%. On the softer side, 2010 and 2014 still finished higher by 7.78% each, underscoring that even the “quiet” years in this pattern have not been flat.
The volatility profile inside the window is just as important as the final score. Maximum favorable moves have reached as high as 104.69% in 1994 and 85.82% in 1998, showing that in strong years the stock has often pushed far beyond its eventual close before consolidating. On the downside, maximum adverse moves have ranged from shallow dips of around 0.25% in 2006 to deeper drawdowns of roughly 24.28% in 2022, reminding traders that even winning years have included meaningful pullbacks.
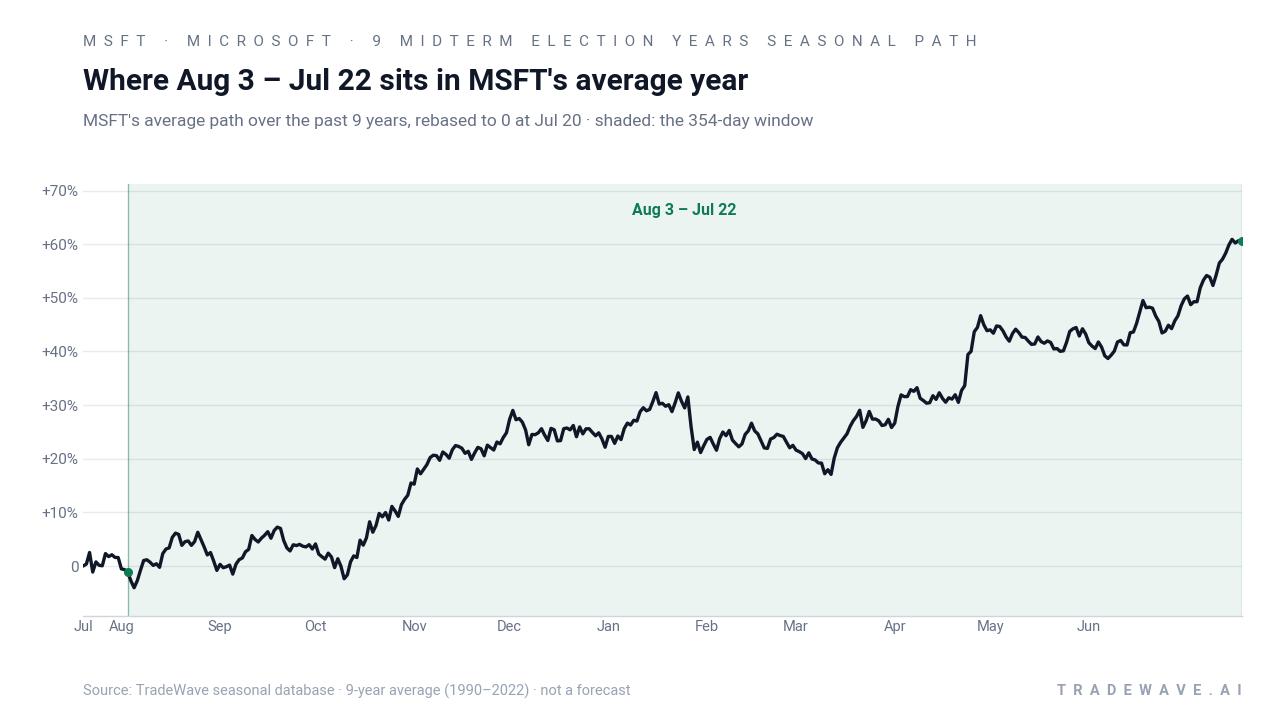
The historical trend view suggests that strength in this Microsoft trading window tends to build over time rather than spike in a single burst. The average path across the 9 midterm-year samples shows a steady upward drift, with gains accruing through the middle of the window and often accelerating into the final third as the calendar transitions from the midterm election year into the year before the presidential election, a phase that has often been supportive for risk assets.
Year-by-year ranges show how far Microsoft has tended to run in both directions before the window closes.
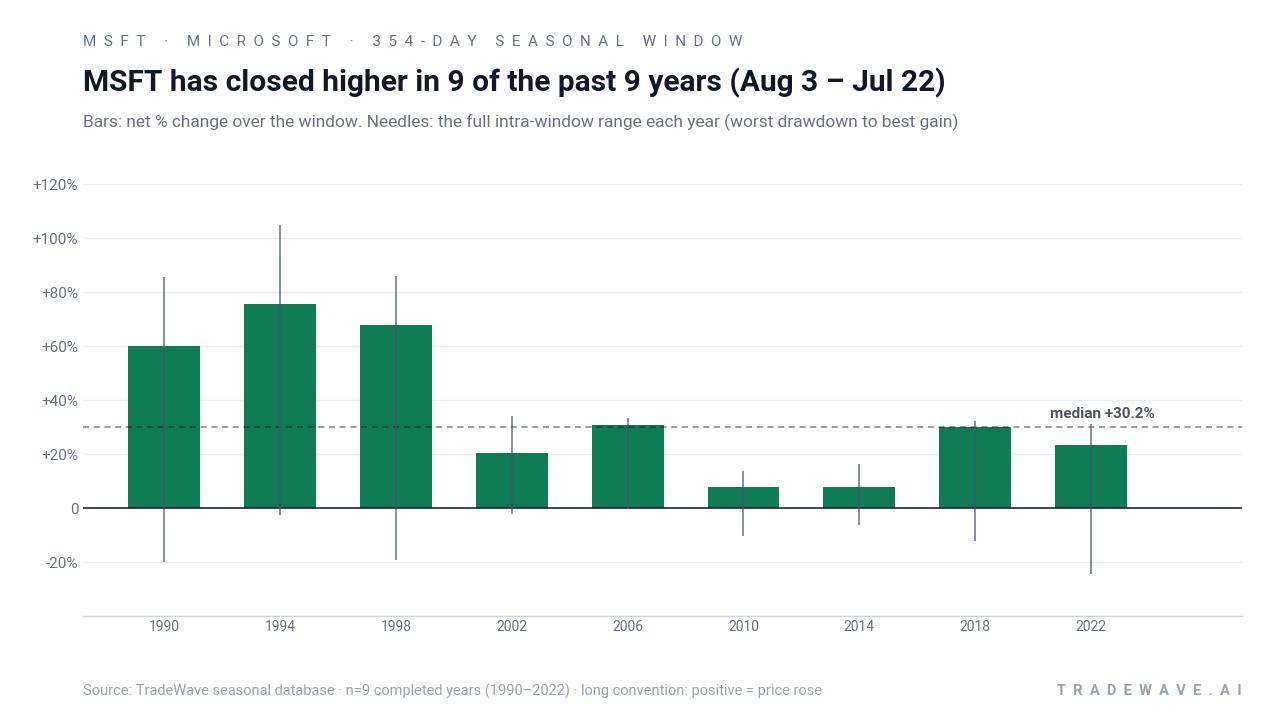
History does not guarantee future results; adverse excursions can be large even in winning windows, and Microsoft has previously seen drawdowns above 20% inside this pattern.
Why does Microsoft (MSFT) follow this seasonal pattern?
One likely driver is the way Microsoft’s fiscal calendar and product cycle line up with the U.S. political cycle, concentrating key cloud and AI spending decisions into the midterm and pre-election years. Analysts have pointed to institutional portfolio repositioning around midterm-year volatility, followed by renewed risk appetite as policy uncertainty clears and tech budgets reset, which can favor mega-cap platforms like Microsoft.[1][2] The pattern may also reflect how enterprise customers lock in multi-year Azure and Copilot commitments after midyear budget reviews, creating a tailwind that often shows up in the stock over the following four quarters.[2][9]
What is driving Microsoft (MSFT) today?
Microsoft closed Monday at 464.72, up 3.0% on the session, extending a sharp post-earnings rebound even though the stock remains down 3.91% year to date and about 15.0% below its 52-week high of 546.77. The move follows a blowout fiscal Q4 report on Jul 29 that delivered roughly $90 billion in revenue, 18% year-on-year growth and earnings per share well ahead of expectations, powered by about 43% Azure growth and strong AI demand.[2][5][9] Management also emphasized that free cash flow stayed robust at $19.6 billion despite heavy AI-related capital spending and guided to remain free cash flow positive in fiscal 2027, easing concerns that the AI build-out could swamp returns.[2][5]
Investors have zeroed in on Microsoft’s AI and cybersecurity positioning as the next leg of the story. Satya Nadella highlighted Copilot adoption and new security offerings as core growth engines, while the company reported more than 30 million paid Copilot seats and a shift toward seat-plus-consumption pricing that could deepen monetization over time.[2][9] Analysts at major Wall Street firms framed the quarter as a potential turning point for a stock that had lagged some AI peers, arguing that accelerating Azure growth and clearer AI economics support a “Strong Buy” consensus and a roughly $547.45 average price target, according to Barchart’s summary of coverage.[1][2]
Market reaction has been dramatic. On Jul 31, Microsoft logged its biggest one-day gain since 2008, adding hundreds of billions of dollars in market value as investors rushed back into the name after the earnings surprise and upbeat AI commentary.[6] That surge came alongside broader equity strength as Microsoft’s results helped ease worries that AI infrastructure spending might crush margins across big tech, with some strategists arguing that the company’s mix of first-party silicon, diversified AI models and disciplined capital allocation could set a template for the sector.[2][7]
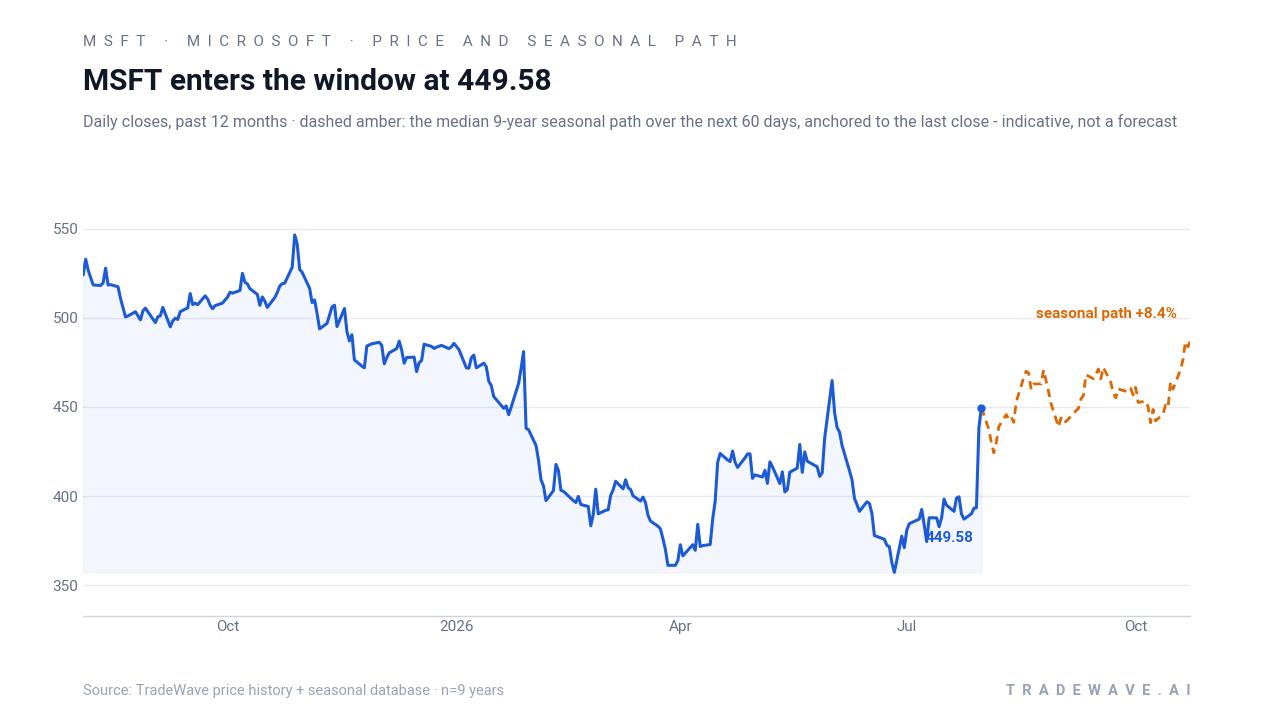
The chart below situates the latest move in its recent multi-month context, alongside the median 60-day seasonal path for this window.
What should traders watch in this Microsoft (MSFT) seasonal window?
First, watch how Microsoft trades around key policy and macro dates in this midterm election year, including any shifts in AI regulation, cloud security standards or federal tech spending that could influence enterprise demand. Second, monitor whether Azure growth and Copilot monetization stay near the mid-40% guidance band in upcoming quarters, since prior midterm-year windows have often been strongest when fundamental momentum and the seasonal pattern pointed in the same direction.[2][9] Third, keep an eye on volatility: intraperiod drawdowns have historically reached into the low-20% range even in winning years, so how the stock behaves on pullbacks will be a key tell for whether this cycle is tracking the historical MSFT seasonal trend or breaking from it.
If the stock continues to attract heavy post-earnings interest similar to the late-July surge, sustained volume and follow-through on big up days would signal that institutional positioning is leaning into both the AI story and the historically strong midterm-year window.[6] Conversely, if rallies fade quickly or drawdowns deepen beyond the typical historical range, that would be an early sign that this iteration of the pattern may be more volatile than prior cycles. For traders, the combination of a 9-for-9 seasonal record, a still-elevated AI capex cycle and a stock trading well below its 52-week high makes this 354-day Microsoft trading window one of the more consequential setups on the tech calendar.
Sources
- CNBC, “Analysts say Microsoft’s earnings may be a turning point for the struggling tech stock,” Jul 30, 2026.
- Barchart, “Microsoft's AI Cybersecurity Push Could Become a Major Growth Driver for MSFT Stock,” Aug 1, 2026.
- MarketWatch, “Microsoft Corp. Stock Quote (U.S.: Nasdaq) - MSFT,” Aug 2, 2026.
- Seeking Alpha, “Microsoft: Time To Be Greedy (NASDAQ:MSFT),” Jul 29, 2026.
- The Motley Fool, “$19.6 Billion: The Microsoft Earnings Number That Matters Most,” Jul 30, 2026.
- Fortune, “Microsoft's stock has biggest one-day gain since 2008 ...,” Jul 31, 2026.
- Barchart, “Stocks Rebound as Microsoft Earnings Ease AI Spending Concerns,” Jul 30, 2026.
- Microsoft Investor Relations, “Microsoft Annual Report 2025,” Oct 21, 2025.
- Yahoo Finance, “Microsoft Corp (MSFT) (Q4 2026) Earnings Call Highlights: Record Revenue Surpasses $331 ...,” Jul 31, 2026.
About this seasonal analysis
Seasonal pattern data is sourced from TradeWave.ai, which analyzes historical price behavior across annual calendar windows going back up to 30 years. Read the full data methodology or the book The 100-Year Pattern by Afshin Moshrefi (2026 edition). Past performance of seasonal patterns does not guarantee future results. This article is for informational purposes only and does not constitute investment advice.