Microsoft (MSFT) Has Rallied in 9 Straight Midterm Windows, Averaging 35% Gains
Microsoft is approaching a historically powerful midterm-year seasonal window just as AI-fueled earnings beat expectations and the stock trades well below its 52-week high.
Price as of Jul 29, 2026: $390.54 (last close).

What is the seasonal pattern for Microsoft (MSFT)?
Microsoft has risen in 9 of 9 midterm-year windows starting around Aug 1, with an average gain of 35.16% in winning years.
- 9 for 9 in this window, averaging 35.16% gains in winning years across the last 9 midterm election years.
- Seasonal window runs from Aug 1 through late July (356 days), aligning with the midterm-to-pre-election stretch in the presidential cycle.
- Percent Profitable is 100%, with 9 winners and 0 losers in the historical sample.
- Annualized return across those windows is 33.21%, with cumulative gains of 1,220% when the pattern is stacked year after year.
- TradeWave Ratio of 1.34 suggests price has typically traveled meaningfully in the long direction within the window, not just at the close.
- Intraperiod swings have been sizable, with some years showing drawdowns above 20% even as the full window finished higher.
According to historical data from TradeWave.ai, this upcoming midterm-year stretch has behaved very differently from an average year for Microsoft. The next section walks through how that pattern has played out in prior cycles and where it sits in the broader election calendar.
How strong is the upcoming seasonal window for Microsoft (MSFT)?
Microsoft has finished higher in every one of the last 9 midterm election years during the 356-day window that begins on Aug 1, averaging gains of 35.16%. The stock heads toward this window at $390.54, up 18.89% year to date and about 28.6% below its 52-week high of $546.77.[2] That combination of a powerful historical seasonal trend and a sizable gap to the prior high is what has traders paying attention to this particular Microsoft trading window.
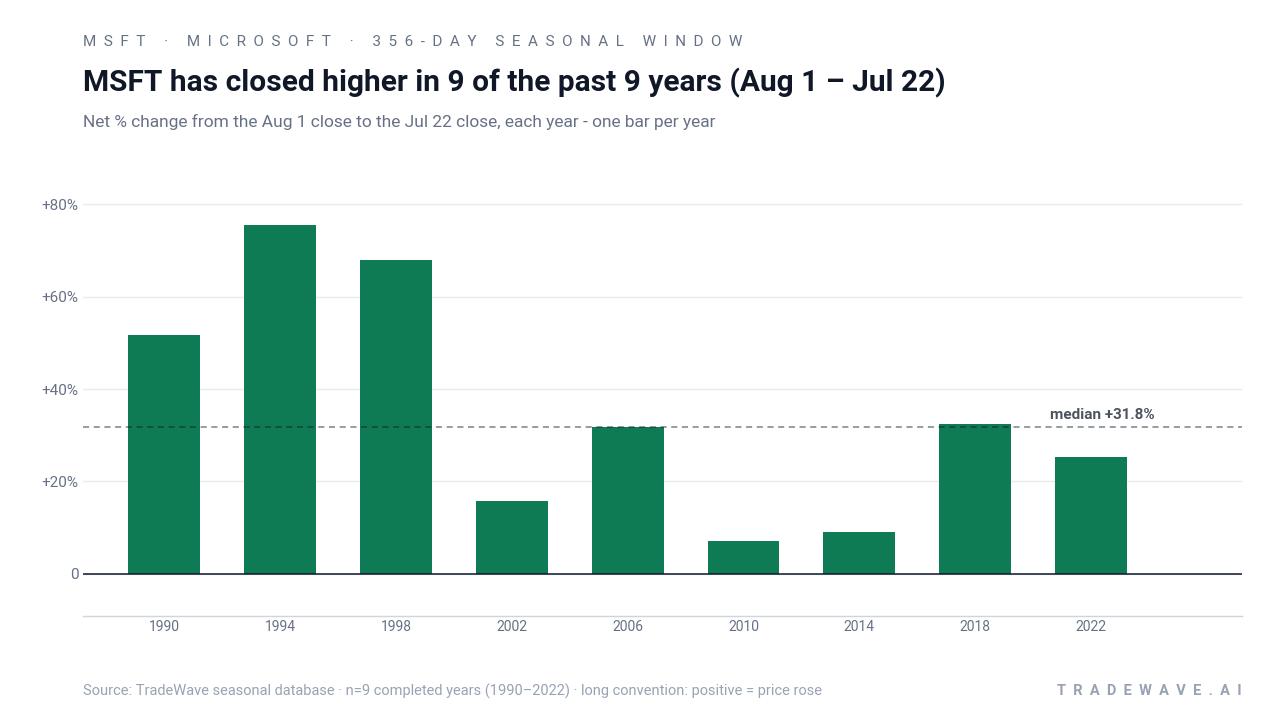
Grouping the data by the presidential election cycle matters here because this window always runs from a midterm election year into the following pre-election year, a stretch that has often coincided with clearer policy direction and a friendlier liquidity backdrop for large-cap growth stocks. For a systemically important name like Microsoft, that mid-cycle regime has historically lined up with periods when investors were willing to pay up for cloud and AI growth stories.
In this specific pattern, the trade direction is long, and every one of the 9 historical midterm-year windows delivered a positive net return. Average gains of 35.16% sit alongside a median profit of 31.82%, which tells you the outliers have not been doing all the work. The weakest year in the sample, 2010, still finished up 7.08%, while the strongest, 1994, posted a 75.42% gain over the window.
The intraperiod path has not been smooth. In 1990, Microsoft’s best point-to-peak move within the window reached 76.04%, but the worst drawdown from entry was a 23.97% slide before the stock recovered. In 2022, the maximum favorable move was 33.21% with a 23.07% adverse excursion along the way, underscoring that even “all green” years for this MSFT seasonal trend have contained sizable air pockets.
Across the full sample, the TradeWave Ratio of 1.34 indicates that price has typically traveled meaningfully in the long direction inside the window, not just at the final close. The Sharpe ratio of 1.26, based on end-of-window outcomes, points to a historically strong risk-adjusted profile for this particular Microsoft seasonal trend, even after accounting for the volatility inside each year.
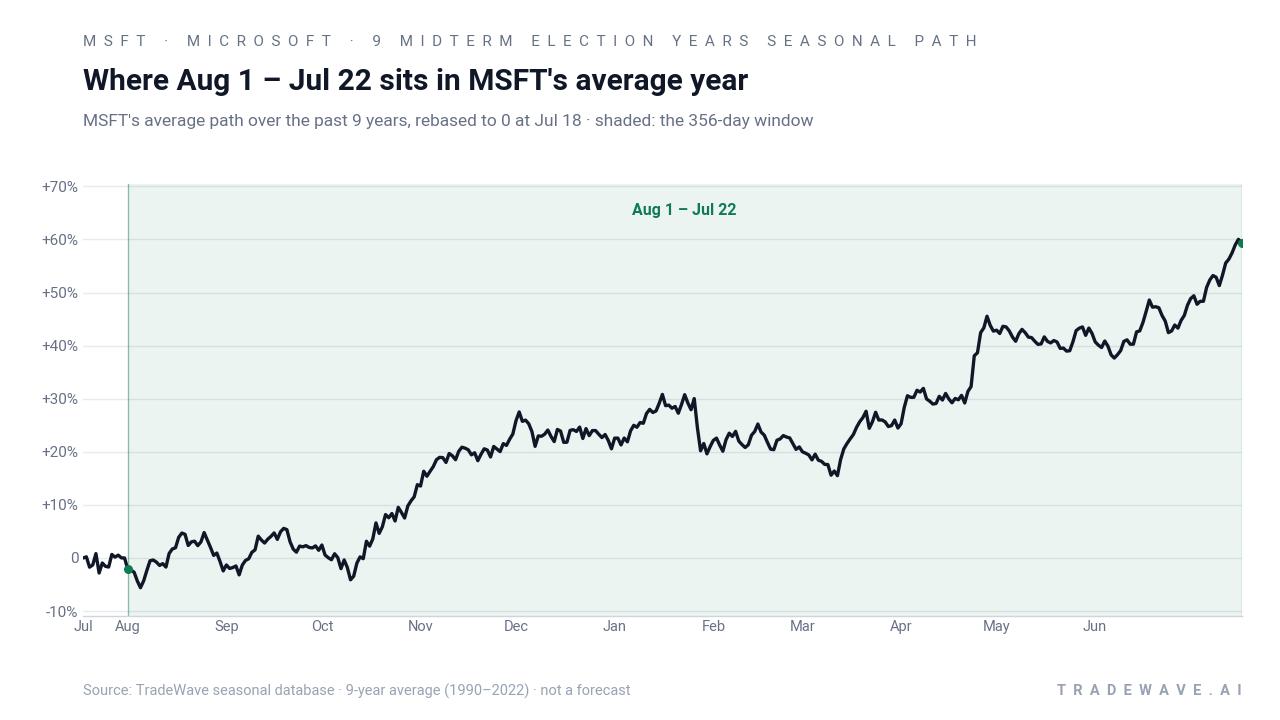
Year-by-year ranges show how far Microsoft has tended to swing inside the window before finishing higher.
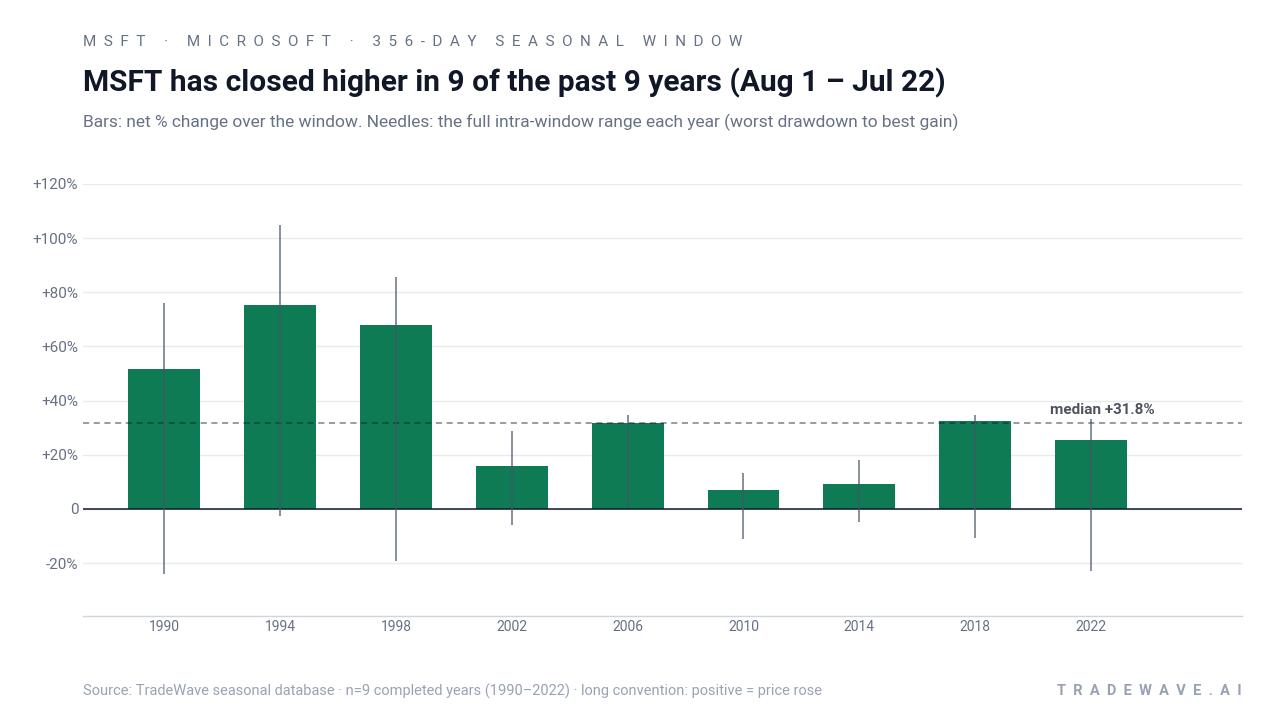
History does not guarantee future results; adverse excursions can be large even in winning windows, and past drawdowns above 20% show that this pattern has carried real downside risk along the way.
Add it up: 9 for 9 with double-digit average gains and no losing years is an unusually clean seasonal record for a mega-cap stock in this part of the election cycle.
Why does Microsoft (MSFT) follow this seasonal pattern?
One likely driver is the way Microsoft’s fiscal year and product roadmap line up with the U.S. election calendar, concentrating key cloud and AI announcements in the midterm-to-pre-election stretch. Analysts have also pointed to institutional portfolio rebalancing and sector rotation into large-cap tech as policy uncertainty fades after midterms and ahead of a presidential campaign.[3] The pattern may also reflect how recurring enterprise contracts and Azure growth show up in reported numbers across this span, reinforcing investor confidence in the stock’s long-term AI and cloud story.[1][4][5]
What is driving Microsoft (MSFT) today?
Microsoft shares closed Thursday at $390.54, down 0.7% on the day, leaving the stock up 18.89% year to date and about 11.8% above its 52-week low of $349.20.[2] The move comes a day after the company’s Q4 FY26 report topped expectations, with revenue of $90.0 billion versus roughly $87.7 billion estimated and earnings per share of $4.74 against a $4.24 consensus, helped by Azure revenue surpassing $100 billion.[4][5] Management kept 2026 capex guidance intact while emphasizing ongoing AI infrastructure spending, which keeps the market focused on whether heavy AI-related investment is translating into durable revenue and free cash flow growth.[4][5][7]
Options markets were primed for a big move into the release, with contracts pricing in an implied swing of about 6.6% in either direction and notable call buying ahead of the print.[6] That unusual options positioning matters because it signals traders were willing to pay up for upside exposure in a stock that already carries a Buy-rated analyst consensus and a price target cluster around the mid-$500s, reflecting optimism about Microsoft’s AI and cloud trajectory.[2][3] Elevated trading volume around the earnings event reinforced how central Microsoft remains to the broader tech and AI trade, with investors treating the results as a read-through on sector-wide AI infrastructure spending.[2][4][6][7]
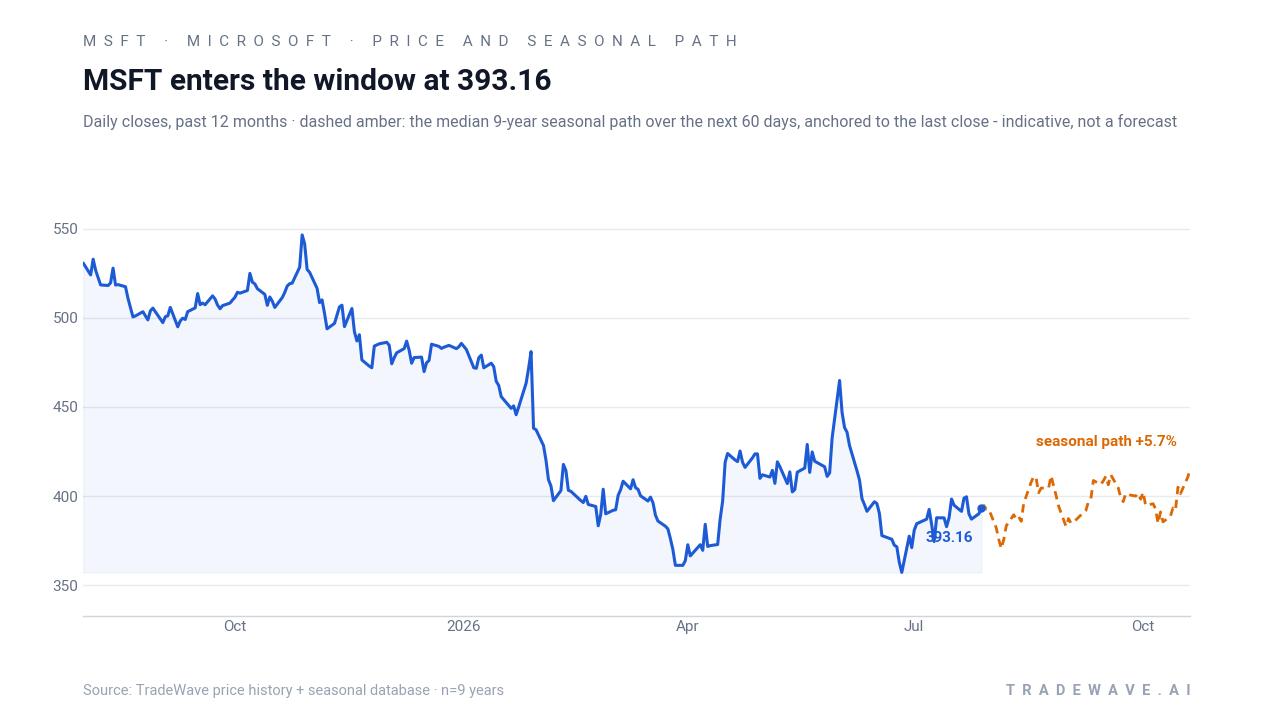
The chart below situates the latest move in its recent multi-month context alongside the historical 60-day seasonal projection.
What should traders watch as this Microsoft (MSFT) window opens?
First, the calendar: the 356-day window kicks off on Aug 1 and runs deep into the pre-election year, so any early weakness or strength will be judged against a backdrop where prior cycles have ultimately finished higher. Traders will be watching whether Microsoft can start closing the gap toward its 52-week high in the weeks after earnings, or whether the stock consolidates around current levels despite the historically strong MSFT seasonal trend.[2][4][5]
Second, the AI and cloud tape. Azure’s move past the $100 billion mark has raised the bar for future quarters, and any signs of slowing cloud or AI-related growth would test the bullish seasonal pattern against a tougher fundamental narrative.[4][5][7] The sector-wide AI infrastructure story is still central to how investors value Microsoft, so guidance updates, commentary on capex efficiency, and competitive dynamics in cloud will all feed into how this window behaves.[1][4][7]
Third, options and volume. The pre-earnings setup featured an implied 6.6% move and notable call buying, a Special Insight that showed traders were positioning for outsized action around the print.[6] If that options activity stays elevated, with continued demand for upside calls or a shift into downside protection, it will offer a real-time read on whether the market is leaning into or fading the historical MSFT seasonal trend as the window opens.
Finally, watch how Microsoft trades on macro and policy headlines as the U.S. moves deeper into the midterm election year and edges toward the pre-election phase. In prior cycles, this midterm-to-pre-election stretch has often coincided with a friendlier backdrop for large-cap tech, but a different policy mix or rate environment could change how closely this year tracks the historical pattern.[3][4][7] The tell will be whether pullbacks inside the window resemble the 10% to 20% drawdowns seen in past winning years or something more severe that breaks the long-running 9-for-9 record.
Sources
- Microsoft (Annual Report) - Microsoft Annual Report 2025 (May 20, 2026).
- Yahoo Finance - Microsoft Corporation (MSFT) Stock Price, News, Quote & ... (Jul 26, 2026).
- The Motley Fool - Prediction: Microsoft Stock Will Go Parabolic After July 29. Here's Why. (Jul 21, 2026).
- Yahoo Finance (Daniel Howley) - Microsoft beats Q4 expectations, as Azure revenue tops $100 billion (Jul 29, 2026).
- The Motley Fool - Is Microsoft a Buy After Its Latest Earnings Report? (Jul 29, 2026).
- Reuters - Microsoft set for $190 billion market value swing after earnings results ... (Jul 29, 2026).
About this seasonal analysis
Seasonal pattern data is sourced from TradeWave.ai, which analyzes historical price behavior across annual calendar windows going back up to 30 years. Read the full data methodology or the book The 100-Year Pattern by Afshin Moshrefi (2026 edition). Past performance of seasonal patterns does not guarantee future results. This article is for informational purposes only and does not constitute investment advice.