Oracle Corporation (ORCL) Has Rallied in 8 of 8 Aug-May Midterm Windows, Averaging 27.75% Gains
Oracle Corporation is approaching a historically powerful Aug. 1–May 13 trading window even as shares sit far below their 52-week high after a volatile stretch of AI-fueled earnings and guidance shifts.
Price as of Jul 22, 2026: $125.84 (last close).

What is the seasonal pattern for Oracle Corporation (ORCL)?
Oracle Corporation has risen in 8 of 8 midterm-election-year windows from Aug. 1 to May 13, with an average gain of 27.75% in winning years.
- 8 for 8 in this window, averaging 27.75% gains in winning years across the last 8 midterm election cycles.
- Percent Profitable is 100%, with 8 winners and 0 losers in the Aug. 1–May 13 Oracle Corporation trading window.
- Average profit of 27.75% per completed window stacks to a 590% cumulative return when compounded across all eight cycles.
- The pattern is long-biased, with a Trade Direction of “long,” a TradeWave Ratio of 1.14 and a Sharpe ratio of 2.24, pointing to strong risk-adjusted returns.
- Individual years have seen sizable swings, with maximum favorable moves above 50% in strong cycles and adverse drawdowns deeper than 20% in choppier ones.
- This 286-day stretch spans late in the midterm election year into the following May, a phase that has often aligned with stronger risk appetite for large-cap tech and AI infrastructure names.
According to historical data from TradeWave.ai, this upcoming midterm-year stretch has behaved very differently from an average calendar year for Oracle. The next section walks through how that election-cycle pattern has played out in prior windows and what it means for the Aug. 1 start date ahead.
How strong is the Aug. 1–May 13 seasonal window for Oracle Corporation (ORCL)?
Oracle Corporation has closed higher in every single Aug. 1–May 13 midterm-election-year window on record, with average gains of 27.75% and a 590% cumulative return across eight cycles. Today the stock finished at 125.84, about 62.8% below its 52-week high of 337.97, underscoring how far it has fallen from last year’s AI euphoria even as a historically strong seasonal stretch approaches.
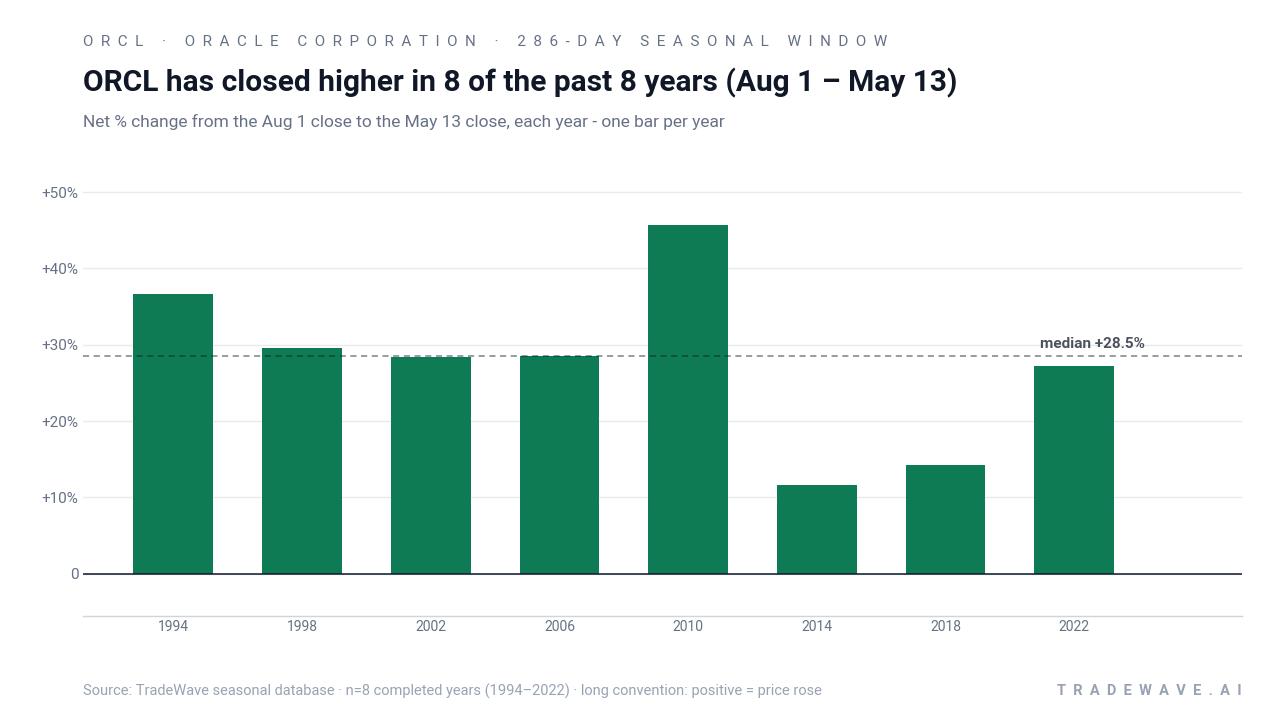
Grouping the data by the presidential election cycle matters here because this 286-day stretch runs from late in the midterm election year into the following spring, a phase that has often coincided with friendlier policy signals and stronger risk appetite for large-cap technology. In this pattern phase, labeled “the last 8 midterm election years,” Oracle’s long-only seasonal profile has been unusually consistent compared with other parts of the cycle.
Across those eight midterm-election-year windows, Oracle’s Percent Profitable is 100%, with 8 winners and 0 losers, and an average profit of 27.75% per window. The median gain of 28.51% sits close to the average, which suggests the wins are not just driven by one outlier year. Add it up and stacking the window year after year compounds to a 590% cumulative return, a rare clean sweep for a mega-cap stock over such a long span.
The trade direction for this pattern is explicitly long, so positive returns are favorable outcomes and drawdowns are the price of staying in the trade. The strongest year in the sample was 2010, when Oracle gained 45.63% between the Aug. 1 entry and the May 13 exit, with a maximum favorable move of 51.06% and a worst drawdown of 10.83% along the way. The softest year was 2014, which still finished up 11.59% but saw a maximum adverse move of 9.29%, showing that even the “quiet” wins involved meaningful swings.
Intraperiod volatility is a key part of this ORCL seasonal trend. In 1998, for example, the stock’s best run-up within the window reached 131.93%, while the worst drawdown from entry hit 31.69% before the trade closed up 29.58%. In 2022, the maximum favorable move was 28.16% and the maximum adverse move was 21.51%, again underscoring that even winning years have featured double-digit pullbacks inside the window.
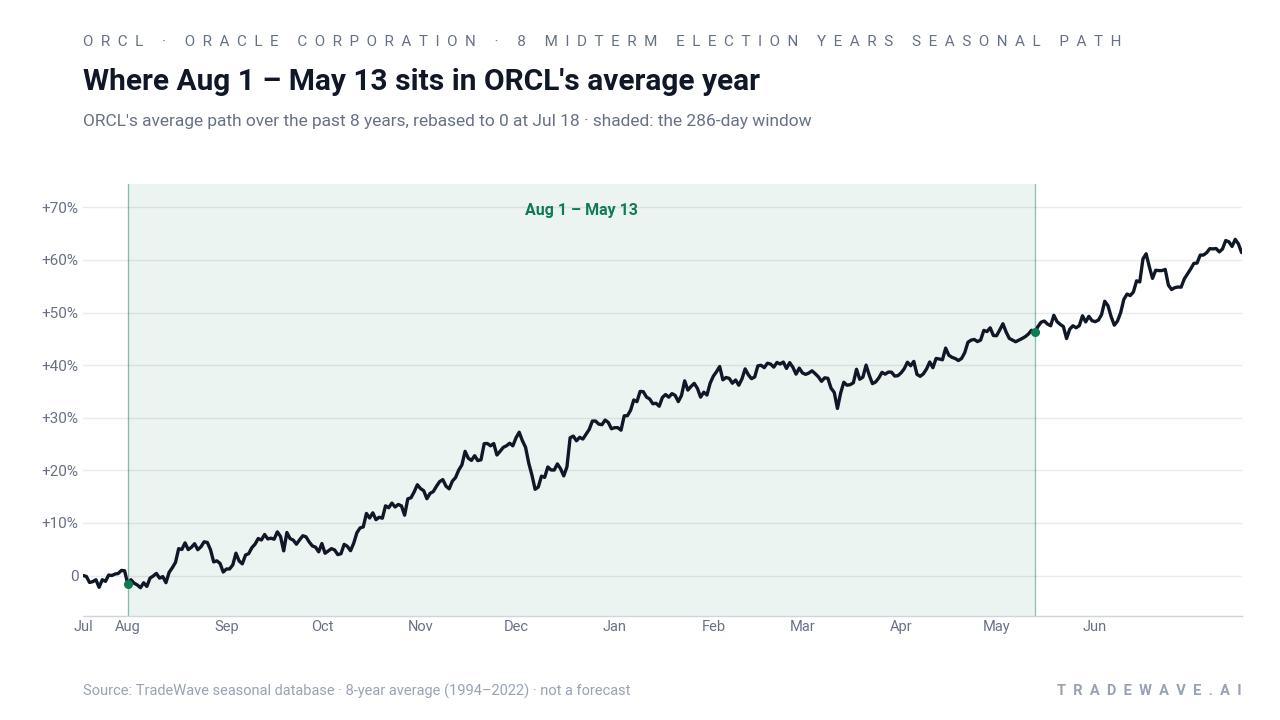
A second view of the same window highlights how far Oracle has tended to travel in both directions before those positive finishes.
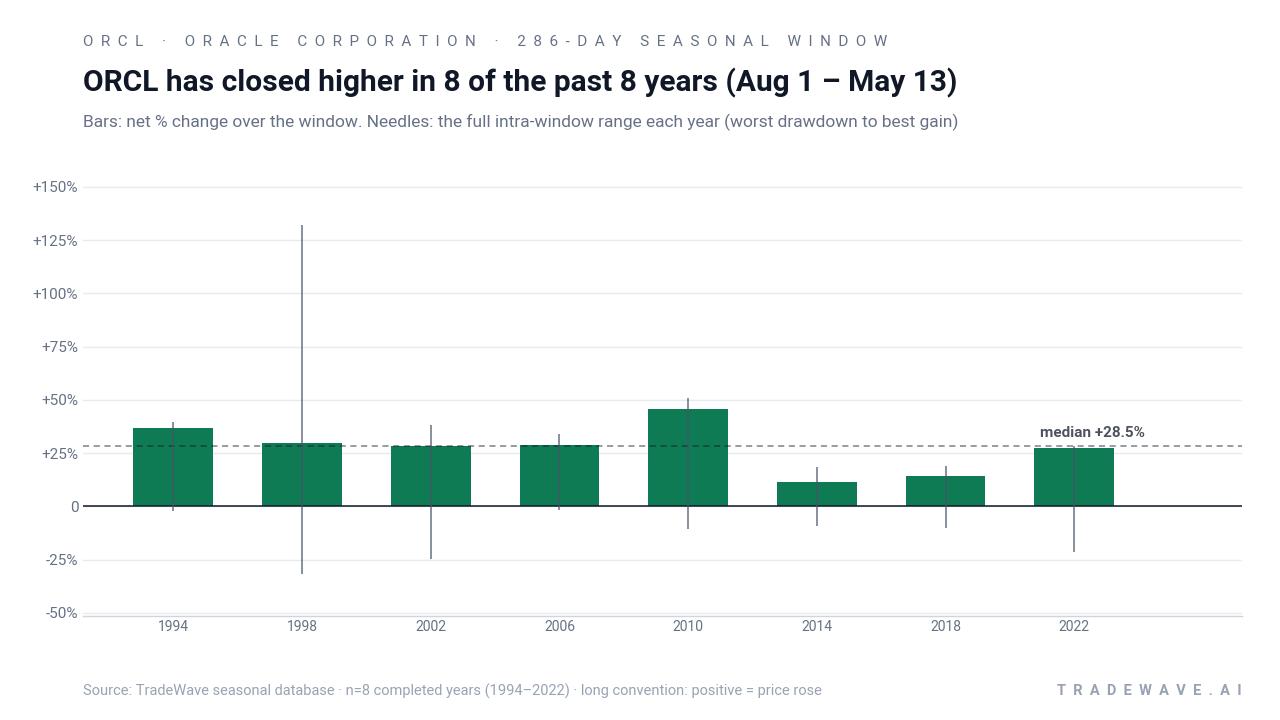
The bar-and-needle profile shows that Oracle’s maximum favorable excursions have often been large, with several years posting intra-window rallies north of 30% and one cycle above 100%, while maximum adverse excursions have at times pushed beyond 20% on the downside. That combination of high TradeWave Ratio and elevated intraperiod swings points to a window where the stock has historically rewarded patience in the long direction but has not spared traders from volatility along the way.
History does not guarantee future results; adverse excursions (MAE) can be large even in winning windows.
Why does Oracle Corporation (ORCL) follow this seasonal pattern?
One likely driver is the way Oracle’s fiscal calendar and big cloud contracts line up with the political and macro backdrop late in the midterm election year and into the following spring. Analysts have pointed to heavy AI infrastructure spending, large multi-year deals and shifting guidance as catalysts that often cluster around Oracle’s fall and winter earnings reports, which fall squarely inside this window.[2][4][5] The pattern may also reflect broader sector rotation into large-cap software and cloud infrastructure as policy uncertainty eases after the midterm vote and investors position for the typically stronger “year before the presidential election.”
What is driving Oracle Corporation (ORCL) today?
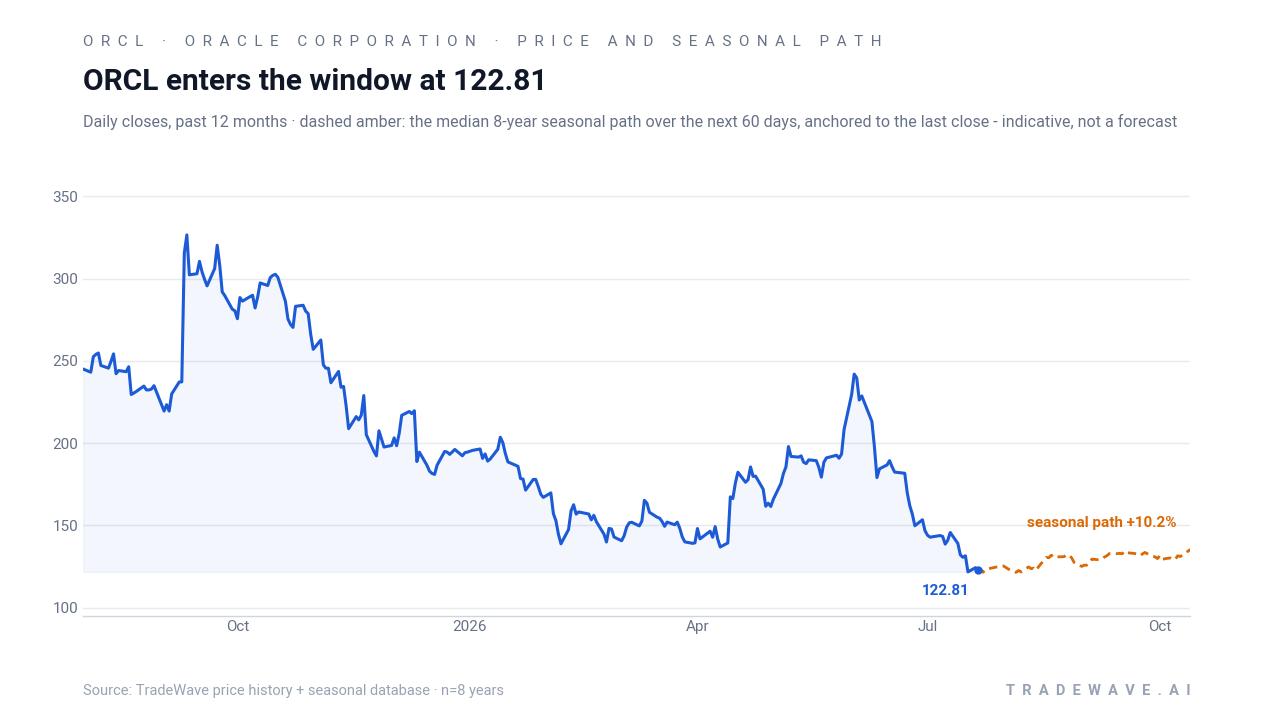
Oracle shares closed Thursday at 125.84, down 0.95% on the day, extending a rough month that has left the stock 26.92% lower over the past 30 days and well under its 50-day moving average of 174.79. The slide follows a mixed fiscal fourth-quarter report on Jun. 10, 2026, where weakness in software offset enthusiasm around AI infrastructure, and a series of notes highlighting both extraordinary AI demand and concerns about heavy data center capital spending.[2][4][5]
In June, Barron’s described Oracle’s latest quarter as a tug-of-war between rapid cloud transformation and softer software results, with the stock sliding in late trading as investors digested the numbers.[5] Earlier in March, Forbes reported that Oracle’s fiscal third quarter delivered $17.2 billion in revenue and $1.79 in earnings per share, beating expectations and prompting management to lift guidance to 19%–21% revenue growth and 46%–50% cloud revenue growth for the following quarter.[4] That upbeat outlook helped fuel a powerful AI narrative around Oracle’s cloud infrastructure business, but it also set a high bar that has made any subsequent wobble in software or margins more painful in the tape.
Sector commentary from Barchart and others has stressed that Oracle is fighting for AI infrastructure share against AWS, Microsoft Azure and Google Cloud, a race that demands aggressive investment in data centers and networking capacity.[2][5] Reports have flagged tens of billions of dollars in planned capex over the coming years, a scale of spending that can pressure free cash flow even as it supports long-term growth. That tension between growth and cash generation has been a recurring theme in recent coverage and helps explain why the stock can swing sharply around each earnings update.
On the sentiment side, a fresh note from Mizuho this week argued that Oracle “has taken a beating recently” but could more than double from here, citing the pullback and the firm’s view of the AI demand pipeline.[3] Barchart’s data and analyst roundups have similarly framed the stock as a high-beta way to play AI infrastructure, with the caveat that execution on large cloud deals and software stabilization will be critical in coming quarters.[2] Away from fundamentals, a May 2026 trading disclosure listing Oracle among stocks bought and sold by Donald Trump drew headlines but did not represent corporate insider activity, so it has been more of a curiosity than a core driver for institutional positioning.[12]
The chart below situates the latest move in its recent multi-month context, alongside the median 60-day seasonal path.
What should traders watch as the Aug. 1 seasonal window approaches?
First, the calendar. The 286-day window starting Aug. 1 runs through May 13, carrying Oracle from the late stages of the midterm election year into the heart of the year before the presidential election, a phase that has historically been friendlier for risk assets. The fact that Oracle is entering this stretch after a steep drawdown and with sentiment bruised by mixed software results sets up a clear contrast between current price action and the long-term seasonal record.[2][3][5]
Second, the policy and spending backdrop. Investors will be watching how Washington’s fiscal stance, AI-related regulation and broader tech oversight debates evolve into late 2026, since those factors can influence enterprise cloud budgets and the pace of AI infrastructure rollouts. Any signs that large customers are delaying projects or trimming capex could blunt the historical tailwind, while confirmation of sustained AI demand and follow-through on Oracle’s elevated growth guidance would rhyme more closely with prior winning windows.[2][4][5]
Third, the earnings cadence. Oracle’s next few quarterly reports will land squarely inside this seasonal regime, and the pattern’s strongest historical years have often coincided with upside surprises on cloud revenue and guidance. Traders will be looking for whether revenue growth can stay near the 19%–21% range and whether cloud revenue can maintain the 46%–50% growth band that management outlined in March 2026, or if competitive and capex pressures start to bite.[2][4][5]
Finally, price behavior inside the window will be the real test of this ORCL seasonal trend. If the stock can stabilize above recent lows and begin to track closer to the historical average path, it would reinforce the idea that this midterm-to-pre-election stretch remains a constructive backdrop for long exposure. If instead Oracle continues to make lower lows despite the calendar tailwind, that would mark a clear break from the last eight midterm-election-year windows and signal that today’s AI and capex cycle is rewriting the playbook.
Sources
- CNBC, “What Wall Street analysts expect from Oracle earnings due after Wednesday's close,” Dec 10, 2025
- Barchart, “Ahead of Oracle Earnings, Here's What Barchart Data Says Comes Next for ORCL Stock,” Jun 8, 2026
- CNBC, “Oracle has taken a beating recently. Mizuho says it can more than double from here,” Jul 21, 2026
- Forbes, “Oracle Earnings: Shares Pop After Tech Giant Beats Revenue Expectations,” Mar 10, 2026
- Barron's, “Oracle Reports Earnings Amid a Rapid Cloud Transformation,” Jun 10, 2026
- Yahoo Finance, “Trump's Trading Disclosure Shows Activity In Nvidia, AMD, Microsoft, Oracle And Other Major Stocks,” May 19, 2026
About this seasonal analysis
Seasonal pattern data is sourced from TradeWave.ai, which analyzes historical price behavior across annual calendar windows going back up to 30 years. Read the full data methodology or the book The 100-Year Pattern by Afshin Moshrefi (2026 edition). Past performance of seasonal patterns does not guarantee future results. This article is for informational purposes only and does not constitute investment advice.