Amazon (AMZN) Has Rallied in 5 of 6 Midterm August Windows, Averaging 5.04% Gains
Amazon is trading just below record territory as it moves through a midterm-year August window that has often delivered quick upside bursts for the stock.
Price as of Aug 5, 2026: $272.65 (last close).
What is the seasonal pattern for Amazon (AMZN)?
Amazon has risen in 5 of 6 years during this early‑August midterm-year window, with an average gain of 5.04% in winning years.
- 5 for 6 in this window, with winning years averaging 5.04% gains over the 12-day stretch.
- The current pattern runs from Aug 3 through Aug 14 in midterm election years, a historically bullish slice of the calendar for AMZN.
- Percent Profitable is 83%, with 5 winners and 1 loser across the last 6 matching midterm-year cycles.
- Including all years, the average outcome is a 4% gain, reflecting one modest down year of just -0.6%.
- The strongest year in the sample delivered an 8.08% net gain, while the weakest saw a 0.6% decline, showing upside skew with contained downside.
- A TradeWave Ratio of 1.59 and a Sharpe ratio of 1.29 point to historically favorable risk-adjusted returns for long trades in this window.
According to historical data from TradeWave.ai, this short August stretch has behaved differently for Amazon in midterm election years than in a typical month. The next section looks at how that pattern has played out and where the current window fits in the broader election cycle.
How has Amazon (AMZN) traded in this midterm-year August window?
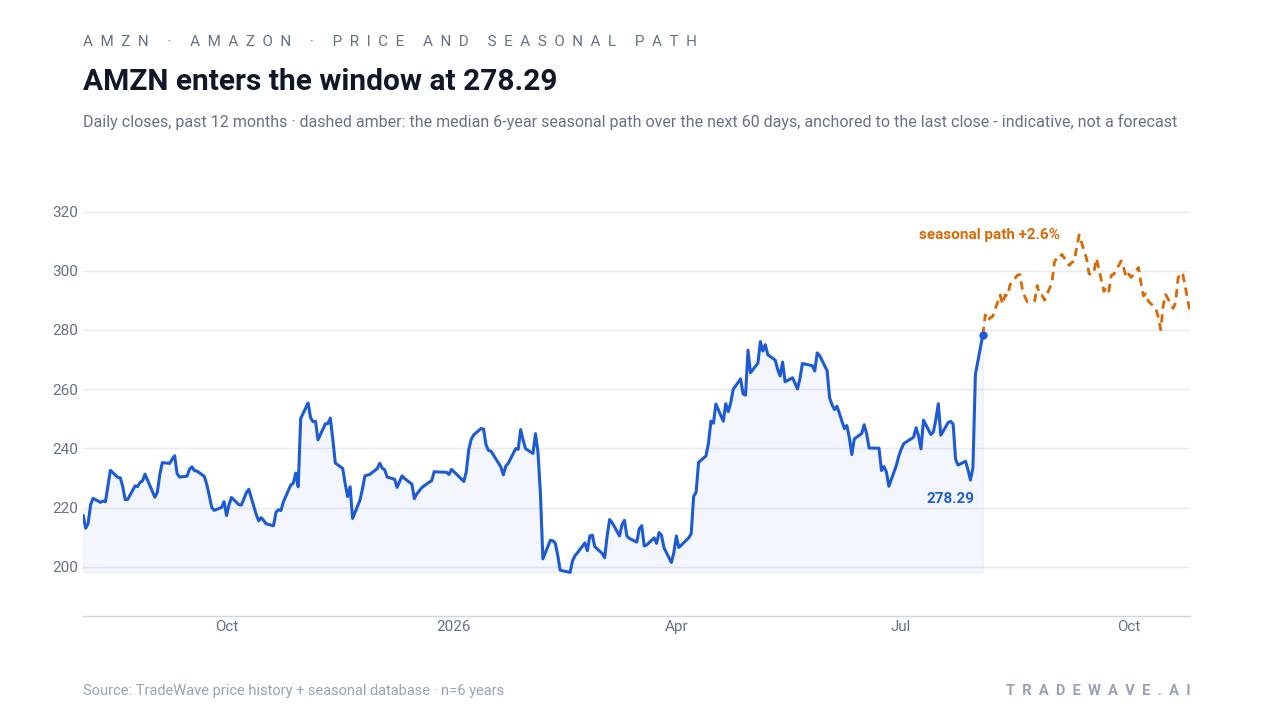
Amazon has closed higher in 5 of the last 6 midterm election years during the Aug 3 to Aug 14 window, with winning years averaging gains just over 5%. Shares finished Thursday at $272.65, down 1.7% on the day and about 5.1% below their 52-week high of $287.16, leaving the stock still near the top of its one-year range.
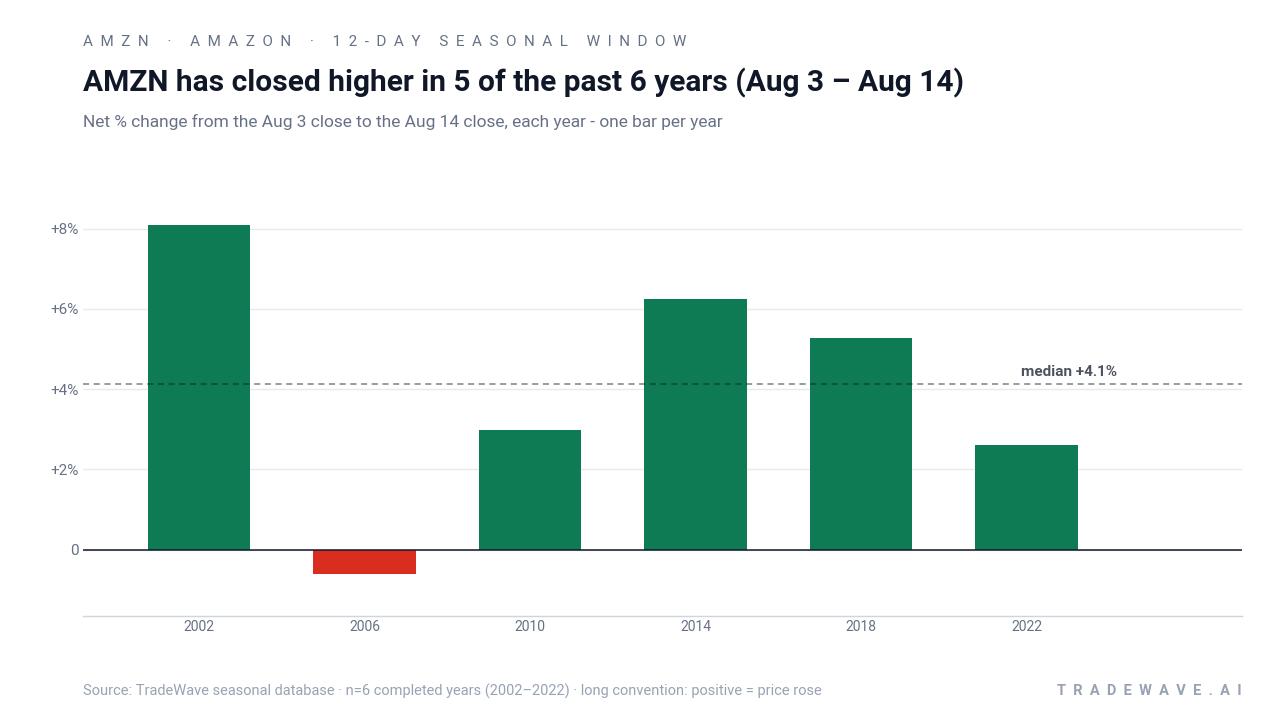
Because this study groups only midterm election years, it lines up Amazon’s behavior with a specific phase of the presidential cycle rather than a run of consecutive calendar years. Midterm years often bring heavier policy noise and rate uncertainty, yet this particular early‑August slice has tended to be a constructive pocket for one of the market’s most important growth stocks.[3]
Across the six midterm-year samples, the trade direction is long, and the bias has been clearly positive. Percent Profitable sits at 83%, with 5 winners and just 1 loser, and the all-years average outcome is a 4% gain over 12 days. The average winning year posts a 5.04% advance, while the lone losing year in 2006 saw only a 0.6% decline, so the downside has historically been shallow relative to the upside.
The per-year breakdown shows how that upside has tended to arrive. The strongest run came in 2002, when AMZN gained 8.08% over the window, helped by a maximum favorable move of 14.61% from the entry before giving some back. More recent midterm years such as 2014 and 2018 also logged solid gains of 6.24% and 5.28% respectively, with intraperiod pullbacks limited to around 1% in those cases.
Intraday and intra-window swings matter in a short 12-day trade, and the historical excursions underline that point. Maximum favorable moves have ranged from roughly 3.37% to 14.61%, while the worst drawdowns from entry have generally stayed between about 0.16% and 3.48%. In other words, when this window has worked for longs, it has often delivered a quick multi‑percent pop, but even the better years have included at least a modest shakeout along the way.
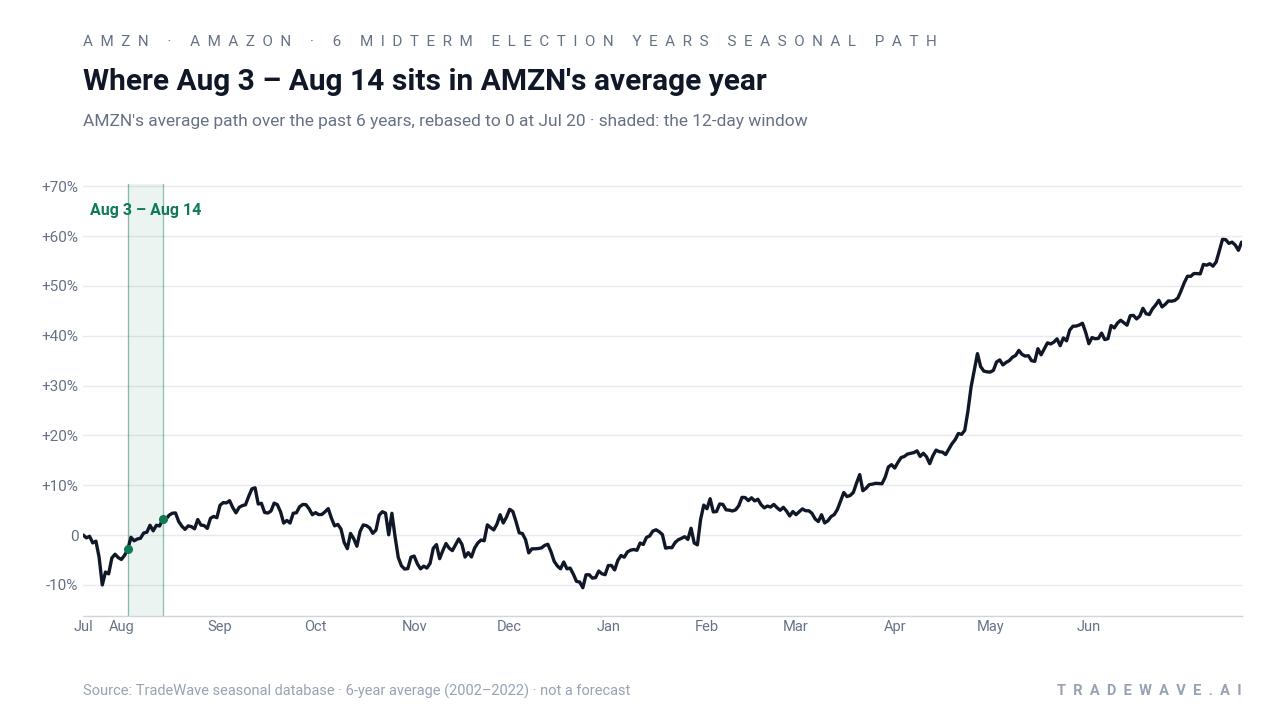
The historical seasonal average chart suggests that in midterm years, Amazon’s typical year-to-date path often flattens into late July, then tilts higher into this early‑August stretch. The shaded window captures a period where the average line bends upward, implying that prior cycles have seen gains cluster inside these 12 days rather than before or after them.
A second view stacks each year’s net result against its best and worst intra-window swings.
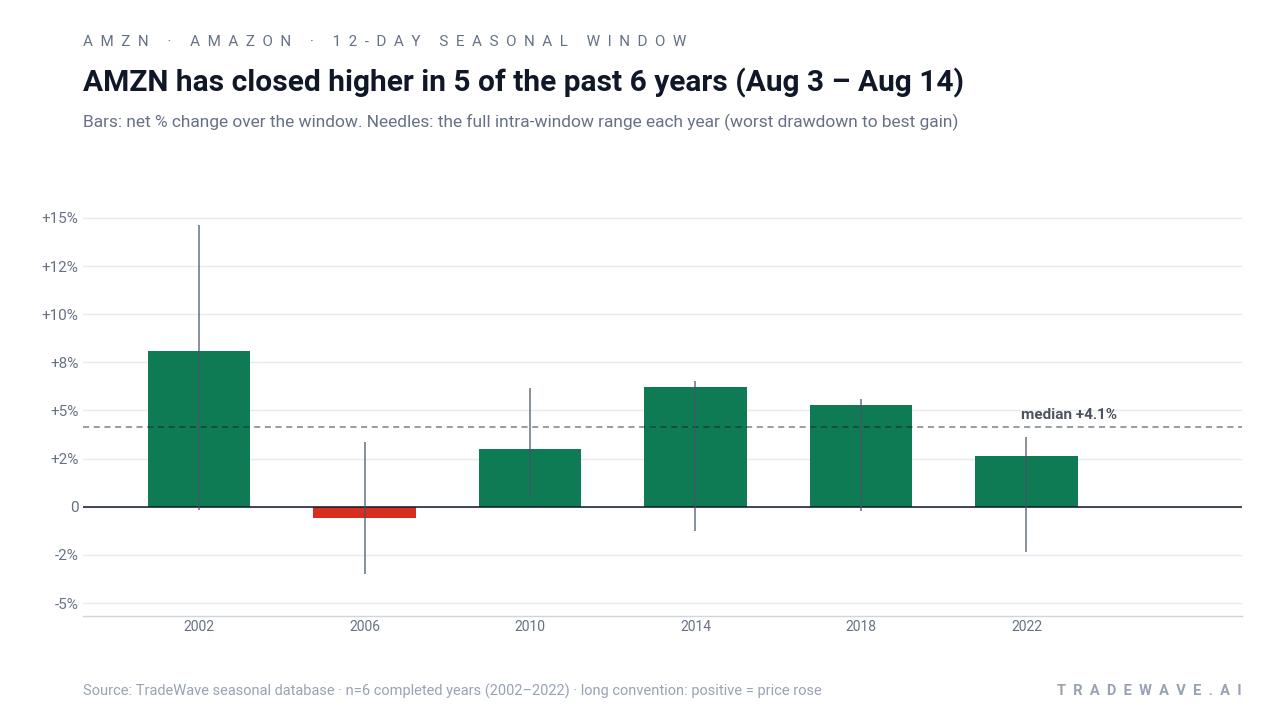
The combined net / best‑case / worst‑case chart makes the skew clear: in most years, the bar ends in positive territory, and the upper needle extends meaningfully above it, while the lower needle rarely stretches far below zero. That profile lines up with a TradeWave Ratio of 1.59 and a Sharpe ratio of 1.29, both consistent with a historically favorable long setup rather than a coin flip.
History does not guarantee future results; adverse excursions (MAE) can be large even in winning windows.
Why does Amazon (AMZN) follow this seasonal pattern?
One likely driver is the way Amazon’s earnings calendar and guidance updates cluster around late July and early August, which can reset expectations for AWS and retail heading into the back‑to‑school and early holiday planning period.[1] Portfolio managers also tend to rebalance around midyear in the midterm election year, and strong or weak earnings can trigger rapid position adjustments in mega‑caps like Amazon. The result is a short window where fresh information and institutional flows often line up in the same direction, creating the kind of quick, directional moves this pattern captures.
What is driving Amazon (AMZN) today?
Amazon shares closed at $272.65 on Thursday, down 1.7% on the session but still up sharply from pre‑earnings levels and sitting about 5.1% below their 52‑week high of $287.16. The stock has been digesting a powerful post‑results surge that briefly pushed Amazon’s market value above $3 trillion earlier this week, a milestone powered by a blowout quarter in cloud and a one‑time gain tied to its Anthropic stake.[5]
The latest leg of the rally started with Amazon’s Jul 30 second‑quarter report, which showed revenue of $200.61 billion, up 20% year over year and ahead of Wall Street estimates.[3] AWS revenue jumped 37% to $42.23 billion, and consolidated operating income reached $27.46 billion, helped by expanding cloud margins and ongoing cost discipline in retail.[3] A roughly $53.4 billion non‑operating pre‑tax gain from Anthropic pushed reported net income to $62.64 billion, turning the quarter into a headline‑grabbing outlier on the earnings line.[12]
Guidance was more measured. Management projected third‑quarter revenue between $197 billion and $202 billion, implying 9% to 12% growth, shy of a $204.1 billion consensus, though executives argued that adjusting for the timing of Prime Day would put underlying growth closer to 13% to 16%.[3] Currency is expected to be an 80 basis‑point headwind, and the company flagged continued heavy investment in AI infrastructure as a key swing factor for margins.[3]
That AI build‑out is central to the story. Amazon has lifted its 2026 capital expenditure plan to roughly $220 billion, with management saying AWS capacity will remain constrained into 2027 and that demand visibility stretches into 2028 as customers race to secure GPU and networking resources.[6] In the cloud and AI infrastructure sector, Amazon’s willingness to spend aggressively is being read as both a competitive challenge to peers and a sign that hyperscale demand remains robust.[1]
Trading activity has reflected that enthusiasm. In the days immediately after earnings, Amazon logged a session where the stock finished about 15% higher, and other reports pointed to multi‑day jumps of roughly 26% as investors recalibrated their growth assumptions.[10] Short interest remains modest at around 1.09% of float, though it has ticked up 6.20% from the prior report, suggesting some investors are testing the strength of the move after such a steep run.[12]
Insider headlines have added another layer. Jeff Bezos has reiterated plans to sell roughly $1 billion of Amazon stock each year to fund Blue Origin, framing space as “the most important work” he is doing, while separate coverage has highlighted sales by Berkshire Hathaway vice chair Greg Abel.[9][7] Those disposals have not derailed the rally so far, but they give traders one more data point to weigh as they assess how much of the AI and cloud optimism is already in the price.
The chart below situates the latest move against Amazon’s past year of trading and a historical seasonal projection.
What should traders watch in this Amazon (AMZN) window?
For the remainder of the Aug 3 to Aug 14 stretch, the first reference point is behavior around the recent highs near $287. A push back toward that zone with only shallow intraday pullbacks would be consistent with prior winning years, where maximum favorable moves often outpaced final net gains by several points. A failure to hold above the low‑$270s, by contrast, would start to look more like the lone losing year in the sample.
Macro and policy catalysts are the second piece. This midterm election year is already dominated by debates over AI regulation, antitrust scrutiny of large platforms, and the path of interest rates, all of which feed directly into how investors value long‑duration growth stories like Amazon.[5] Any shift in the rate outlook or regulatory tone over the next week could either reinforce the historical pattern of quick upside or short‑circuit it with a bout of volatility.
Finally, traders will be watching whether the post‑earnings volume and positioning surge cools off or extends. If elevated turnover and aggressive buying persist while short interest remains contained, that would echo prior midterm-year windows where strong demand carried through the full 12 days.[10][12] A sharp drop‑off in volume or a visible build in short interest would suggest that this time, the seasonal tailwind is running into a more skeptical market.
Sources
- The Motley Fool: Is Amazon Stock a Buy After CEO Andy Jassy's $1 Trillion ... (Aug 3, 2026)
- CNBC: Amazon tops $3 trillion market cap as stock continues post-earnings surge (Aug 3, 2026)
- The Motley Fool: Microsoft vs. Amazon: Which Stock Does Wall Street Think Is the Better Buy? (Aug 4, 2026)
- The Motley Fool: Greg Abel Just Sold 2.3 Million Shares of Amazon Stock. Here's Why That Could Be a Huge Mistake. (Aug 5, 2026)
- Barchart: Jeff Bezos Says He’s Selling $1 Billion In Amazon Stock Every Year to Fund Blue Origin (Aug 4, 2026)
- Seeking Alpha: Amazon finishes 15% higher after blowout earnings (Jul 31, 2026)
- Yahoo Finance / Insider Monkey: Amazon (AMZN) Booked a $53.4 Billion Gain, Mostly From Anthropic (Aug 5, 2026)
About this seasonal analysis
Seasonal pattern data is sourced from TradeWave.ai, which analyzes historical price behavior across annual calendar windows going back up to 30 years. Read the full data methodology or the book The 100-Year Pattern by Afshin Moshrefi (2026 edition). Past performance of seasonal patterns does not guarantee future results. This article is for informational purposes only and does not constitute investment advice.