MKS Instruments (MKSI) Short Trades Have Averaged 7.56% Profit in This 31-Day Fall Window
MKS Instruments is trading well below its 52-week high as investors brace for Q2 earnings and an historically weak Sep 2–Oct 2 trading window that has punished the stock in every midterm election year on record.
Price as of Aug 5, 2026: $313.10 (last close).

What is the seasonal pattern for MKS Instruments (MKSI)?
MKS Instruments has fallen in 6 of 6 years during the Sep 2–Oct 2 midterm-year window, with an average gain of 7.56% in winning years for a short trade.
- 6 for 6 in this window, with short trades averaging 7.56% profit across the last six midterm election years.
- Seasonal window runs from Sep 2 to Oct 2, spanning 31 days in the midterm election year phase of the presidential cycle.
- Percent Profitable is 100%, with 6 winners and 0 losers for the short-side pattern.
- TradeWave Ratio (TWR) of 1.75 shows price has typically moved meaningfully in the trade direction within the window.
- Sharpe ratio of 1.53 indicates historically strong risk-adjusted returns for this specific short setup.
- Past years include double-digit drops such as 2002, 2018 and 2022, underscoring the potential for sharp swings in this MKS Instruments trading window.
According to historical data from TradeWave.ai, this upcoming stretch for MKS Instruments behaves very differently from an average autumn month. TradeWave.ai’s seasonal database flags the early-September to early-October window in midterm election years as one of the stock’s most consistently negative patterns for short-term direction.
How has MKS Instruments (MKSI) traded in the Sep 2–Oct 2 midterm-year window?
MKS Instruments has dropped in every Sep 2–Oct 2 window across the last six midterm election years, with short trades posting an average profit of 7.56%. Shares finished the prior session at 313.10, leaving the stock about 30.1% below its 52-week high of 447.62 and well above its 52-week low near 87.85. That gap between a rich multi-year run and a historically weak early-autumn stretch is the backdrop as traders look toward this year’s iteration of the pattern.
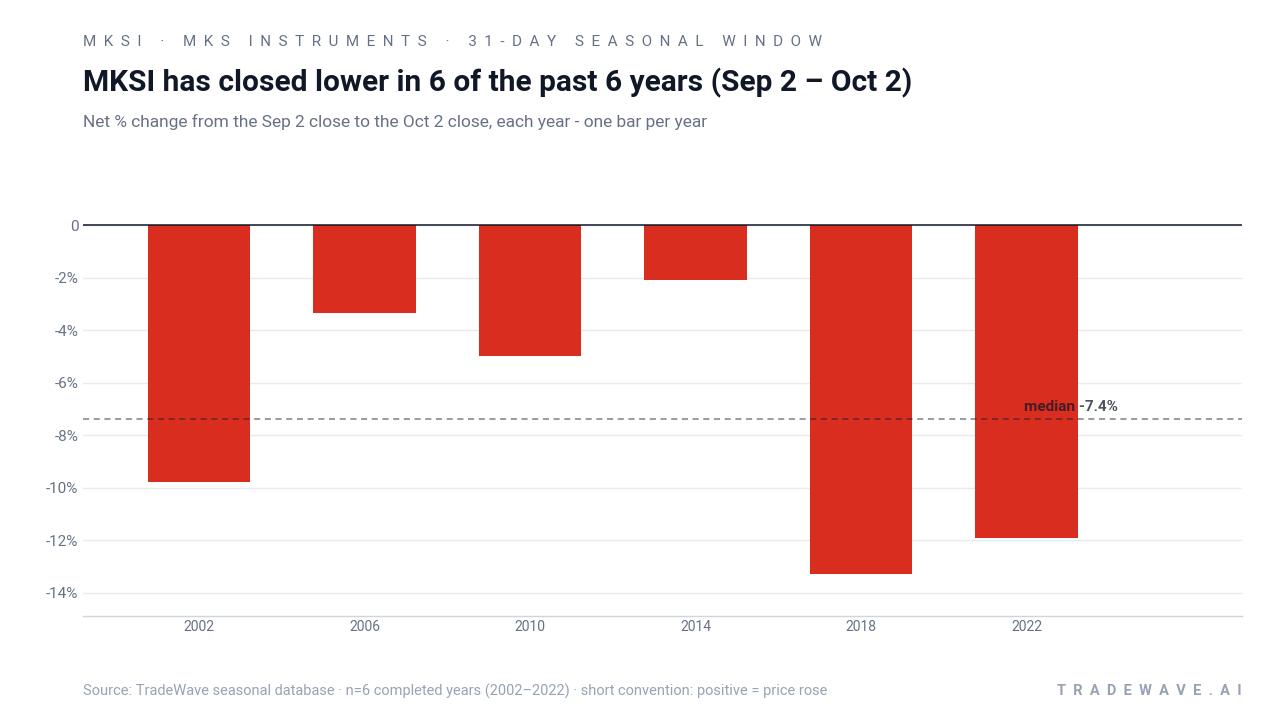
The pattern is built on the last six midterm election years, from 2002 through 2022, and it is explicitly short-biased. In every case, MKS Instruments finished the 31-day window lower than it started, which translates into a 100% win rate for traders positioned for downside. Average profit of 7.56% for those winning shorts compares with a median profit of 7.38%, suggesting the distribution of outcomes has been fairly tight rather than dominated by a single outlier year.
Looking at individual years, 2018 and 2022 stand out as the heaviest hits, with net returns of about -13.27% and -11.90% respectively for the stock over the window. For a short trade, those are strong positive outcomes, and they sit alongside smaller but still negative moves such as -3.35% in 2006 and -2.07% in 2014. Add it up and stacking the window across cycles compounds to a cumulative return of roughly 54% for the short side, which is unusually consistent for a single 31-day slice of the calendar.
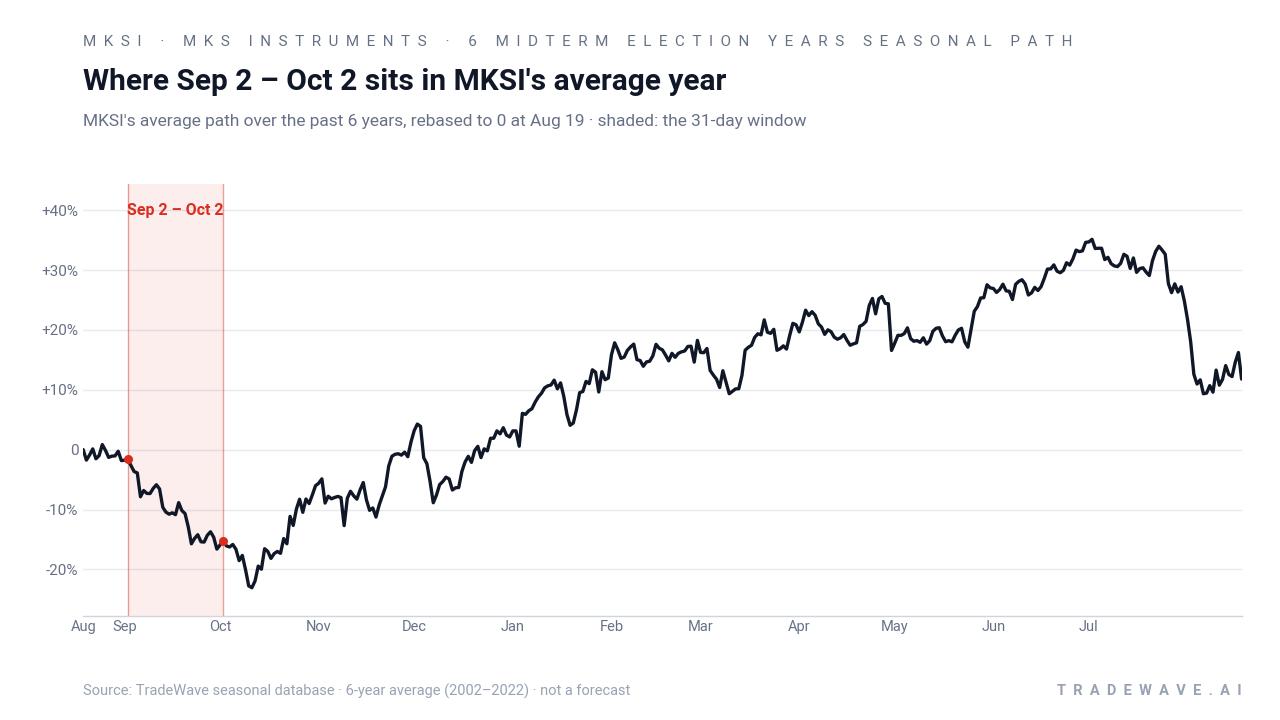
A second view shows how far MKS Instruments has tended to swing inside the window before it closes.
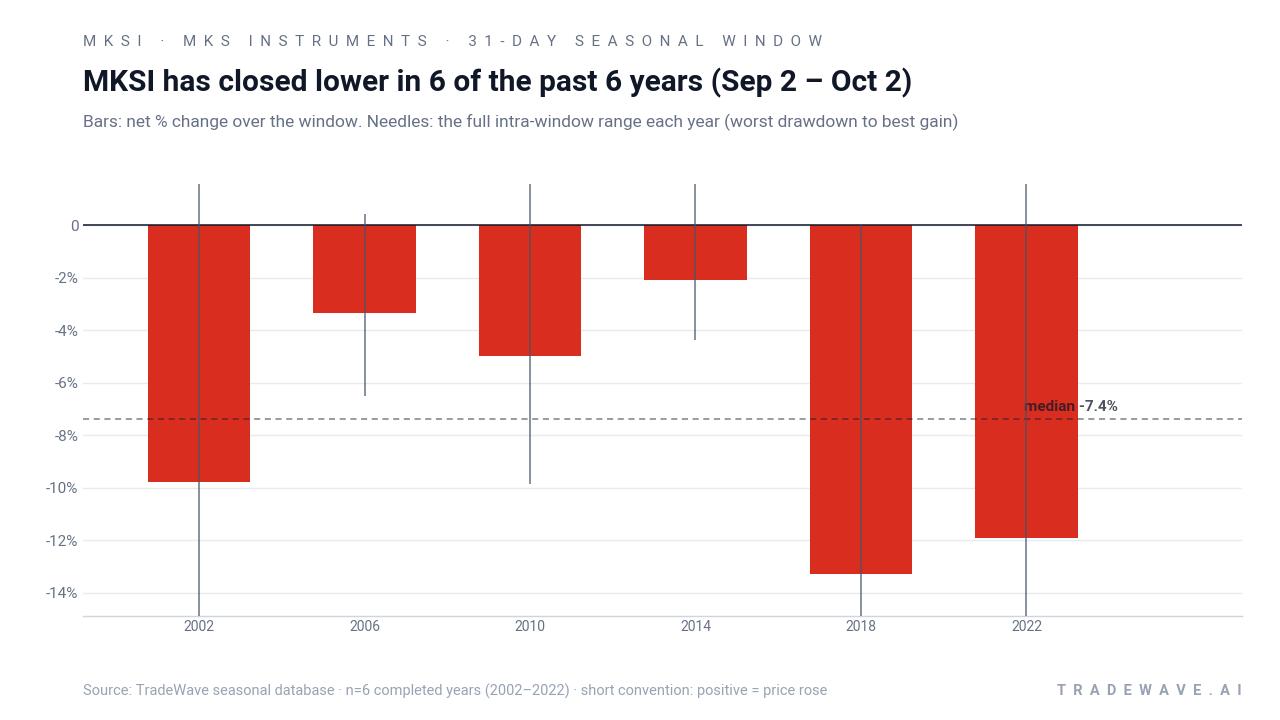
The bars-and-needles view captures both the maximum favorable move and the maximum adverse move within each year’s window. In 2002, for example, the stock’s best intraperiod rally was about 6.95% against the short, while the worst drawdown in favor of the short reached roughly -23.05% from the entry. In 2022, the best rally against the short was about 4.93%, while the worst drawdown in favor of the short stretched to around -16.09%. That mix of sizable peak run-ups and deep drawdowns is what traders refer to when they talk about MFE and MAE: the best and worst intraperiod excursions from the entry.
Across the six midterm-year samples, the TradeWave Ratio of 1.75 signals that price has typically traveled a meaningful distance in the trade direction inside the window, not just drifted lower by a few points. The Sharpe ratio of 1.53, based on end-of-window outcomes, points to a historically attractive risk-adjusted profile for the short side, even after accounting for the occasional squeeze against the position. The trend chart also suggests that weakness tends to build through the middle of the window rather than hitting all at once on day one.
History does not guarantee future results; adverse excursions (MAE) can be large even in winning windows.
Why does MKS Instruments (MKSI) follow this seasonal pattern?
One likely driver is the way the semiconductor equipment cycle and corporate spending plans line up with the midterm election year. Early autumn often lands between major product ramps and ahead of year-end budget resets, which can leave orders and commentary looking softer just as investors reassess risk. Analysts have also pointed to portfolio repositioning around policy uncertainty in midterm years, which can hit cyclical, capital-spending-sensitive names like MKS Instruments harder than the broader market.
What is driving MKS Instruments (MKSI) today?
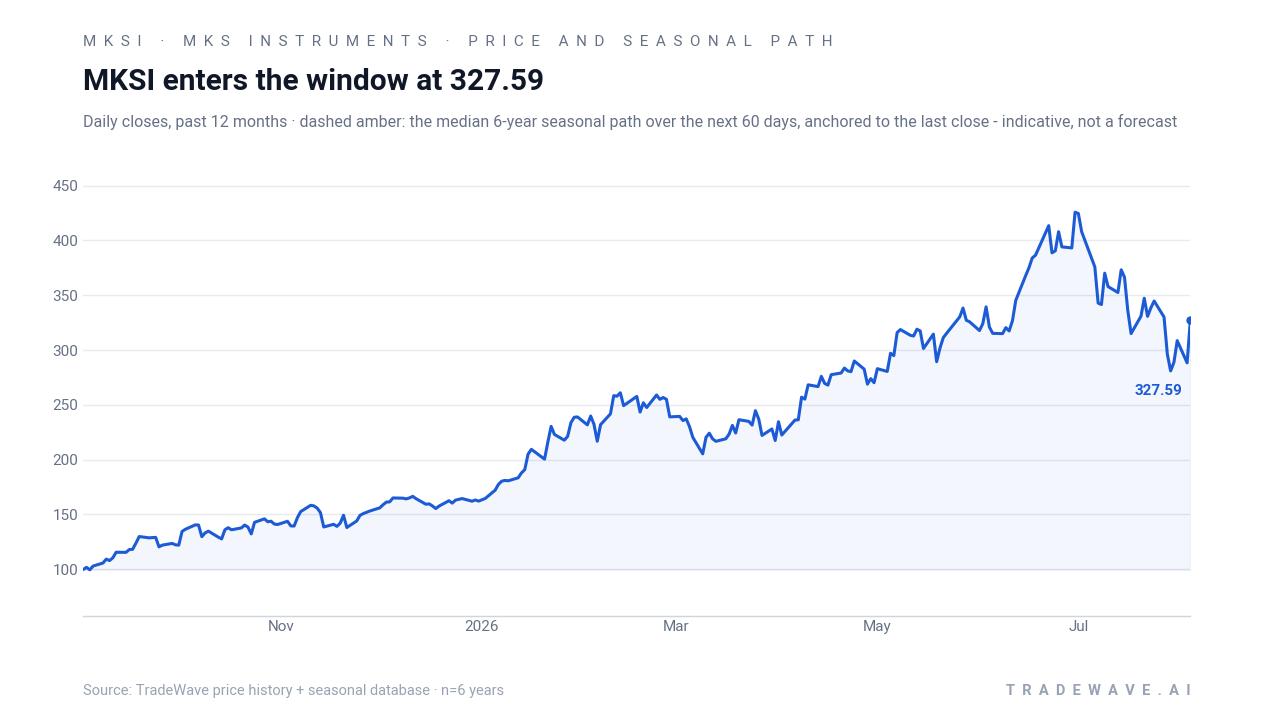
MKS Instruments closed at 313.10 on Aug 6, down 2.39% on the day and roughly 30.1% below its 52-week high of 447.62, even after a powerful multi-quarter run that has left the stock far above its 52-week low near 87.85. The pullback comes as investors focus on Q2 2026 earnings scheduled for Aug 5, where the company has guided to about $1.20 billion in revenue, plus or minus $40 million, and non-GAAP earnings of $2.90 per share, plus or minus $0.30, with semiconductor, electronics and specialty industrial end markets all in play.[1]
In early August, coverage highlighted that MKS Instruments shares climbed 13.9% on heavier-than-usual trading volume, a move tied to renewed interest around AI-related board demand and a narrative that the stock could be materially undervalued relative to its growth prospects.[7] That surge followed a Q1 2026 report where revenue of $1.08 billion topped expectations and commentary pointed to strong semiconductor and AI-driven demand across wafer fab equipment and electronics packaging, reinforcing the idea that MKS is riding a powerful secular wave even as cyclical swings remain a risk.[1]
Valuation has become a central debate. In June, Simply Wall St analysis carried on Yahoo Finance argued that MKS Instruments’ share price had run ahead of some fair-value estimates, citing a consensus analyst price target around $122.31 that now sits far below the current stock price and likely reflects an earlier, lower trading regime.[2] That tension between AI-fueled growth narratives and older, lower price targets is part of why the upcoming midterm-year seasonal window matters: it arrives just as investors are deciding whether to lean into the momentum or lock in gains after a steep climb.
The chart below situates the latest move in its recent multi-month context, alongside the historical median seasonal path for the next 60 days.
What should traders watch as the Sep 2–Oct 2 window approaches?
The first checkpoint is Q2 2026 earnings and guidance. Any shift in the company’s revenue outlook for semiconductor, electronics and specialty industrial segments, or changes to the non-GAAP EPS range, could reset expectations just weeks before the seasonal window opens.[1] Traders will be watching whether management leans into the AI and wafer fab demand story or signals a more cautious stance on orders and margins.
Second, price behavior relative to key levels will matter. With the stock about 30.1% below its 52-week high and trading under its 50-day moving average of roughly 346.69, a sustained push back above that moving average would signal that buyers are willing to look through the historical seasonality. Failure to reclaim that band, or a rejection from it, would fit more closely with the pattern of prior midterm-year windows where rallies faded into September.
Third, traders should monitor whether the early-August volume spike and AI-driven enthusiasm prove durable. If heavy trading and upside interest continue to build into late August, the seasonal window could open with positioning skewed long, which in past cycles has sometimes set the stage for sharper downside when sentiment cools.[7] If instead volume and momentum fade, the stock could drift into the window already in consolidation mode, which historically has still not prevented further weakness but can change the character of the move.
Finally, the broader policy and macro backdrop of the midterm election year will frame how this MKS Instruments seasonal trend interacts with the market. Any shifts in fiscal policy, industrial subsidies, export controls or interest-rate expectations that affect semiconductor capital spending could either reinforce or blunt the historical pattern. The key tell will be whether price action during the Sep 2–Oct 2 stretch once again lines up with the six-for-six record of prior midterm years, or whether this cycle breaks the streak.
Sources
- 1. Yahoo Finance (article referencing Zacks), “MKSI Gears Up to Report Q2 Earnings: What's in Store for the Stock?” (Aug 4, 2026).
- 2. Yahoo Finance / Simply Wall St, “Assessing Whether MKS Instruments (MKSI) Looks Overvalued After Strong Recent Share Price Gains” (Jun 7, 2026).
- 3. Yahoo Finance / Simply Wall St, “Assessing MKS Instruments (MKSI) Valuation After Q1 2026 Beat And AI Semiconductor Demand Momentum” (May 10, 2026).
- 4. Yahoo Finance / Simply Wall St, “Is It Too Late To Consider MKS Instruments (MKSI) After Its Rapid Share Price Surge?” (Feb 11, 2026).
- 5. Yahoo Finance / Simply Wall St, “Is MKS Instruments (MKSI) Overvalued After Its Strong Recent Share Price Performance?” (May 24, 2026).
- 6. Yahoo Finance / Simply Wall St, “Assessing MKS Instruments (MKSI) Valuation After Q1 2026 Beat And AI Semiconductor Demand Momentum” (May 10, 2026).
- 7. Yahoo Finance / Simply Wall St, “MKS (MKSI) Could Be 27% Undervalued As AI Board Demand Lifts Interest” (Aug 2, 2026).
About this seasonal analysis
Seasonal pattern data is sourced from TradeWave.ai, which analyzes historical price behavior across annual calendar windows going back up to 30 years. Read the full data methodology or the book The 100-Year Pattern by Afshin Moshrefi (2026 edition). Past performance of seasonal patterns does not guarantee future results. This article is for informational purposes only and does not constitute investment advice.