HP Inc. (HPQ) Has Risen in 9 of 10 Midterm Fall-Winter Windows, Averaging 22% Gains
HP Inc. is rallying toward its highs in a strong AI and PC backdrop just weeks before a historically bullish Sep 4–Feb 16 trading window that has rarely produced losses.
Price as of Aug 4, 2026: $28.82 (last close).
What is the seasonal pattern for HP Inc. (HPQ)?
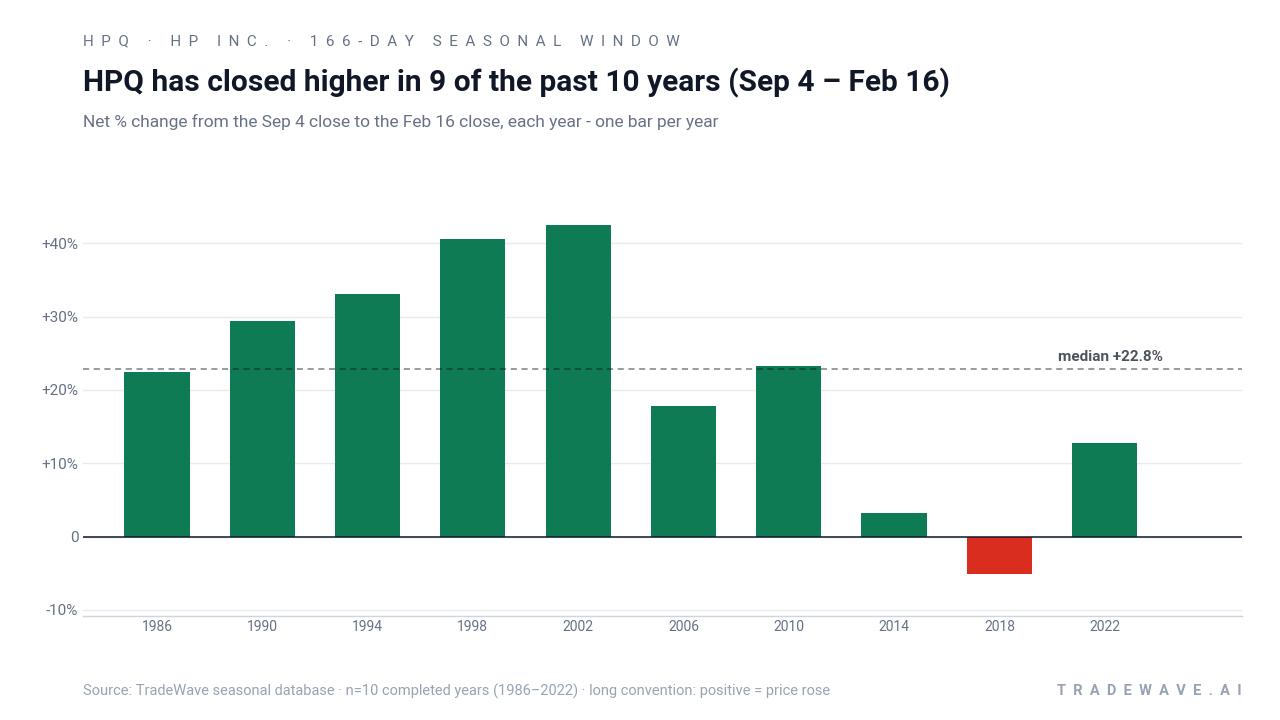
HP Inc. has risen in 9 of 10 years during the Sep 4–Feb 16 midterm-year window, with an average gain of 24.97% in winning years.
- 9 for 10 in this window, with winning years averaging 24.97% gains and only one losing year in the sample.
- Seasonal window runs from Sep 4 through Feb 16, spanning 166 days across the last 10 midterm election years.
- Percent Profitable is 90%, with 9 winners and 1 loser for the long trade setup in this HPQ seasonal trend.
- Including all years, the average outcome is a 22% gain, showing that losses have historically been smaller than the typical upside.
- Maximum favorable moves have reached as high as 67.22% in strong years, while the worst intraperiod drawdown hit -29.71%, underscoring real volatility.
- TradeWave Ratio of 1.37 and a Sharpe ratio of 1.31 point to a historically strong, but not risk-free, HP Inc. trading window.
According to historical data from TradeWave.ai, this midterm-year fall–winter stretch has behaved very differently from an average calendar period for HP Inc. The next sections dig into how that pattern lines up with today’s price action and the broader policy backdrop.
How has HP Inc. (HPQ) traded in the Sep 4–Feb 16 midterm-year window?
HP Inc. has rallied in 9 of the last 10 midterm election years during the Sep 4–Feb 16 window, posting an average 24.97% gain in the winning seasons. Shares finished the latest session at 28.82, up 6.27% on the day, roughly 40% higher year to date and about 1.0% below the 52-week high of 29.12. That combination of a strong historical season and a stock pressing against its highs is the setup traders are staring at as this year’s window approaches.
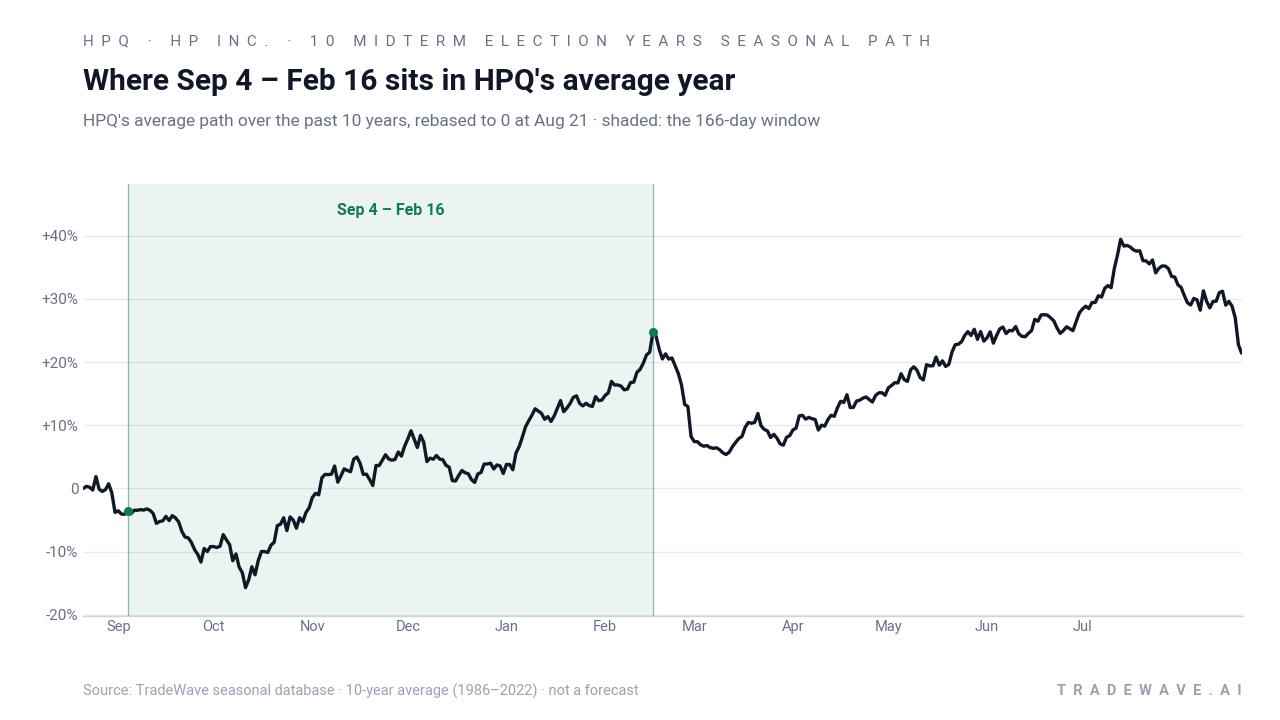
Because this pattern is grouped by the presidential election cycle, it only looks at HPQ’s behavior in the last 10 midterm election years, not in every calendar year. That matters in 2026, which is itself a midterm election year, as investors juggle policy uncertainty, rate expectations and sector rotation in technology hardware.
Across those 10 midterm-year samples, HP Inc.’s long trade direction has been clearly favored. Percent Profitable sits at 90%, with 9 winners and just 1 loser, and the all-years average outcome is a 22% gain over the 166-day span. The median profit of 22.8% is close to the average, which suggests the typical winning year has not been skewed by a single outlier.
The strongest historical year in this HPQ seasonal pattern came in 2002, when the stock gained 42.43% between Sep 4 and Feb 16, after reaching a maximum favorable move of 63.75% at one point in the window. At the other end of the spectrum, 2018 was the lone losing year, with a -5.08% net return and a worst intraperiod drawdown of -21.54% from the entry level. That mix shows that while the HPQ seasonal trend has leaned bullish, it has not been a straight line.
Looking across all years, the maximum favorable move has reached as high as 67.22% in 1998, while the deepest maximum adverse move hit -29.71% in 1990. In plain English, MFE, or maximum favorable excursion, is the best point-to-peak rally from the entry during the window, and MAE, or maximum adverse excursion, is the worst drawdown from that same entry. The fact that both numbers are large tells traders this has historically been a high-energy window where HPQ can swing hard in both directions before settling at the final close.
The TradeWave Ratio of 1.37 captures how far HPQ typically travels in the trade direction within the window, independent of where it finishes. Combined with a Sharpe ratio of 1.31 based on end-of-window outcomes, the statistics point to a historically strong long setup that has also delivered meaningful volatility along the way.
Year-by-year ranges show how those average gains have come with sizable swings inside the window.
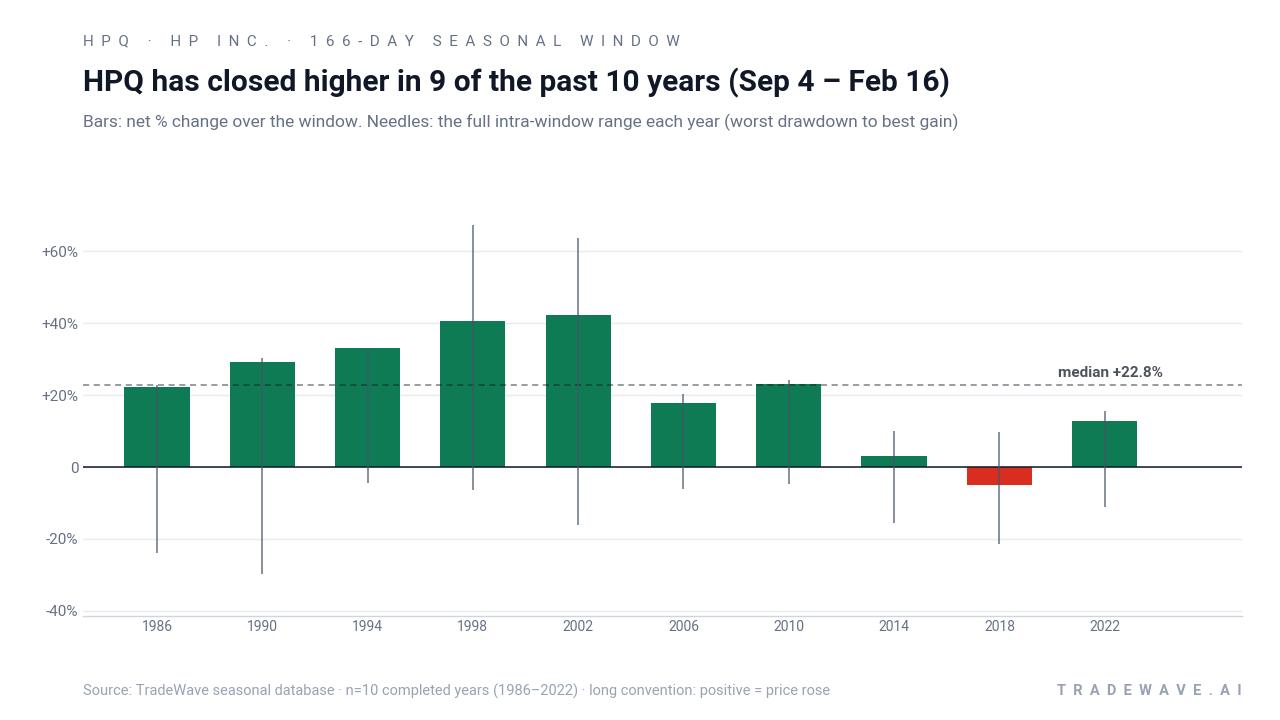
History does not guarantee future results; adverse excursions (MAE) can be large even in winning windows.
Why does HP Inc. (HPQ) follow this seasonal pattern?
One likely driver is the way HP’s fiscal calendar and product launches cluster around the back-to-school and holiday PC cycles, which often pull demand and investor attention into the fall and winter. Analysts have also pointed to institutional portfolio rebalancing in the year after a presidential election and into the midterm election year, which can favor established technology hardware names as policy and rate paths become clearer. For HPQ specifically, this midterm-year seasonal pattern may reflect a mix of earnings cadence, consumer spending cycles and sector rotation into value-oriented tech as investors position for the next phase of the election cycle.
What is driving HP Inc. (HPQ) today?
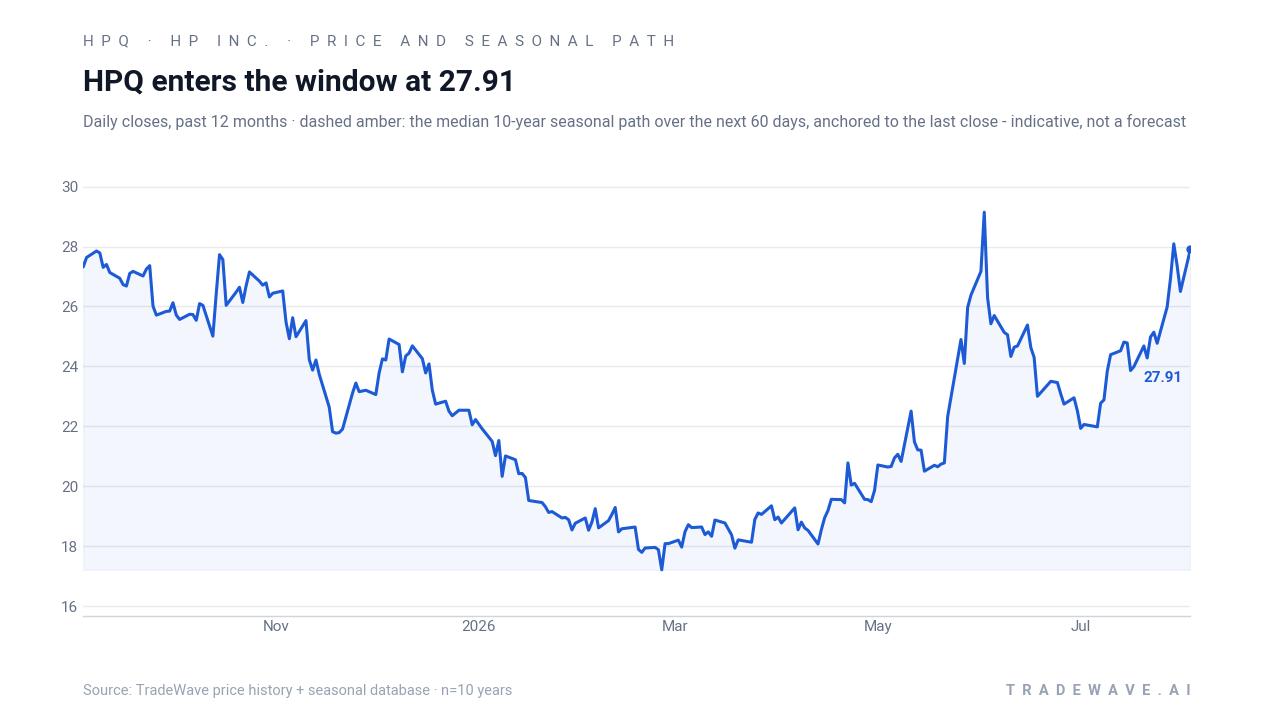
HP Inc. closed at 28.82, up 1.70 points or 6.27% on the session, leaving the stock roughly 40% higher year to date and about 1.0% below its 52-week high of 29.12. The move extends a strong run that has been building since late spring, helped by a fiscal second-quarter report on May 27 that showed revenue up 9% and $756 million in free cash flow, which improved confidence in HP’s ability to fund buybacks and dividends while investing in growth.[1]
On Jun 1, HP announced an AI-compatible PC product line built with NVIDIA technology, a move that plugged the company directly into the AI adoption theme that has been driving much of the market’s enthusiasm for hardware and semiconductors.[1] That announcement coincided with a spike in near-term call option activity, including almost 90 times normal volume in certain July 17 $35 calls, signaling that some traders were positioning for a more aggressive upside scenario in HPQ’s stock pattern analysis.[1]
More recently, options and ownership data have reinforced the sense that institutional money is leaning into the story. On Jul 28, MarketBeat flagged unusually large options trading in HPQ, highlighting elevated call activity that lined up with the stock’s push toward its highs.[3] Filings in late July and early August showed SEB Asset Management AB acquiring 434,210 HP Inc. shares and Pacer Advisors Inc. increasing its position, suggesting that at least some long-only managers are adding exposure as the technology hardware sector’s seasonal outlook improves.[4][5]
Insider activity has been more nuanced. Filings show insider David P. McQuarrie selling 10,524 shares across transactions on Jun 12 and Jul 28, at average prices of $24.68 and $27.98 respectively, with insider ownership around 0.18%.[4][5] The sales are modest in size relative to HP’s market value, but they offer a reminder that even in a strong HPQ seasonal trend, insiders may use rallies to trim positions.
The chart below situates the latest move in its recent multi-month context alongside the median seasonal projection.
What should traders watch as HPQ approaches this seasonal window?
First, the calendar. The 166-day window begins on Sep 4, placing it squarely in the concluding midterm election year and running deep into the year before the presidential election. Historically, that transition has been a constructive backdrop for risk assets, and HPQ’s own record in this slice of the calendar has been unusually strong.
Second, price levels. With HP Inc. trading just below its 52-week high, traders will be watching whether the stock can hold above the recent breakout zone around the mid- to high-$20s as the window opens. Sustained trading above the 50-day moving average, which currently sits near 24.59, would keep the uptrend intact and in line with the historical seasonality.
Third, options and volume. The earlier spike in call activity tied to AI-related catalysts showed how quickly speculative interest can build in HPQ when the narrative turns bullish.[1][3] If call volumes and open interest continue to expand into September, that would signal that traders are leaning into both the AI PC story and the historically strong HP Inc. trading window; a sharp fade in options activity would suggest a more cautious stance even as the seasonal pattern turns favorable.
Finally, macro and policy headlines. As the midterm election year wraps up, investors will parse any shifts in fiscal policy, regulation and rate expectations that could affect corporate IT budgets and consumer PC demand. For traders tracking this specific Sep 4–Feb 16 window, the key tell will be whether HPQ behaves like its historical playbook, with early drawdowns that are bought and rallies that extend, or whether a break below recent support and a deeper-than-usual intraperiod drawdown signals that this cycle is diverging from the past.
Sources
- Barchart, "HP Inc. Has Unusual Call Options Volume Today - Investors Bullish on HPQ Stock" (Jun 1, 2026)
- Google redirect of Barchart, "HP Inc. Has Unusual Call Options Volume Today - Investors Bullish on HPQ Stock" (Jun 1, 2026)
- MarketBeat, "HP Target of Unusually Large Options Trading (NYSE:HPQ)" (Jul 28, 2026)
- MarketBeat, "SEB Asset Management AB Acquires Shares of 434,210 HP Inc. $HPQ" (Jul 22, 2026)
- MarketBeat, "Pacer Advisors Inc. Increases Position in HP Inc. $HPQ" (Aug 3, 2026)
About this seasonal analysis
Seasonal pattern data is sourced from TradeWave.ai, which analyzes historical price behavior across annual calendar windows going back up to 30 years. Read the full data methodology or the book The 100-Year Pattern by Afshin Moshrefi (2026 edition). Past performance of seasonal patterns does not guarantee future results. This article is for informational purposes only and does not constitute investment advice.