8-for-8 Midterm Win Streak: CRH plc (CRH) Enters 305-Day Window Averaging 36.16% Gains
CRH plc is heading into a historically powerful 305-day midterm-election-year trading window even as the stock trades well below its 52-week high and digests a major Arcosa acquisition.
Price as of Aug 4, 2026: $98.84 (last close).

What is the seasonal pattern for CRH plc (CRH)?
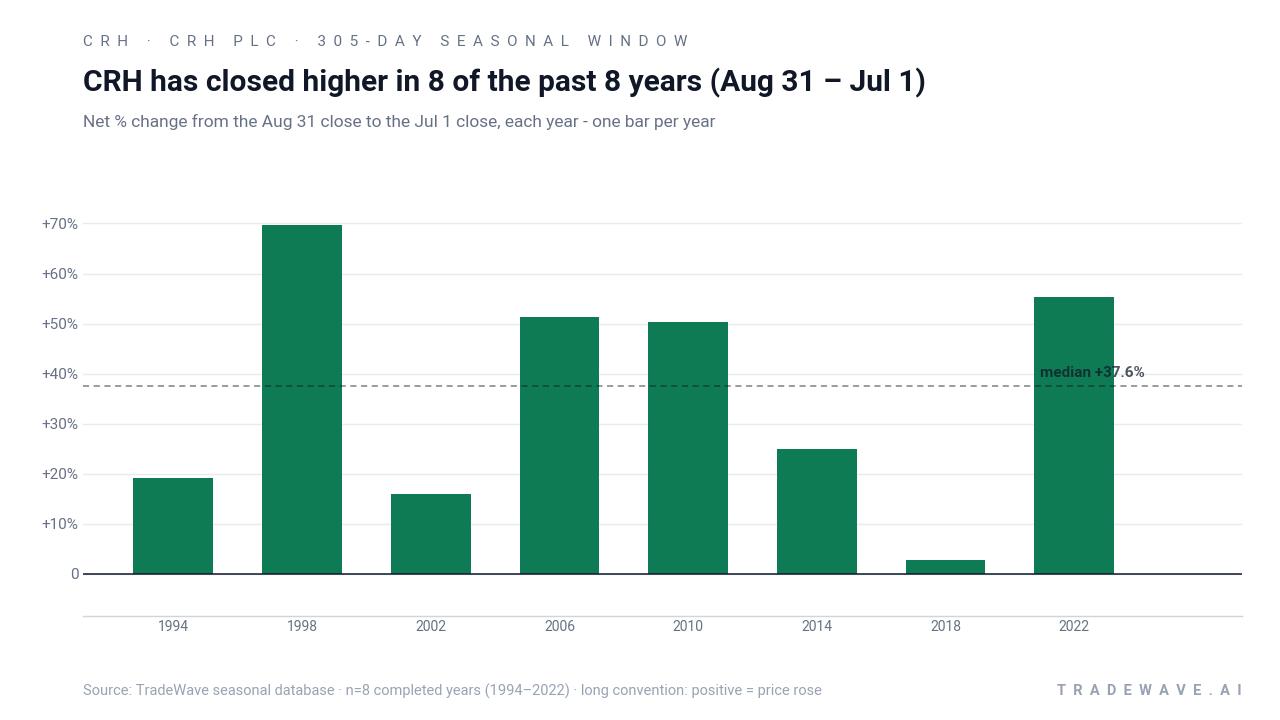
CRH plc has risen in 8 of 8 midterm-election-year windows starting Aug 31, with an average gain of 36.16% in winning years.
- 8 for 8 in this window, averaging 36.16% gains in winning years across the last 8 midterm election cycles.
- Seasonal window runs 305 days from Aug 31 to Jul 1, aligning with the midterm-to-pre-election phase of the U.S. presidential cycle.
- Percent Profitable is 100%, with 8 winners and 0 losers in the historical sample.
- Annualized return across these windows is 34.36%, compounding to a 962% cumulative gain when stacked year after year.
- TradeWave Ratio of 1.38 suggests price has typically traveled meaningfully in the long direction within the window, beyond just the final close.
- Intraperiod swings have included both sharp rallies and notable drawdowns, so timing and risk management have mattered even in winning years.
According to historical data from TradeWave.ai, this upcoming stretch for CRH plc behaves very differently from an average year, with a distinct midterm-election-year bias that has repeated across multiple cycles.
Seasonal window
CRH plc has closed higher in every single Aug 31 to Jul 1 midterm-election-year window across the last eight cycles, averaging gains of 36.16% for long positions. Shares finished Wednesday at 98.84, leaving the stock about 24.9% below its 52-week high of 131.55 and only modestly above its 52-week low, after sliding 8.36% over the past month.
The presidential election cycle matters here because this 305-day CRH plc trading window always begins late in a midterm election year and runs deep into the following pre-election year, a phase that has often coincided with heavy U.S. infrastructure and fiscal activity. Grouping only those midterm-year starts filters out noise from other parts of the cycle and isolates how CRH has behaved when policy and spending patterns look most like the current backdrop.
Across the eight midterm-election-year samples since 1994, the trade direction for this CRH seasonal pattern is long, and every instance has finished in the green. Percent Profitable sits at 100%, with 8 winners and 0 losers, and the average winner has gained 36.16% from the Aug 31 entry to the Jul 1 exit. The median outcome is close to that at 37.58%, which suggests the distribution of returns has been skewed toward consistently strong gains rather than a single outlier year carrying the average.
On a compounded basis, stacking this Aug 31 to Jul 1 window across the eight midterm cycles would have produced a 962% cumulative return, or an annualized 34.36%. That is a high number for any stock pattern analysis, and it reflects both the frequency of wins and the size of the typical move. The Sharpe ratio of 1.4 indicates that, based on end-of-window outcomes, the risk-adjusted profile has been favorable compared with many other long seasonal regimes.
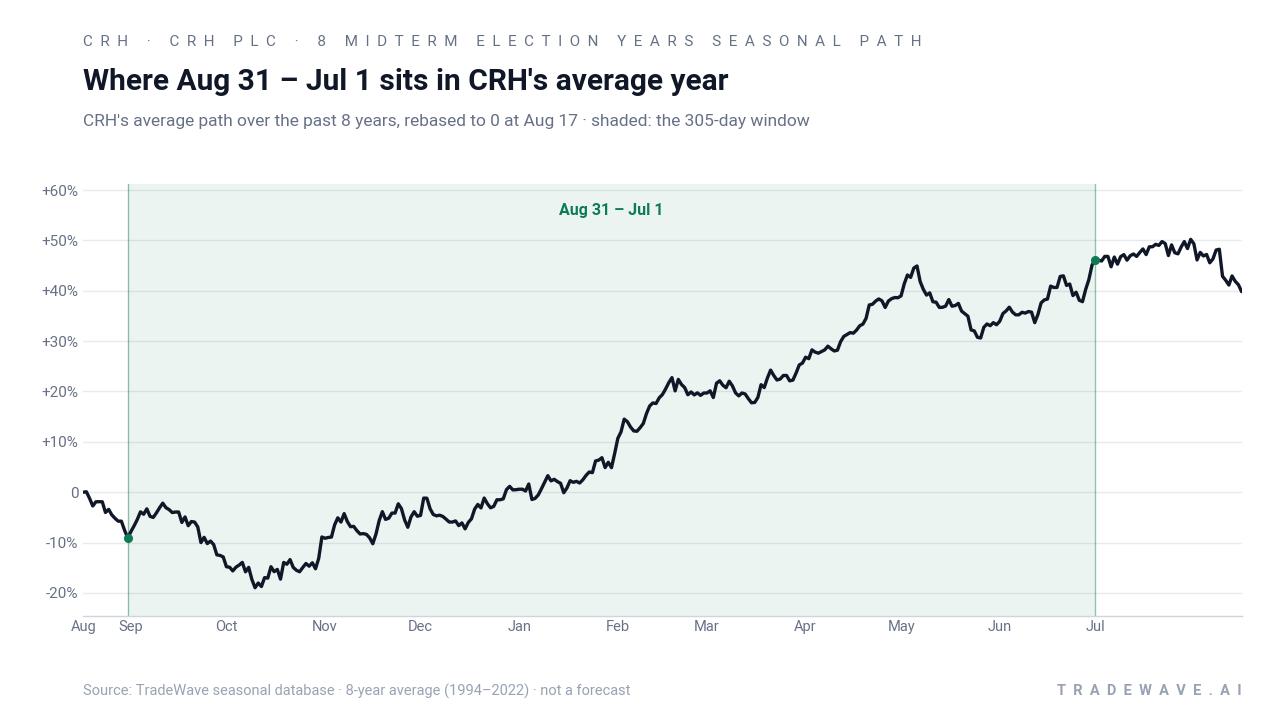
The historical seasonal average shows CRH’s path tending to grind higher through much of the 305-day span, with gains building as the window progresses rather than spiking only at the end. Early in the window, returns have often been modest and choppy, but by the second half, the average path slopes more steeply upward, consistent with the pre-election-year tendency for pro-growth policy and infrastructure themes to gain traction.
Year-by-year ranges show how much CRH has typically swung inside the window before finishing higher.
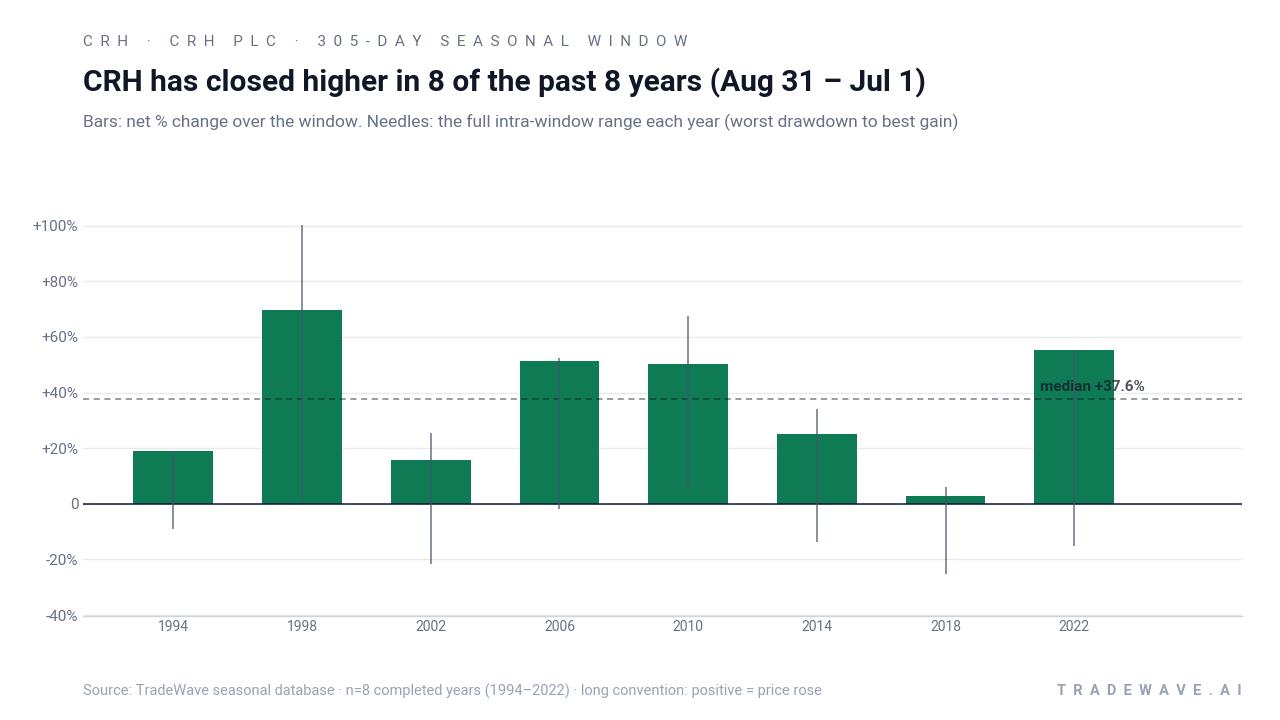
The intraperiod profile has not been a straight line. Maximum favorable excursion, or the best point-to-peak move within each window, has at times far exceeded the final net gain, such as in 1998 when CRH’s best intra-window rally topped 100.08% before settling at a 69.61% close. Maximum adverse excursion, the worst drawdown from entry, has also been meaningful in several years, including a 25.15% dip in 2018 even though the trade still finished up 2.74%. Add it up and the pattern has favored longs, but with swings that reward patience and risk controls rather than blind buy-and-hold.
History does not guarantee future results; adverse excursions can be large even in winning windows, and any repeat of this CRH seasonal trend could still involve deep drawdowns along the way.
Why does CRH plc (CRH) follow this seasonal pattern?
One likely driver is the clustering of infrastructure and construction spending decisions around the midterm-to-pre-election phase, when governments often accelerate visible projects ahead of the next presidential vote. Analysts have also pointed to portfolio rebalancing into building materials and industrial names during pre-election years, as investors lean into pro-growth and fiscal-support themes. For a global aggregates and infrastructure supplier like CRH, that combination of policy timing and sector rotation may help explain why this specific Aug 31 to Jul 1 window has been so consistently strong in midterm election years.
What is driving CRH plc (CRH) today?
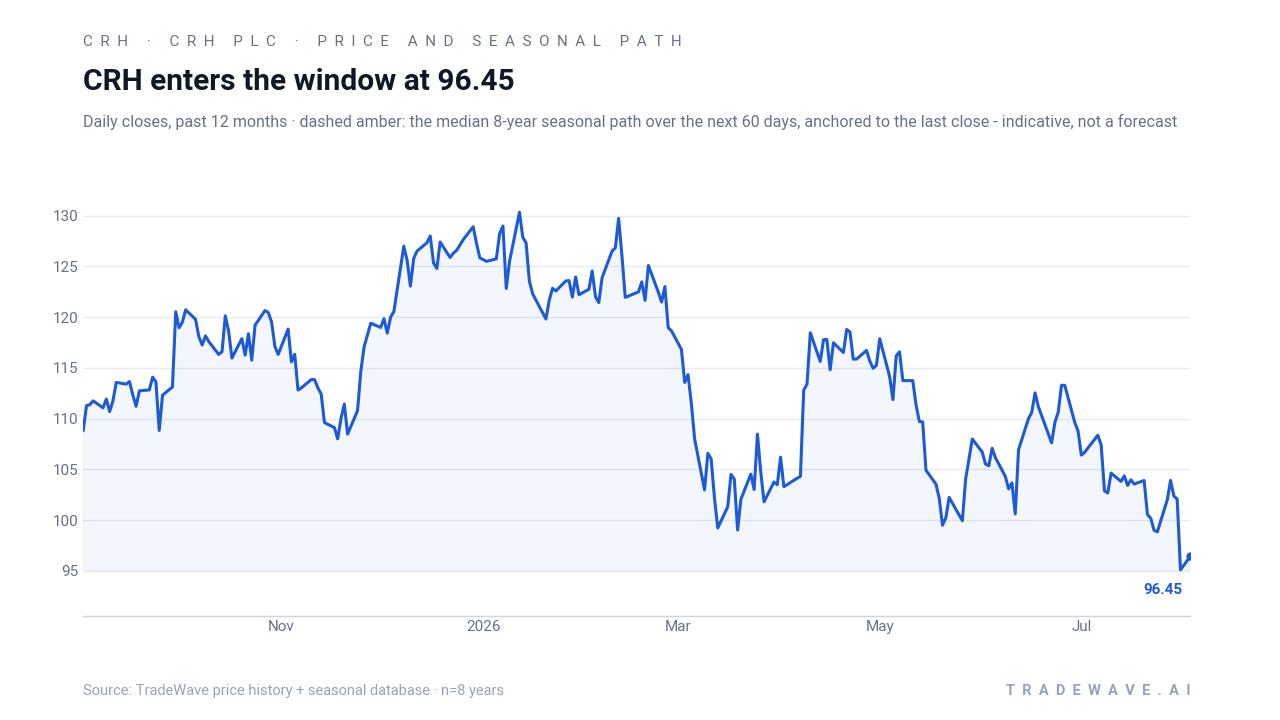
CRH plc shares ended the latest session at 98.84, up 0.25 on the day, as the stock traded between 97.70 and 99.89 on volume of about 4.46 million shares. That leaves CRH roughly 24.9% below its 52-week high of 131.55 and only a few dollars above its 52-week low, after a 1-month slide of 8.36% that has pulled the price below its 50-day moving average of 104.83.
The near-term story is dominated by deal-making rather than seasonality. On Jun 22, 2026, CRH agreed to buy Arcosa in an all-cash transaction valued at about $8.5 billion, offering $150 per Arcosa share and targeting a closing in the first quarter of 2027.[1] The acquisition is designed to expand CRH’s footprint in infrastructure-related products, deepening its exposure to U.S. transportation, utility and construction spending at a time when public and private capital are both flowing into large-scale projects.[1]
Sector-wide, the building materials M&A wave has reinforced the idea that scale and integrated product offerings will matter more as infrastructure pipelines lengthen and regulatory requirements tighten.[1] For CRH, that strategic backdrop helps frame the upcoming seasonal window: the company is leaning into the same policy and spending currents that have historically lined up with its strongest midterm-year trading stretch.
The chart below situates the latest pullback against the past year of trading and a 60-day seasonal projection.
In the near term, traders are weighing integration risk and financing for the Arcosa deal against the potential earnings and cash flow uplift once the transaction closes.[1] The stock’s slide below its 50-day moving average and its proximity to the 52-week low suggest sentiment has cooled after a strong run earlier in the year, which makes the timing of the historically strong Aug 31 to Jul 1 CRH seasonal trend particularly notable.
What should traders watch as the Aug 31 window approaches?
First, the calendar. The 305-day CRH plc trading window tied to the midterm-to-pre-election phase opens on Aug 31, so price behavior in the back half of August will set the starting tone. A continued drift near the 52-week low would mean the stock enters a historically strong seasonal regime from a depressed base, while an early bounce would signal that buyers are already leaning into the pattern.
Second, levels. On the downside, the recent 52-week low around 92.32 is the key line in the sand; a decisive break below it inside the window would mark a departure from prior cycles, which all finished higher despite some deep drawdowns. On the upside, reclaiming the 50-day moving average near 104.83 and then the triple-digit mid-range between 110 and 120 would show that the stock is tracking closer to its historical midterm-year seasonal trend.
Third, catalysts. Progress on regulatory approvals and closing milestones for the Arcosa acquisition will be central, since the deal is meant to amplify CRH’s exposure to the same infrastructure and construction themes that have historically aligned with this window.[1] Any signs that the transaction is delayed or reworked could blunt the usual midterm-year seasonal tailwind, while smooth execution and clear synergy targets would reinforce it.
Finally, behavior inside the window. In prior midterm-election years, CRH has often tolerated sizable intraperiod drawdowns before finishing strongly higher, with maximum adverse excursions as deep as roughly 25% in 2018 even though the trade still ended positive. If the stock again shows the ability to absorb volatility without breaking key support and then grinds higher into the pre-election year, that would be consistent with the established CRH seasonal trend. A failure to stabilize or a pattern of lower highs and lower lows through the heart of the window would be the clearest sign that this cycle is diverging from the past.
Sources
About this seasonal analysis
Seasonal pattern data is sourced from TradeWave.ai, which analyzes historical price behavior across annual calendar windows going back up to 30 years. Read the full data methodology or the book The 100-Year Pattern by Afshin Moshrefi (2026 edition). Past performance of seasonal patterns does not guarantee future results. This article is for informational purposes only and does not constitute investment advice.