Procter & Gamble (PG) Has Closed Higher in Every Sep 2-Jan 16 Midterm Window Since 1986
Procter & Gamble is heading into a historically strong Sep–Jan trading window just as 2026 returns lag and management leans on cost cuts and a big wellness deal to reset growth.
Price as of Aug 5, 2026: $146.80 (last close).

What is the seasonal pattern for Procter & Gamble (PG)?
Procter & Gamble has risen in 10 of 10 midterm-year Sep 2 to Jan 16 windows, with an average gain of 8.08% in winning years.
- 10 for 10 in this window, with Procter & Gamble averaging 8.08% gains across all winning years.
- Seasonal window runs from Sep 2 through Jan 16 in midterm election years, spanning 137 calendar days.
- Percent Profitable is 100%, with 10 winners and 0 losers across the last 10 midterm election-year cycles.
- Average winner gains cluster near 10%, with a median profit of 9.97% and cumulative return of 116% when the window is repeated.
- Intraperiod swings have been meaningful, with some years showing double-digit drawdowns before finishing higher.
- Trade Direction is long, supported by a TradeWave Ratio of 2.37 and a Sharpe ratio of 1.91 for this specific PG seasonal trend.
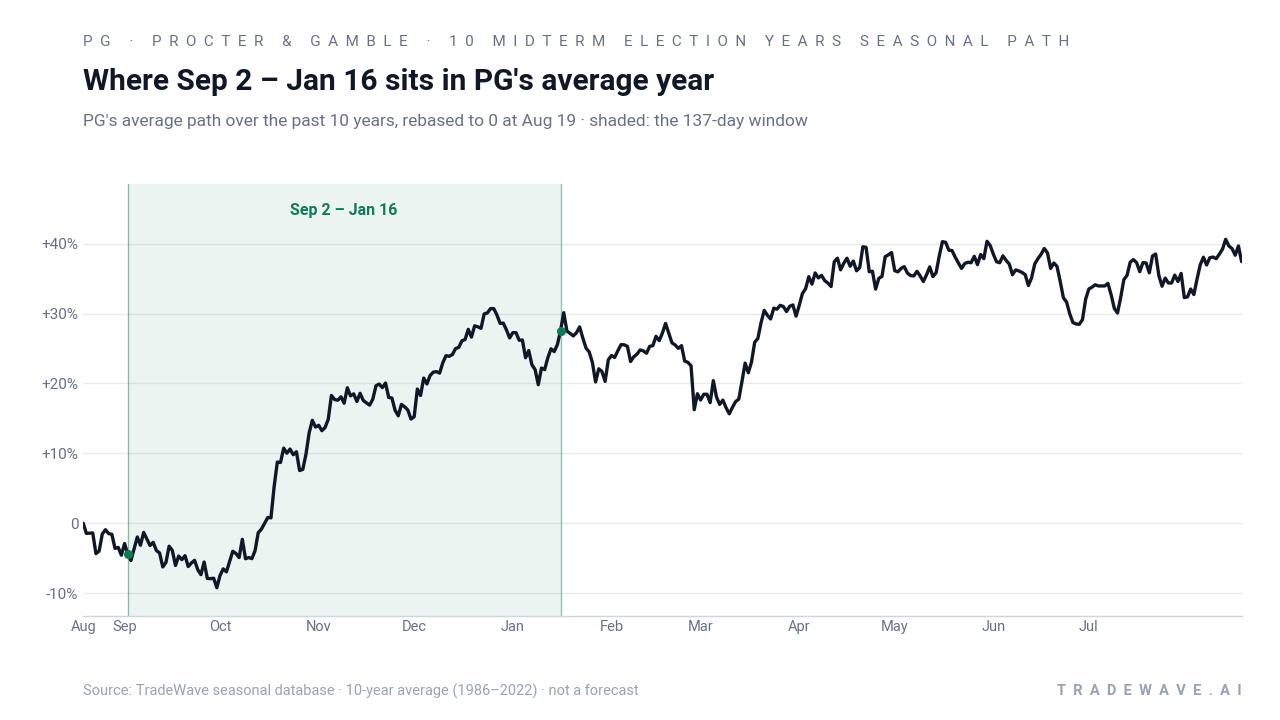
According to historical data from TradeWave.ai, Procter & Gamble’s behavior in midterm election years shows a distinct fall-to-winter pattern that differs from its average year.
How has Procter & Gamble (PG) traded in the upcoming Sep–Jan window?
Procter & Gamble has finished higher in every single Sep 2 to Jan 16 window across the last 10 midterm election years, averaging 8.08% gains for long positions. The stock closed Thursday at 146.80, down 0.8% on the day and off 12.2% year to date as it approaches this historically strong stretch. That combination of a clean 10-for-10 seasonal record and a weak setup into the window is rare for a defensive consumer-staples bellwether.
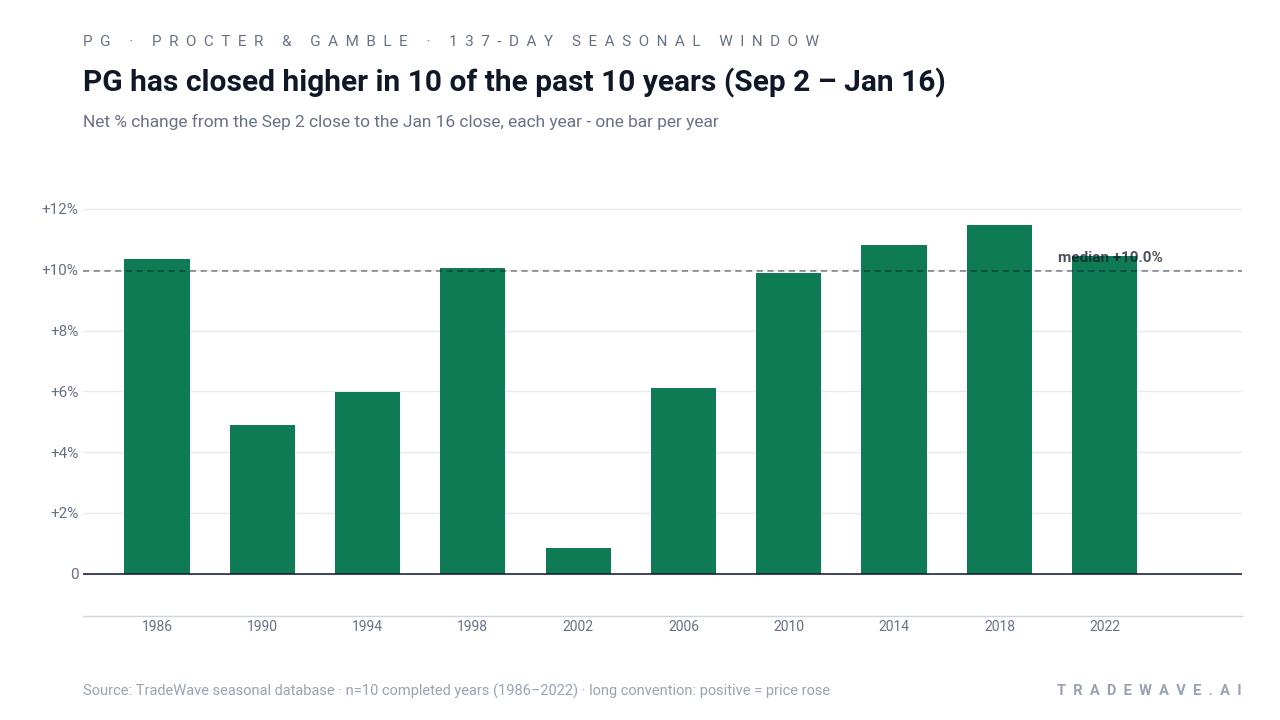
Grouping the data by the presidential election cycle matters here because this window always lands in the heart of a midterm election year, when policy uncertainty is high but markets often start to look ahead to the typically stronger pre-election year. For a consumer-staples heavyweight like Procter & Gamble, that has historically coincided with investors rotating back into quality defensives after spending the first half of the year chasing growth and cyclicals.
This seasonal window begins on Sep 2 and spans 137 days, covering the back-to-school period, the holiday quarter and the early weeks of the new calendar year. Historically, during this period, Procter & Gamble has shown a strong upside tendency for long positions, with every midterm-year iteration finishing in the green. The median profit of 9.97% sits slightly above the all-years average, which suggests the gains are not being skewed by a single outlier year.
The per-year breakdown shows how consistent that pattern has been. The weakest outcome in the sample was 0.84% in 2002, while the strongest years, such as 2014 and 2018, delivered double-digit net returns of 10.81% and 11.46% respectively. Even in 2022, a challenging year for many consumer names, this specific Sep–Jan window still produced a 10.46% gain for PG.
A second view of the same window highlights how far PG has typically swung up and down inside each season before settling at its final gain.
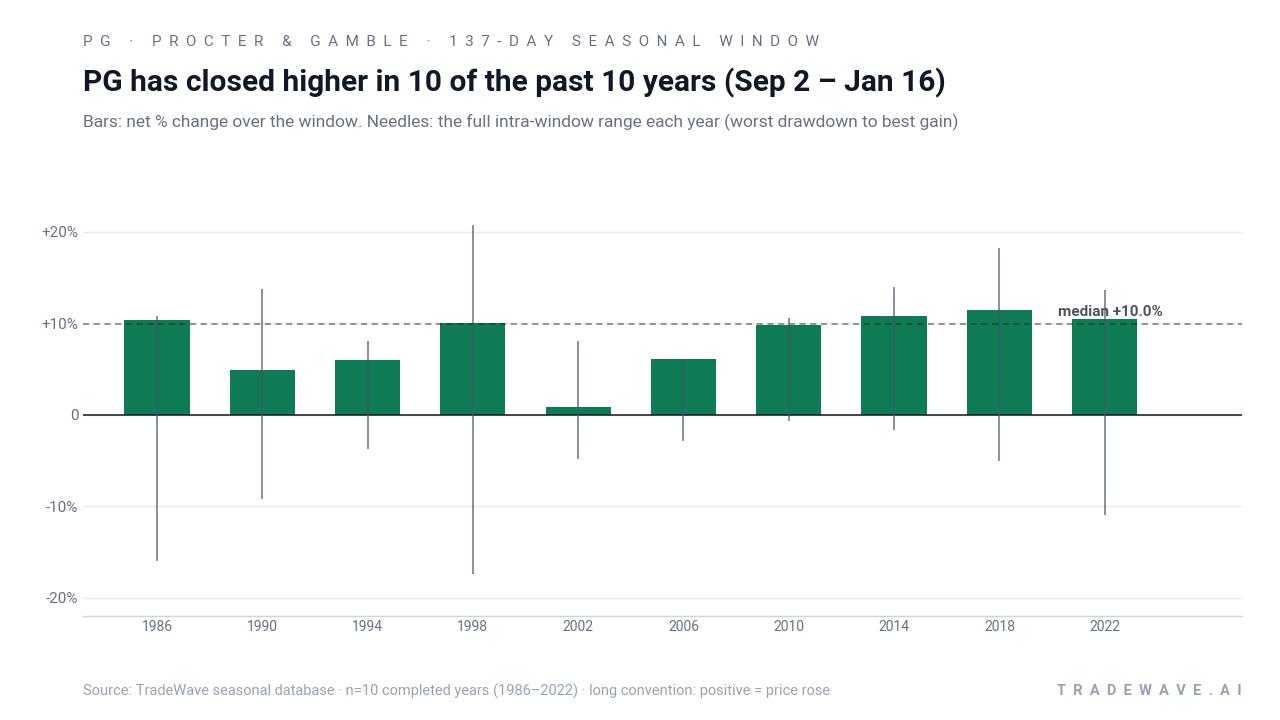
The maximum favorable move, or best run-up from the entry during the window, has reached into the low to mid-teens in several years, with 1998 and 2018 seeing peak gains above 18%. On the downside, the maximum adverse move, or worst drawdown from the entry, has at times been sharp, including intraperiod drops of roughly 16% in 1986 and more than 17% in 1998 before the stock recovered to finish higher. That mix of strong MFE and sizable MAE is what drives the TradeWave Ratio of 2.37, indicating that PG has typically traveled meaningfully in the trade direction while still subjecting holders to notable swings along the way.
The cumulative chart for this pattern compounds each of those 10 midterm-year windows and reaches a total gain of 116%, underscoring how repeating the same Sep–Jan slice has historically stacked returns. Add it up: a long-only investor who only held PG during this specific 137-day window in each of the last 10 midterm election years would have more than doubled their money from these periods alone.
History does not guarantee future results; adverse excursions can be large even in winning windows, and PG has previously suffered double-digit drawdowns inside this pattern before closing higher.
Why does Procter & Gamble (PG) follow this seasonal pattern?
One likely driver is the clustering of PG’s fiscal-year guidance updates and holiday-season demand within this Sep–Jan stretch, which can focus investor attention on pricing power and margin resilience. Analysts have also pointed to institutional portfolio rebalancing in midterm election years, where money rotates back into defensive consumer staples as policy uncertainty peaks and the market starts to discount the typically stronger pre-election year. The pattern may also reflect consumer spending cycles, with back-to-school, cold-and-flu season and holiday shopping all boosting demand for PG’s household and personal-care brands.
What is driving Procter & Gamble (PG) today?
PG slipped 0.8% Thursday to 146.80, extending a tough 2026 that has left the stock down 12.2% year to date and trailing the broader market. The latest leg lower followed fiscal fourth-quarter results on Jul 28 that missed organic sales expectations, showed flat overall volume and came with a muted fiscal 2027 outlook that flagged softer U.S. consumers and a roughly $1 billion after-tax hit from raw materials inflation.[2]
The earnings report painted a mixed picture beneath the headline numbers. Beauty grew 4% organically, but healthcare fell 1% and the Baby, Feminine and Family segment declined 2%, underscoring how lower-income shoppers are trading down or delaying purchases while higher-income consumers continue to spend on innovations.[2] Management guided to just 1% to 3% organic sales growth for fiscal 2027 and earnings of $6.89 to $7.11 per share, framing the coming year as another transition period rather than a clean re-acceleration.[2]
Analysts have started to reset expectations around that message. On Jul 31, HSBC cut PG to Hold from Buy, arguing that reinvestment in brands and innovation is not yet translating into margin recovery and that investors may need to wait longer for operating leverage to show up in earnings.[3] The downgrade helped cement a more cautious tone around the stock, even as PG’s long-term defensive profile and dividend track record remain intact.
The strategic backdrop shifted again this week. On Aug 4, PG agreed to buy supplements maker Thorne for $3.8 billion, a move that pushes the company deeper into premium health and wellness categories that have been growing faster than traditional household staples.[5] Follow-up analysis on Aug 5 framed the deal as a way to tap into self-care trends and diversify PG’s portfolio, but also noted that investors will be watching integration risk and the pace at which the acquisition can offset pressure in slower-moving legacy categories.[4]
Macro conditions are adding another layer. Consumer demand has split along income lines, with higher-income households still willing to pay for new formulations and premium brands while lower-income shoppers remain cautious, pressuring volumes and forcing PG to balance pricing with affordability.[2] That tension helps explain why the company is leaning on cost discipline and targeted innovation rather than broad-based price hikes as it navigates inflation in raw materials and a more fragile consumer backdrop.
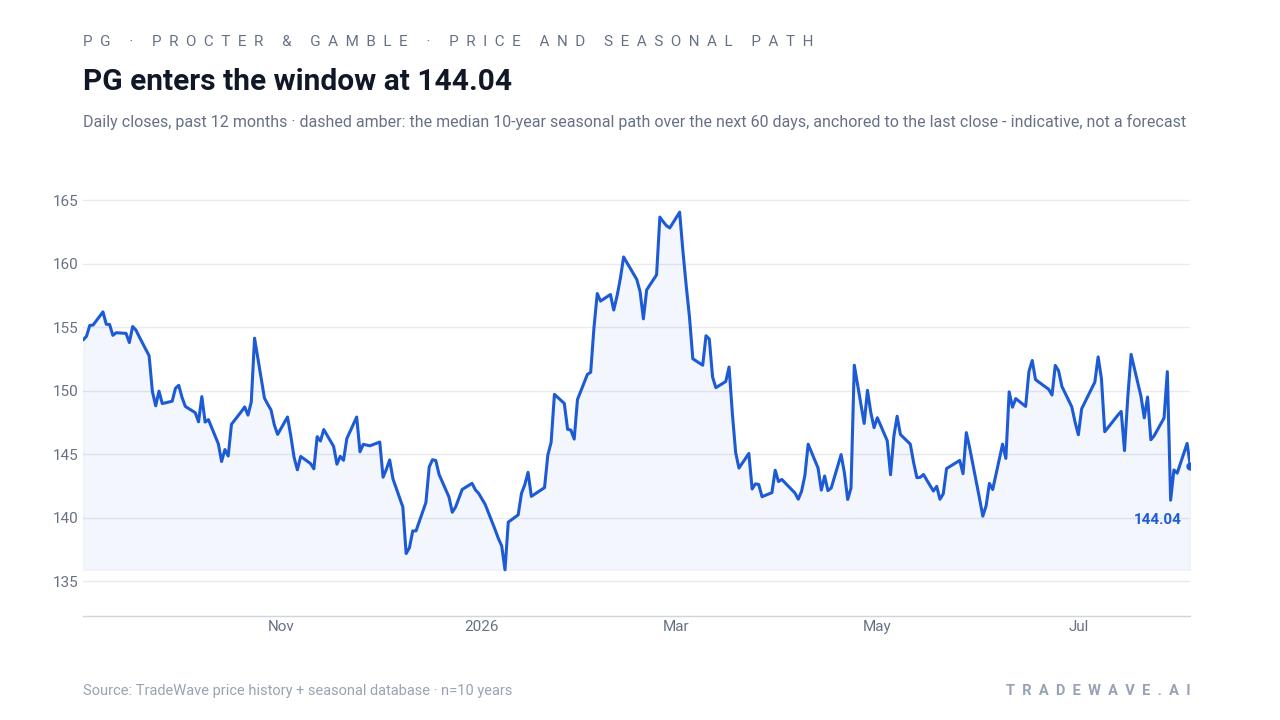
The chart below situates the latest move in its recent multi-month context, alongside a historical seasonal projection for the next two months.
What should traders watch as this PG seasonal window approaches?
The first marker is the calendar itself. The Sep 2 start date lands just after PG’s latest earnings reset and the Thorne acquisition announcement, so any shift in price behavior as the window opens will be occurring against a backdrop of fresh guidance and a new strategic narrative.[2][5] If the stock continues to lag into late August, the contrast between a weak tape and a historically strong Sep–Jan pattern will become more pronounced.
Second, watch how PG trades around upcoming macro data on inflation and consumer spending, which will feed directly into the company’s raw-materials cost outlook and demand profile.[2] A stabilization in input costs or signs that lower-income consumers are holding up better than feared would make it easier for the historical PG seasonal trend to reassert itself.
Third, price levels matter. The 52-week range currently runs from about 133.67 to 164.76, putting Thursday’s close roughly 10.9% below the high and 9.8% above the low. How PG behaves if it revisits the mid-130s or pushes back toward the mid-150s during the window will offer a real-time test of whether this midterm-year pattern is still influencing flows.
Finally, traders should monitor whether PG’s role inside the consumer-staples complex changes as the midterm year gives way to the pre-election year. Historically, this Sep–Jan window has coincided with investors rotating toward quality defensives ahead of a typically stronger market phase, and PG has been a beneficiary in each of the last 10 midterm cycles. If the stock fails to attract that support this time, or if intraperiod drawdowns start to resemble the deeper MAE years without the usual recovery, it would be an early sign that the long-running PG seasonal trend may be weakening.
Sources
- Barchart via Yahoo Finance, “Procter & Gamble Company Stock: Analyst Estimates & Ratings,” Nov 5, 2025.
- Yahoo Finance, “P&G stock dips on soft outlook despite 'stable' consumer,” Jul 30, 2026.
- Yahoo Finance, “Humana upgraded, Las Vegas Sands downgraded,” Jul 31, 2026.
- Simply Wall St via Yahoo Finance, “Procter & Gamble (PG) Agrees To Buy Thorne For $3.8 Billion,” Aug 5, 2026.
- Reuters, “P&G buys supplements maker Thorne for $3.8 billion as wellness push intensifies,” Aug 4, 2026.
- Forbes, “Markets snapshot (includes PG price),” Aug 4, 2026.
About this seasonal analysis
Seasonal pattern data is sourced from TradeWave.ai, which analyzes historical price behavior across annual calendar windows going back up to 30 years. Read the full data methodology or the book The 100-Year Pattern by Afshin Moshrefi (2026 edition). Past performance of seasonal patterns does not guarantee future results. This article is for informational purposes only and does not constitute investment advice.