Apple Inc. (AAPL) Has Rallied in 10 of 10 Midterm Jul 26 Windows, Averaging 35.66% Gains
Apple Inc. is trading just above its 52-week high as a historically powerful 347-day midterm-election seasonal window reopens, raising the stakes for a stock that already anchors the market.
Price as of Jul 28, 2026: $340.08 (last close).
What is the seasonal pattern for Apple Inc. (AAPL)?
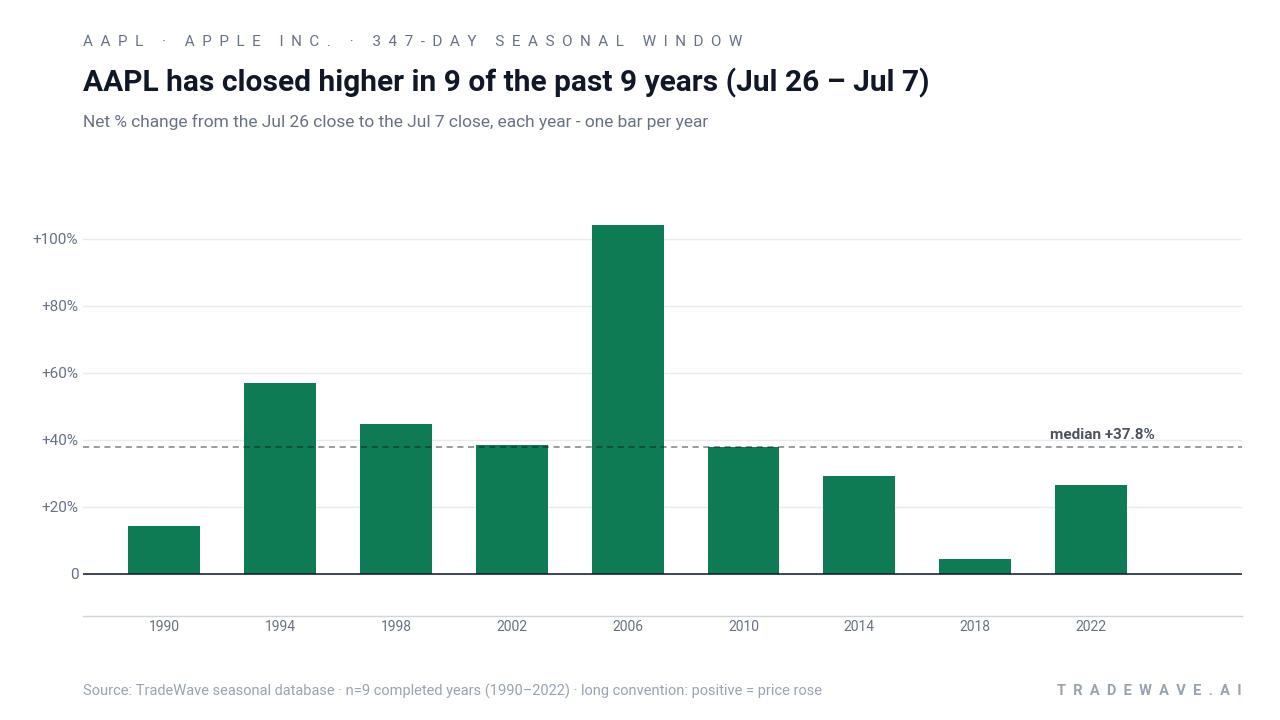
Apple Inc. has risen in 10 of 10 midterm-election-year windows starting Jul 26, with an average gain of 35.66% in winning years.
- 10 for 10 in this window, averaging 35.66% gains in winning years across the last 10 midterm election years.
- Seasonal window runs 347 days from Jul 26, aligning with the midterm-to-pre-election stretch in the presidential cycle.
- Percent Profitable is 100%, with 10 winners and 0 losers in the historical sample.
- Annualized return across completed windows is 32.97%, with a cumulative gain of 1,627% when stacking the pattern.
- TradeWave Ratio is 1.4, indicating price has typically traveled meaningfully in the long direction within the window.
- Sharpe ratio of 1.07 reflects a strong risk-adjusted profile despite sizable swings inside individual years.
According to historical data from TradeWave.ai, this midterm-election stretch has behaved very differently from an average year for Apple Inc., and the latest iteration is already underway.
How strong is Apple Inc. (AAPL)’s midterm-year seasonal window from Jul 26?
Apple Inc. has risen in 10 of the last 10 midterm election years during the 347-day window that starts on Jul 26, averaging 35.66% gains for the stock. Shares finished Tuesday at $340.08, up 0.9% on the day and about 0.2% above the 52-week high of $339.57, leaving almost no air gap between the seasonal window and record territory. That combination of a clean 10-for-10 historical record and a stock already pressing new highs gives this year’s window unusual weight for both Apple holders and broader index watchers.
The presidential election cycle matters here because this pattern only looks at midterm election years, then tracks Apple from late July through the following July as markets transition into the year before the presidential election. Historically that midterm-to-pre-election bridge has been one of the strongest stretches for risk assets, and Apple’s own seasonal trend inside that regime has been even more pronounced.
Across the last 10 midterm election years in the sample, every single Jul 26-starting window finished higher, with an annualized return of 32.97% and a cumulative gain of 1,627% when the windows are stacked. The average winner gained 35.66%, while the median outcome of 33.46% shows that results have clustered around a strong double-digit advance rather than being skewed by a single outlier year. For a long-only pattern, that kind of consistency is rare, especially in a mega-cap that already dominates index weightings.
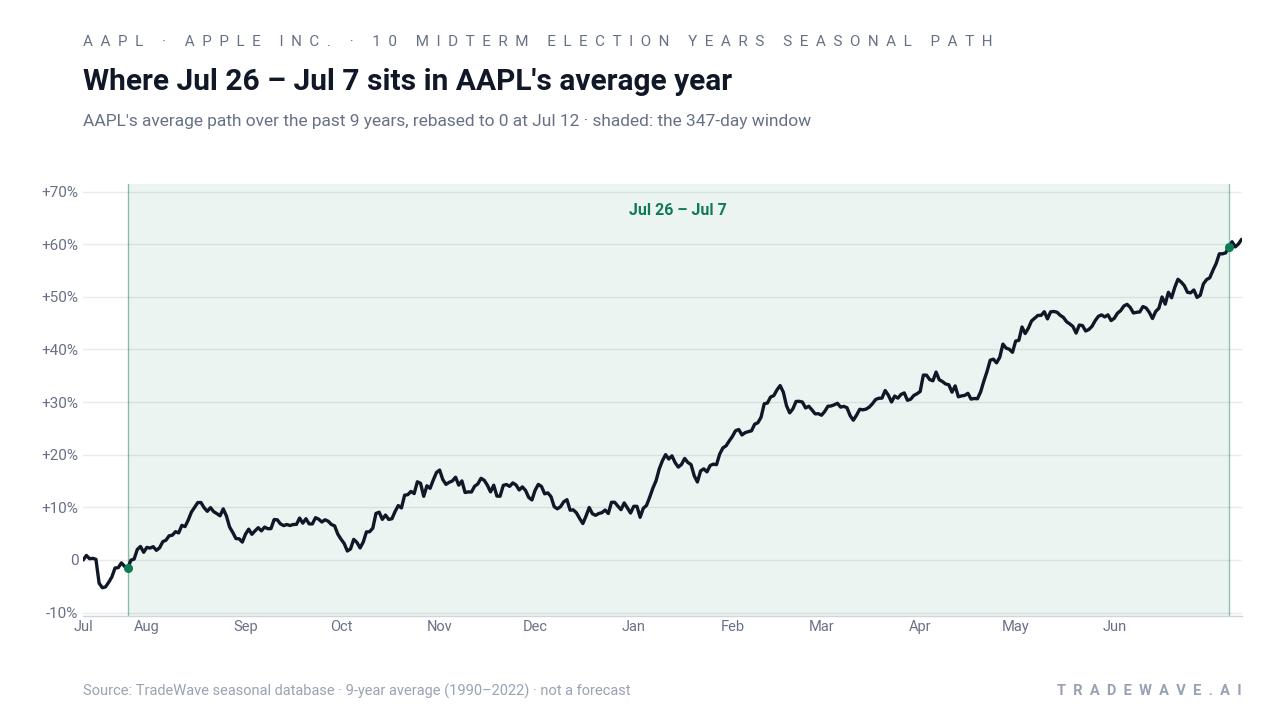
The historical seasonal average path suggests that Apple’s strength in this window is not just a late-surge story. Gains have tended to build through the year, with the shaded window in the trend chart showing a steady climb rather than a single spike, which fits a narrative of sustained demand through product cycles and into the pre-election year.
Year-by-year bars with intraperiod ranges show how much Apple has typically swung inside this otherwise consistent window.
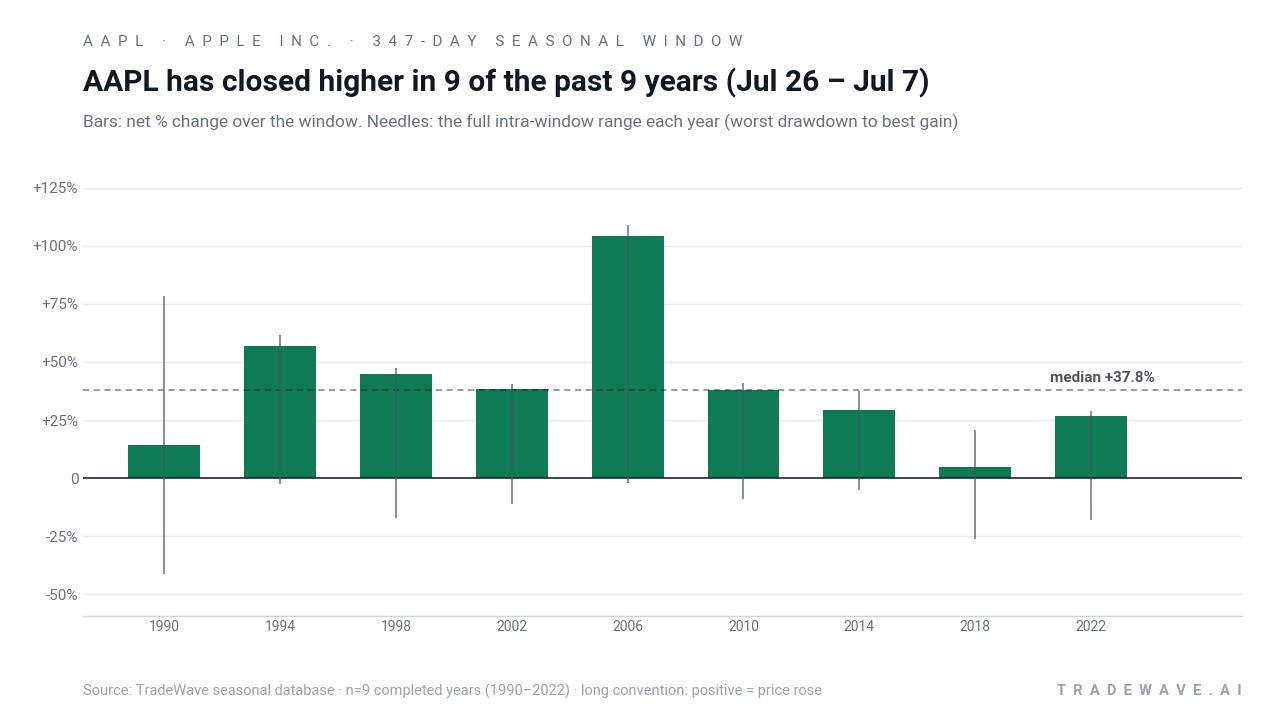
The per-year table shows how that plays out in practice. In 2006, Apple logged a standout net gain of 104.05%, with a maximum favorable move of 108.77% and only a shallow worst drawdown of 2.02% from the entry, a near-ideal long setup. By contrast, 1990 still finished up 14.26%, but the stock first endured a maximum adverse move of 41.2% before recovering, underscoring how volatile the ride can be even in a winning year. More recently, 2018 delivered only a 4.56% net gain despite a 20.64% peak run-up and a 26.37% worst drawdown, a reminder that large intraperiod swings do not always translate into big end-of-window profits.
The cumulative chart for this pattern climbs in a near-stair-step fashion, reflecting the absence of losing years and the compounding effect of stacking each 347-day window. Add it up: 1,627% cumulative gains across the 10 midterm-year windows in the sample, with no breaks in the series. History does not guarantee a repeat, but the record heading into this cycle is unusually clean for a stock of Apple’s size.
History does not guarantee future results; adverse excursions (MAE) can be large even in winning windows.
Why does Apple Inc. (AAPL) follow this seasonal pattern?
One likely driver is the way Apple’s product and earnings calendar lines up with the political cycle, with iPhone launches, holiday demand and fiscal-year reporting often clustering inside this midterm-to-pre-election stretch.[5] Analysts have also pointed to institutional portfolio repositioning ahead of the year before the presidential election, when risk appetite has historically improved and mega-cap tech often attracts fresh flows.[4] The pattern may also reflect the growing weight of Services revenue, which has provided a steadier earnings base that compounds through multiple quarters once a mid-cycle uptrend is in motion.[5]
What is driving Apple Inc. (AAPL) today?
Apple closed Tuesday at $340.08, up 0.9% on the session, after trading between $335.60 and $342.89 on volume of about 50.8 million shares. The stock now sits about 0.2% above its 52-week high of $339.57, with the 50-day moving average down at $306.99 and 20-day average volume near 50.5 million shares, a setup that reflects a strong uptrend already in place as the seasonal window gets going.
Fundamentally, the backdrop is still anchored in the company’s record fiscal 2025 and the guidance it issued for the March 2026 quarter. In Oct 2025, Apple reported fiscal Q4 2025 revenue of $102.5 billion and double-digit EPS growth, helped by strength in iPhone and Services, and it paired those numbers with a fresh round of hardware launches including the iPhone 17 lineup and new wearables.[5] On Jan 29, 2026, management projected 13% to 16% revenue growth for the March quarter, again citing robust iPhone demand and record results, which reinforced the idea that the growth engine was still running hot into this year.[2]
Strategically, the story has tilted toward artificial intelligence and monetization potential. In Feb 2026, Wedbush argued that a prior sell-off in Apple shares was unwarranted and framed 2026 as “the tech giant’s year of AI,” estimating that AI monetization could add $75 to $100 per share over several years as the platform rolls out and adoption builds.[4] That kind of long-duration AI narrative tends to support higher multiples for mega-cap tech, especially when paired with Apple’s growing Services base and strong free cash flow profile highlighted in late 2025 analysis.[6]
Looking back to mid-2025, Apple had already been surprising to the upside. In July 2025, the company’s fiscal Q3 revenue beat estimates by nearly $5 billion, driven by stronger-than-expected iPhone sales and EPS of $1.57 for the quarter ended Jun 28, 2025, which helped lift the stock in post-market trading at the time.[3] Around the same period, Wedbush reiterated an Outperform stance and a $270 price target, focusing on “good headline numbers” and the importance of the iPhone 17 cycle, though that target now looks dated relative to today’s price level.[1]
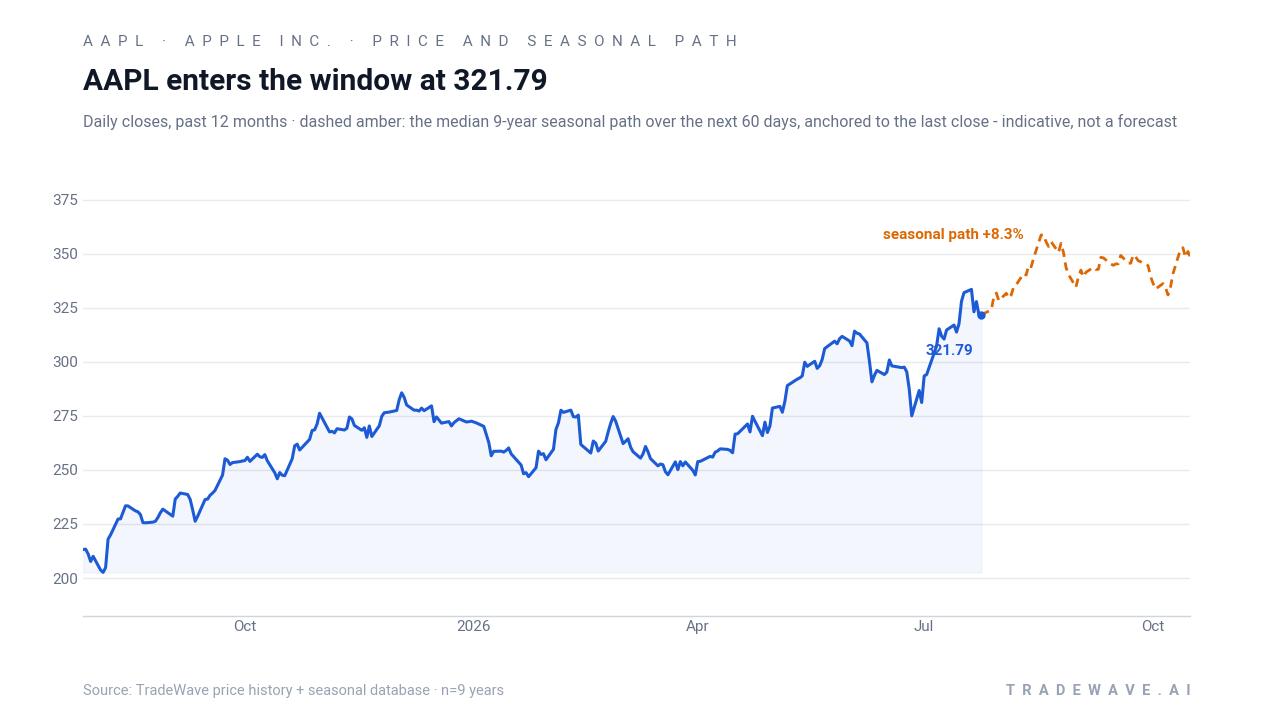
The chart below shows how Apple’s latest push to new highs fits against its past year of trading and the median 60-day seasonal path.
What should traders watch in this Apple Inc. (AAPL) seasonal window?
First, the key test is whether Apple can hold above its recent breakout zone around $335 to $340 as the midterm-year window progresses. Historically, strong years in this pattern have seen the stock build on early strength rather than quickly round-trip gains, while weaker outcomes like 2018 featured deep drawdowns that undercut prior highs before recovering by the end of the window.
Second, watch how the macro and policy calendar interacts with Apple’s own product and earnings cadence. The midterm election year often brings policy noise and bouts of volatility, but the transition into the year before the presidential election has historically coincided with a more supportive risk backdrop, which has lined up with Apple’s fall hardware launches and holiday demand in prior cycles.[5] If that rhythm repeats, traders will be watching the next iPhone cycle and Services commentary closely for confirmation that the growth story still matches the historical seasonal tailwind.
Third, monitor whether AI-related commentary and product features actually translate into the kind of monetization runway Wedbush outlined in Feb 2026.[4] Follow-through in AI messaging on upcoming earnings calls, along with any signs of new subscription or device-based AI revenue, would help validate the idea that this midterm-to-pre-election window is again riding a structural upgrade cycle rather than just sentiment.
Finally, keep an eye on volatility inside the window, not just the end result. Past years have shown that even when Apple ultimately finishes the Jul 26 – Jul 7 stretch higher, maximum adverse moves can be sharp, with drawdowns north of 20% in some cycles before the stock recovers. For a name that anchors major indices, how Apple behaves inside this historically strong seasonal window will say a lot about whether the broader market can lean on the same midterm-year playbook that has worked for decades.
Sources
- Seeking Alpha – Apple expected to report 'good headline numbers' says Wedbush, commentary on iPhone 17 to watch out for (Jul 30, 2025)
- Seeking Alpha – Apple projects 13%-16% revenue growth for March quarter as iPhone demand drives record results (Jan 29, 2026)
- Seeking Alpha – Apple Q3 revenue crushes estimates by nearly $5B, shares edge higher (Jul 31, 2025)
- Seeking Alpha – Apple sell-off 'unwarranted,' as Wedbush says 2026 is the tech giant's year of AI (Feb 17, 2026)
- Apple Newsroom – Apple reports fourth quarter results (Oct 30, 2025)
- Barchart – Apple's Free Cash Flow Surges, Implying AAPL Stock Could Be 20% Too Cheap (Nov 2, 2025)
About this seasonal analysis
Seasonal pattern data is sourced from TradeWave.ai, which analyzes historical price behavior across annual calendar windows going back up to 30 years. Read the full data methodology or the book The 100-Year Pattern by Afshin Moshrefi (2026 edition). Past performance of seasonal patterns does not guarantee future results. This article is for informational purposes only and does not constitute investment advice.