At Fresh Lows, Oracle Corporation (ORCL) Approaches an Aug 1 Midterm Window With a 100% Win Record
Oracle Corporation is trading just above a fresh 52-week low as it approaches an Aug 1 midterm-year seasonal window that has never been negative in the past three decades, setting up a stark clash between historical strength and AI-spending anxiety.
Price as of Jul 27, 2026: $119.90 (last close).

What is the seasonal pattern for Oracle Corporation (ORCL)?
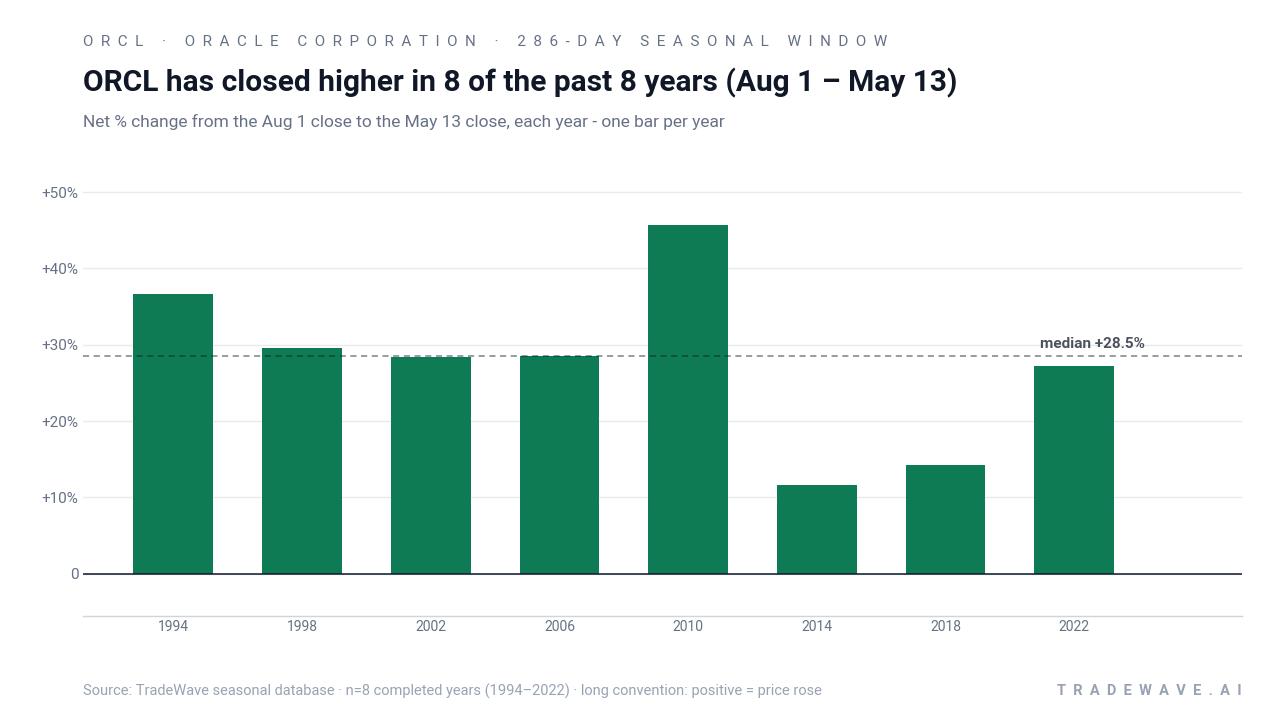
Oracle Corporation has risen in 8 of 8 midterm election years during the Aug 1 to May 13 window, with an average gain of 27.75% in winning years.
- 8 for 8 in this window, averaging 27.75% gains in winning years across the last 8 midterm election years.
- Percent Profitable is 100%, with 8 winners and 0 losers in the Aug 1 to May 13 Oracle Corporation trading window.
- Avg Profit of 27.75% reflects strong upside in this ORCL seasonal trend, with a 590% cumulative return when stacking the window across cycles.
- The TradeWave Ratio (TWR) of 1.14 indicates price has typically traveled meaningfully in the long direction within the window, beyond just the final close.
- A Sharpe ratio of 2.24 for this window points to unusually strong risk-adjusted returns compared with typical stock pattern analysis.
- Intraperiod swings have still been sizable, with individual years showing double-digit drawdowns even as every window finished positive.
According to historical data from TradeWave.ai, this midterm-year stretch has behaved very differently from an average calendar period for Oracle. The next section walks through how that election-cycle pattern lines up with today’s setup.
How has Oracle Corporation (ORCL) traded in this midterm-year seasonal window?
Oracle Corporation has risen in every single Aug 1 to May 13 window across the last eight midterm election years, averaging gains of 27.75% with no losing cycles. The stock heads toward this historically strong regime at about $119.90, roughly 64.5% below its 52-week high near $337.97 and only about 4.5% above its 52-week low around $114.75. That combination of deep drawdown and a clean 8-for-8 seasonal record makes this upcoming Oracle Corporation trading window one of the more striking historical seasonality setups on the large-cap tech calendar.
Grouping the data by the presidential election cycle matters here because this window spans late in the midterm election year into the following pre-election year, a phase when policy uncertainty often fades and risk appetite in large-cap tech has historically improved. For Oracle, the pattern phase covers the last eight midterm election years, so each data point reflects how the stock behaved in that specific political and macro backdrop rather than in a generic calendar year.
In this long 286-day stretch, the trade direction is explicitly long. Across the eight completed midterm-year samples, Percent Profitable is 100%, with 8 winners and 0 losers, and the average gain of 27.75% lines up closely with the 28% all-years average because there were no down windows. The median profit of 28.51% shows that the typical outcome has been a high-twenties percentage gain, not a pattern skewed by a single outlier year.
Individual years show a wide but consistently positive range. The strongest midterm-year window in this sample was 2010, when Oracle gained 45.63% between the Aug 1 entry and the May 13 exit, with a maximum favorable move of 51.06% and a worst drawdown of 10.83% from the starting point. The softest outcome was 2014, which still delivered an 11.59% net gain, with the stock up as much as 18.29% at one point and down as much as 9.29% inside the window.
The MFE/MAE profile across years shows that upside has usually come with real swings. In 1998, for example, Oracle finished the window up 29.58% but at one point was ahead by 131.93% and at another was down 31.69% from the entry. In 2022, the stock gained 27.25% over the full window, with a best intraperiod run-up of 28.16% and a worst drawdown of 21.51%, underscoring that even “winning” years for this long seasonal pattern have included sizable air pockets.
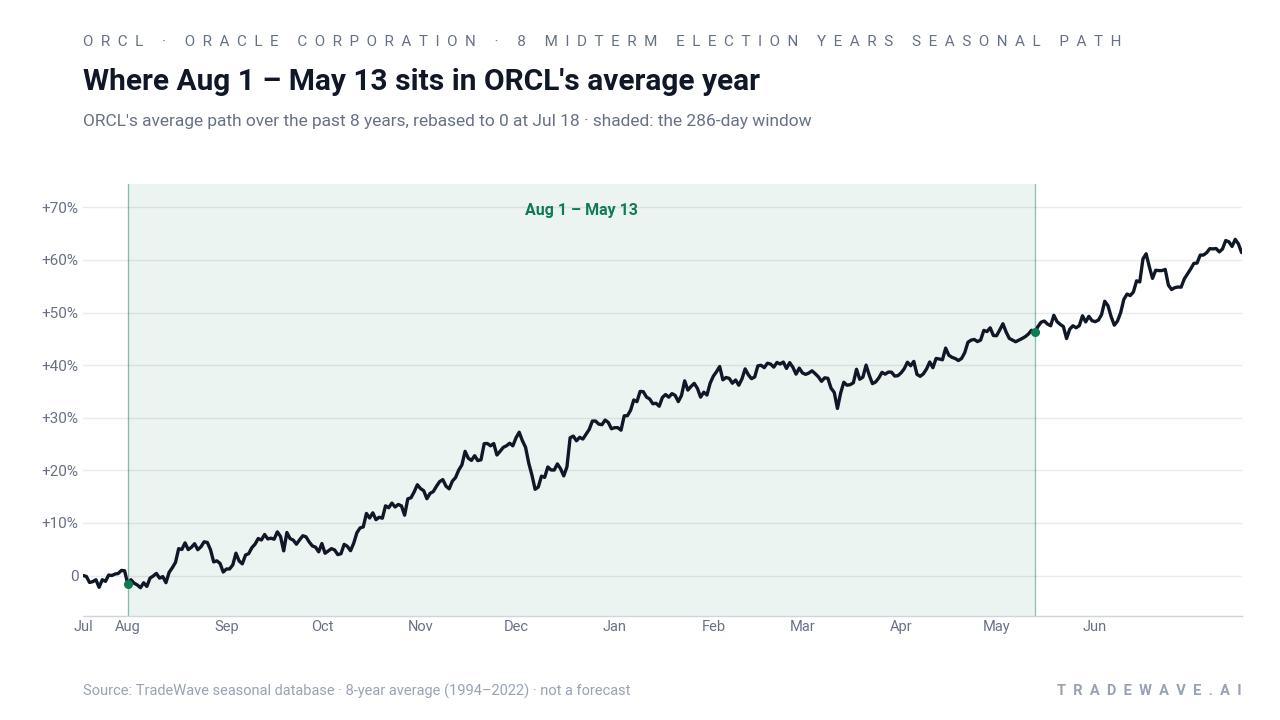
The historical seasonal average path suggests that gains in this Oracle Corporation seasonal trend have tended to accrue steadily rather than in a single burst. The shaded window in the trend chart captures a climb that often starts early in the period and continues into the pre-election year, consistent with the broader pattern of improving sentiment as policy visibility increases.
A second view stacks each year’s net result with its best and worst intraperiod swings.
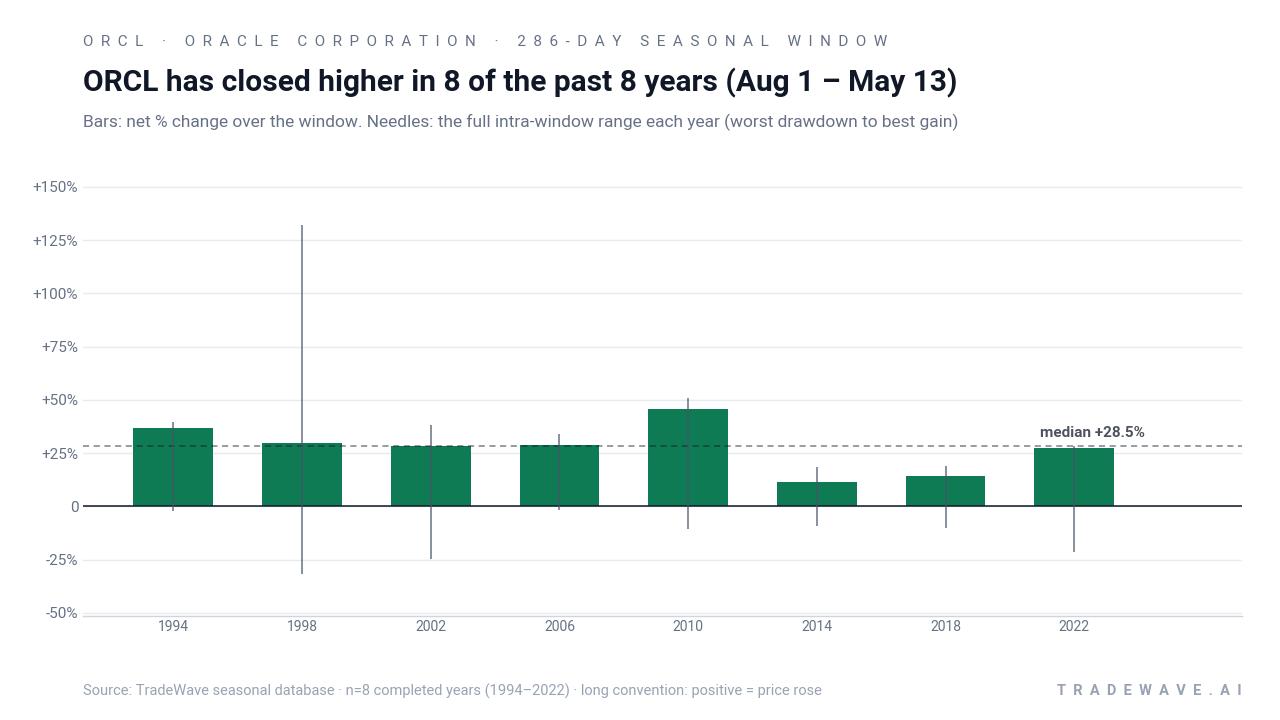
The stacked net / maximum favorable / maximum adverse view makes the trade-off clear: historically, this Oracle Corporation trading window has offered large upside potential, but several years saw 20% to 30% drawdowns before finishing higher. The pattern is strong, yet it has not been a smooth ride.
History does not guarantee future results; adverse excursions (MAE) can be large even in winning windows.
Why does Oracle Corporation (ORCL) follow this seasonal pattern?
One likely driver is the way Oracle’s fiscal year, cloud contract cycles, and large enterprise budgets line up with the U.S. presidential election calendar. Analysts have pointed to heavy AI and cloud infrastructure commitments, long-duration government and corporate deals, and portfolio rebalancing into large-cap tech as policy uncertainty fades in the midterm election year and the pre-election year begins.[3][6][7] This midterm-to-pre-election stretch may therefore capture a sweet spot where spending visibility improves and investors are more willing to pay for Oracle’s backlog and earnings power.
What is driving Oracle Corporation (ORCL) today?
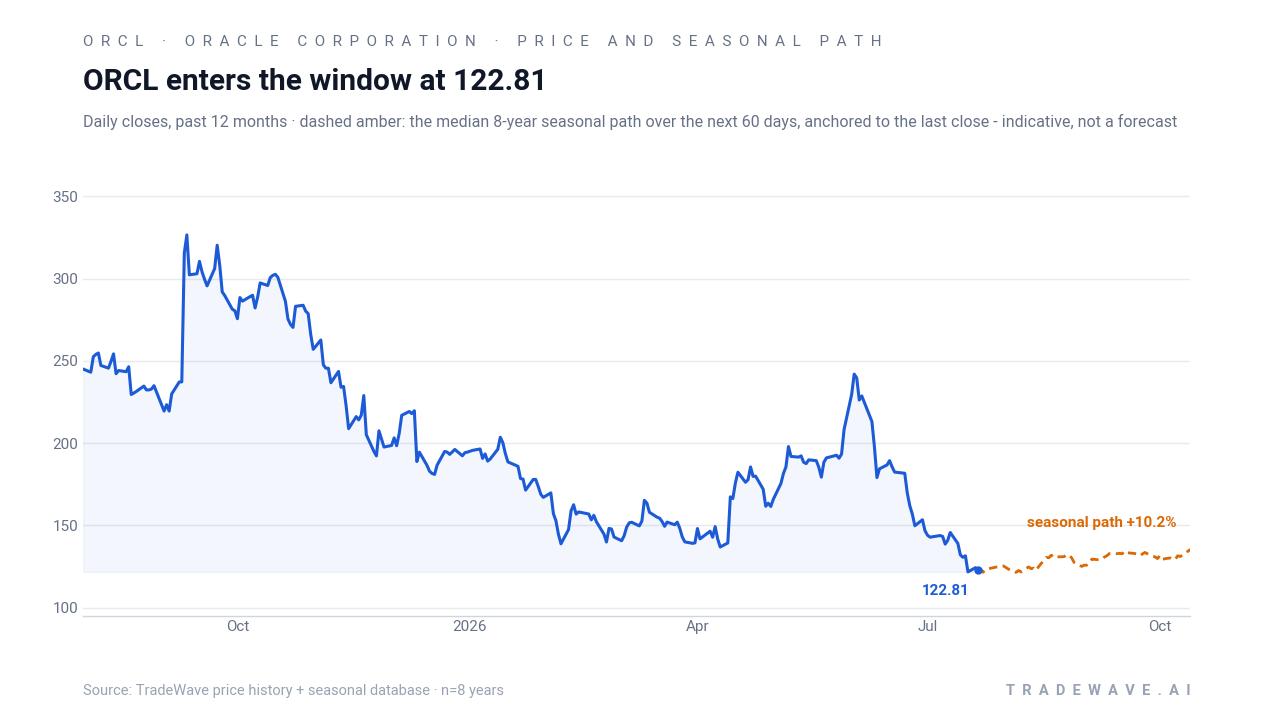
Oracle shares closed at about $119.90 on Jul 28, up 4.27% on the day but still sitting roughly 64.5% below their 52-week high and only a few dollars above a fresh 52-week low hit in late July.[2][5][7] The stock has been under pressure after what Barchart described as Oracle’s worst share-price crash in 25 years, driven by investor concern that massive AI data center spending could weigh on returns even as the company reports record remaining performance obligations tied to cloud and AI customers.[7][8]
Fundamentally, the story is not all gloom. Oracle recently reported a record $638 billion in remaining performance obligations for fiscal 2026, a backlog that The Motley Fool notes is heavily linked to AI workloads and marquee customers such as OpenAI.[5][7] Management has guided to about $8.05 in non-GAAP EPS and roughly $90 billion in revenue for the fiscal year, which some analysts argue leaves the stock looking inexpensive after the selloff, even as others warn that concentrated AI exposure and rising data center costs could still bite if demand slows.[1][3][5]
On the news front, Oracle also secured a 10-year U.S. Department of Defense software contract potentially worth up to $6.99 billion, a deal that consolidates software agreements across the military and other agencies.[4][6] Yet coverage from both Seeking Alpha and The Motley Fool notes that the market reaction was muted to negative, with shares sliding despite the Pentagon win as investors focused more on capital intensity and the risk that Oracle “makes the right call on AI demand and still loses” if returns on that spending disappoint.[3][4][6][8]
Analyst commentary has been similarly split in tone but skewed positive in rating. Several pieces highlight that Wall Street’s average price target, compiled from covering analysts and cited by The Motley Fool and Barchart, still implies well over a doubling from current levels, even after the recent crash.[2][5][9] A Seeking Alpha contributor upgraded Oracle to “cheap enough,” arguing that the combination of depressed price, large backlog, and AI positioning could be attractive for long-term investors willing to stomach volatility.[1]
The chart below situates the latest move in its recent multi-month context alongside the median 60-day seasonal path.
What should traders watch as this Oracle seasonal window approaches?
First, the calendar: the 286-day window begins on Aug 1 and runs deep into the pre-election year, so any stabilization or reversal from current lows inside that span would be consistent with the historical ORCL seasonal trend. If the stock instead continues to make new lows through the early part of the window, it would mark the first clear break in an 8-for-8 pattern.
Second, the policy and spending backdrop. This is the midterm election year, and the window bridges into the year before the presidential election, a phase when fiscal and regulatory signals around AI, cloud security, and defense IT spending will matter for Oracle’s backlog and margins.[3][6][7] Watch for updates on AI infrastructure demand, data center cost discipline, and any shifts in government or enterprise cloud budgets that could either validate or undercut the long-term contracts sitting in that $638 billion RPO figure.[5][7][8]
Third, price levels and volatility. The 52-week low near $114.75 and the recent crash zone described in Barchart coverage are the obvious downside markers, while any sustained move back through the mid-$130s to $150s would start to chip away at the post-crash overhang.[5][7][9] Inside the window, behavior that mirrors prior cycles would likely feature sharp rallies punctuated by double-digit drawdowns, so traders may want to track how intraday ranges and volume evolve around earnings and major AI or contract headlines.
Finally, analyst and narrative shifts. Several recent articles emphasize that Wall Street still sees large upside from here, but that optimism is colliding with skepticism about AI spending efficiency and data center costs.[1][2][3][8][9] If future notes and earnings calls start to focus more on realized returns from AI infrastructure and less on raw capex, that could be the kind of narrative turn that has historically lined up with stronger performance in this Oracle Corporation seasonal window.
Sources
- Seeking Alpha – "Oracle: Cheap Enough (Rating Upgrade)" (Jul 22, 2026)
- The Motley Fool – "Oracle Just Hit a New 52-Week Low. Wall Street's Average Target Is Still More Than Double the Stock." (Jul 24, 2026)
- Seeking Alpha – "How Oracle Can Make The Right Call On AI Demand And Still Lose" (Jul 23, 2026)
- The Motley Fool – "Oracle Won a $7 Billion Pentagon Contract on Thursday. Yet Shares Have Been Slammed." (Jul 26, 2026)
- The Motley Fool – "Oracle Stock Just Plunged to a 52-Week Low, but Should ..." (Jul 27, 2026)
- Seeking Alpha (SA News) – "Oracle lands 10-year, $7B deal to provide software to US military" (Jul 23, 2026)
- Barchart – "Oracle’s Worst Stock Crash in 25 Years: Only Time Will Tell If It Can Recover from Its AI Spending Gamble" (Jul 22, 2026)
- Barchart – "Data Center Costs Are Racking Up. What That Means for Oracle Stock Here." (Jul 22, 2026)
- Barchart – "Oracle Stock Is Deep in the Red, But Wall Street Sees 220% Upside" (Jul 21, 2026)
About this seasonal analysis
Seasonal pattern data is sourced from TradeWave.ai, which analyzes historical price behavior across annual calendar windows going back up to 30 years. Read the full data methodology or the book The 100-Year Pattern by Afshin Moshrefi (2026 edition). Past performance of seasonal patterns does not guarantee future results. This article is for informational purposes only and does not constitute investment advice.