Ahead of Aug. 26 Results, Nvidia (NVDA) Climbs Into a Historically Strong 19-Day Stretch
Nvidia is trading just below its 52-week high as it heads into a historically strong 19-day August window that has often rewarded longs ahead of earnings.
Price as of Aug 4, 2026: $211.94 (last close).

What is the seasonal pattern for Nvidia (NVDA)?
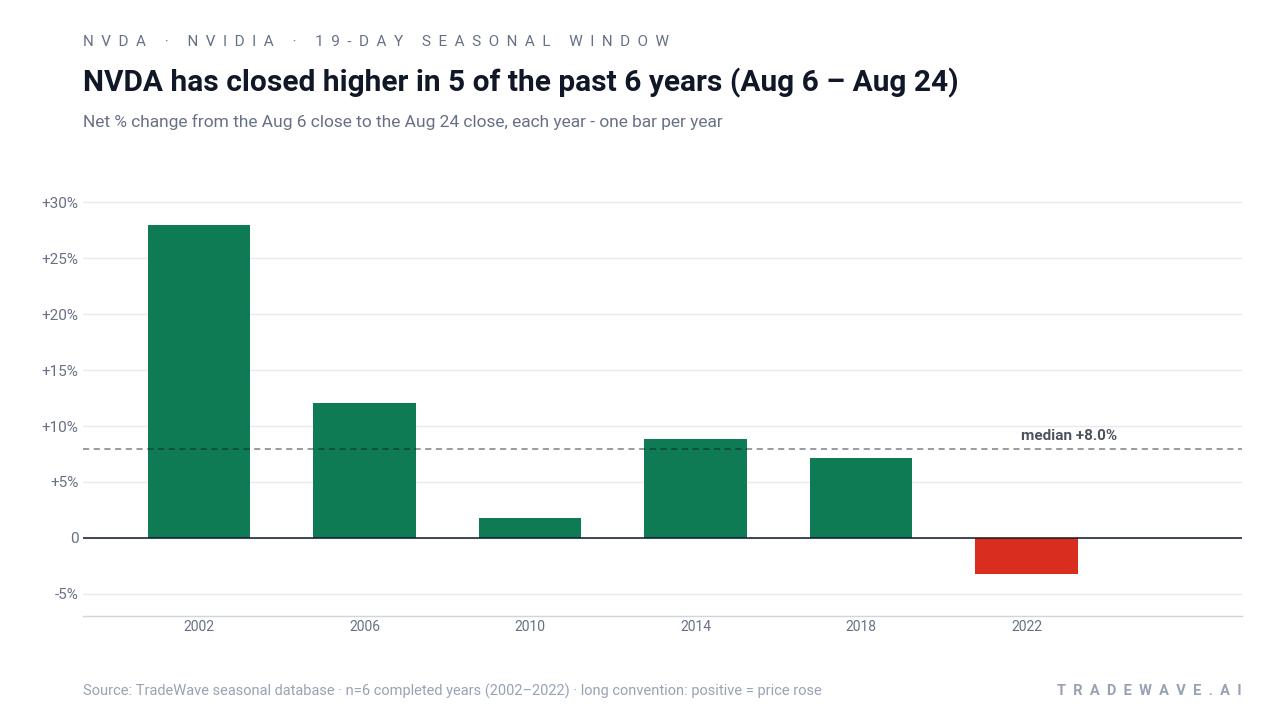
Nvidia has risen in 5 of 6 midterm-year August windows starting Aug 6, with an average gain of 11.54% in winning years.
- 5 wins, 1 loss in this 19-day Aug 6–Aug 24 window across the last 6 midterm election years, with winners averaging 11.54% gains.
- Percent Profitable is 83%, with 5 winning years and 1 losing year, and an all-years average return of 9% for the long setup.
- The strongest year in the sample, 2002, delivered a 27.93% net gain, while the lone losing year, 2022, saw a 3.21% decline.
- Intraperiod swings have been meaningful, with best point-to-peak moves (maximum favorable excursions) reaching as high as 48.53% and worst drawdowns (maximum adverse excursions) down to about 9.43%.
- The pattern aligns with a long trade direction and a TradeWave Ratio of 1.01, indicating that price has typically traveled materially in the trade direction within the window.
- Stacking this specific Nvidia trading window across the six midterm election years compounds to a 64% cumulative gain, underscoring how punchy this slice of the calendar has been.
According to historical data from TradeWave.ai, this midterm-year August stretch has behaved differently from an average month for Nvidia, with a distinct bias that shows up when you isolate the election cycle.
How has Nvidia (NVDA) traded in this midterm-year August window?
Nvidia has risen in 5 of the last 6 midterm election years during the 19-day window that runs from Aug 6 to Aug 24, with winning years averaging 11.54% gains and a 9% average across all years for a long position. Shares finished Wednesday at 211.94, up 2.56% on the day and about 10.2% below their 52-week high of roughly 235.99, leaving the stock elevated but not stretched at the top of its range.
Grouping by the presidential election cycle matters here because Nvidia’s biggest customers are hyperscale cloud and AI players whose spending often tracks fiscal and policy rhythms in Washington. Midterm election years tend to feature heavy debate over budgets, regulation and industrial policy, which can influence when large capex commitments for AI infrastructure are signed and recognized.
Across the six midterm election years in this sample, Nvidia’s Aug 6–Aug 24 window has been skewed toward the upside for long positions. The median profit is 7.98%, which is lower than the 11.54% average for winners, a sign that a couple of very strong years, such as 2002’s 27.93% gain, have pulled the mean higher. The lone losing year, 2022, saw a 3.21% decline, which is modest compared with the best up years but still meaningful for a 19-day stretch.
Intraperiod volatility has been real. Maximum favorable excursions, which capture the best point-to-peak move within the window, have ranged from 7.34% in 2010 to 48.53% in 2002. Maximum adverse excursions, the worst drawdowns from entry, have run as deep as 9.43% in 2010 and around 6% in several other years. That mix tells you this Nvidia trading window has often offered sizable upside for longs but has not been a straight line.
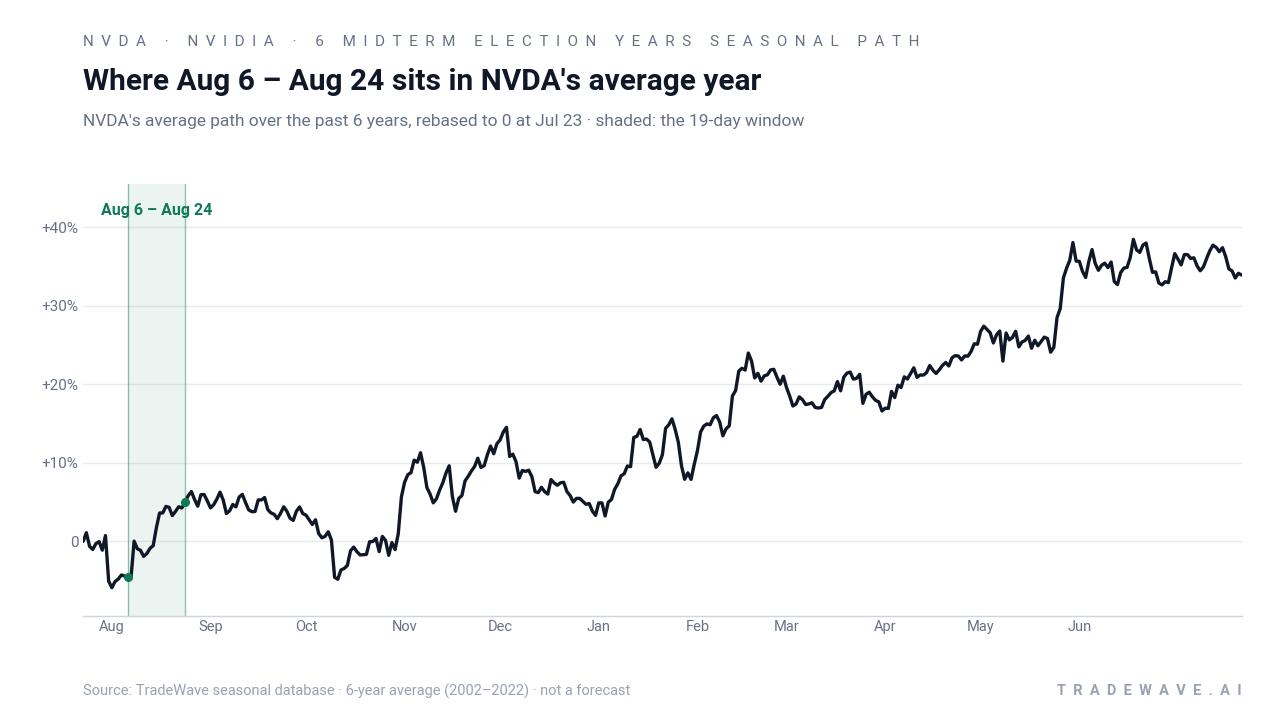
The historical seasonal average path shows Nvidia often firming into this mid-August window after a late-July base, then adding gains through the back half of the month. The pattern is not a smooth ramp, but the average line tilts higher across the 19 days, consistent with the 83% win rate for long exposure.
Year-by-year ranges show how far Nvidia has tended to swing in both directions inside this window.
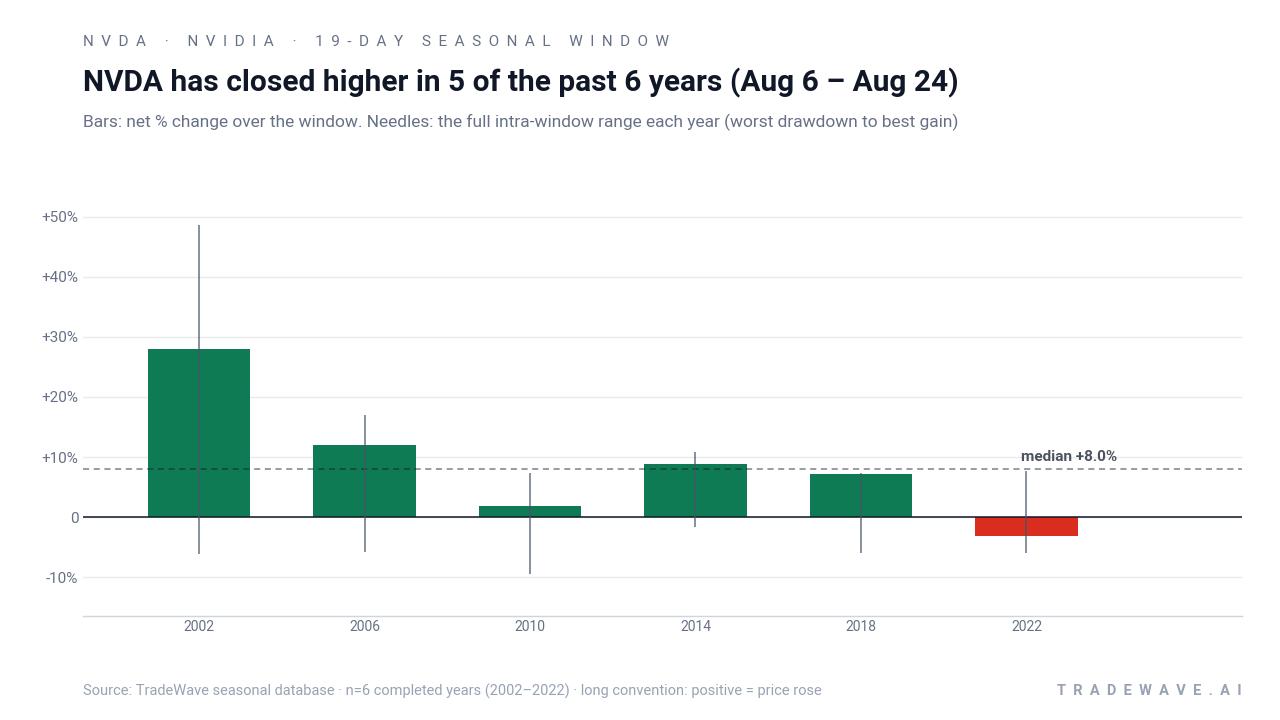
The combined net / maximum favorable / maximum adverse view shows a clear pattern: even in the winning years, Nvidia has often dipped several percent before moving higher, and the best years have seen intraperiod rallies far larger than the final close-to-close gain. Add it up and you get a 64% cumulative return across the six midterm-year windows, but with enough downside noise that position sizing and risk controls would have mattered.
History does not guarantee future results; adverse excursions (MAE) can be large even in winning windows.
Why does Nvidia (NVDA) follow this seasonal pattern?
One likely driver is the clustering of Nvidia’s fiscal Q2 earnings and guidance updates in late August, which can pull forward positioning into the first three weeks of the month. Analysts have also pointed to hyperscaler AI capex plans and data-center demand updates that often surface around this time, prompting institutional portfolio shifts in semiconductor and AI infrastructure names.[1] In midterm election years, those flows intersect with policy debates over tech regulation and federal spending, which may amplify how traders lean into this specific Nvidia seasonal window.
What is driving Nvidia (NVDA) today?
Nvidia closed Wednesday at 211.94, up 2.56% on the session, leaving the stock about 10.2% below its 52-week high of roughly 235.99 and well above its 52-week low near 163.63. The move comes as investors focus on the company’s Aug 26 fiscal Q2 2027 earnings report, where Wall Street is looking for roughly $91.8 billion in revenue and about $2.08 in EPS, implying around 96% year-over-year revenue growth for the quarter.[1] Management has guided Q2 revenue to about $91 billion plus or minus 2% with gross margins near 75%, and the street is already looking ahead to Q3, where consensus calls for roughly 81% revenue growth as AI infrastructure spending remains intense.[1]
Macro and sector context remain supportive. Major cloud and internet platforms are still ramping capital spending to build out AI data centers, a trend that has kept demand for Nvidia’s accelerators and networking products exceptionally strong.[1] Data-center sales now account for roughly 92% of Nvidia’s revenue, concentrating the story around a single, powerful growth engine tied to AI infrastructure capex cycles.[4] That concentration cuts both ways: it magnifies upside when hyperscalers are spending aggressively, but it also means any hint of capex moderation or competitive pressure can hit the stock hard around earnings.
The chart below situates the latest move in its recent multi-month context alongside a historical seasonal projection.
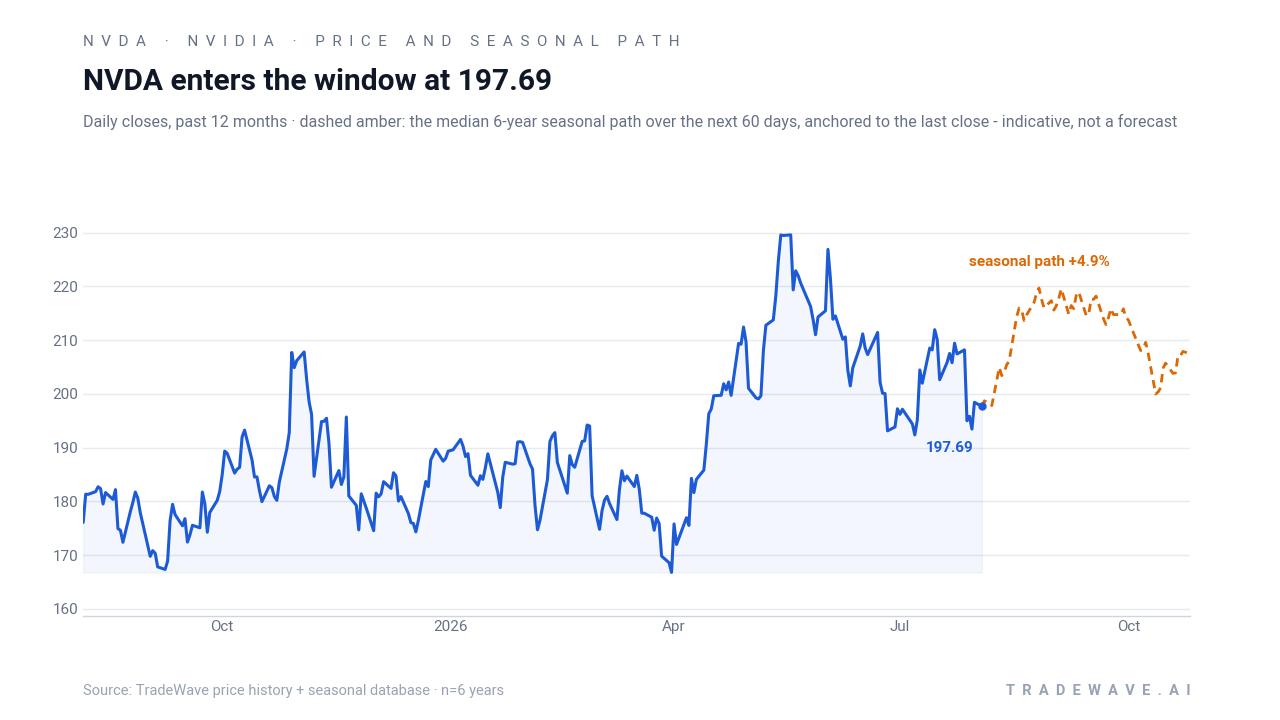
Looking ahead to this year’s Aug 6–Aug 24 window, the setup is straightforward: Nvidia is a systemically important AI bellwether trading near the upper end of its range, heading into a historically favorable seasonal stretch that culminates just days before a high-stakes earnings report. For traders, the key will be whether price action inside the window rhymes with the past six midterm election years, where early dips often gave way to strong rallies, or whether any wobble in AI capex expectations breaks that pattern.
What should traders watch in this Nvidia (NVDA) window?
First, watch how Nvidia behaves around the Aug 6 open that marks the start of the 19-day window. A familiar pattern would be a brief shakeout followed by a grind higher into the low 220s or beyond, consistent with prior years where maximum favorable moves outpaced final closes. A sharp break that pushes the stock closer to its 52-week low would contradict the historical NVDA seasonal trend and signal that earnings nerves or macro worries are overwhelming the usual midterm-year August strength.
Second, keep an eye on hyperscaler commentary and any early reads on AI infrastructure budgets. Articles this week have emphasized that Alphabet, Meta, Amazon, Microsoft and Oracle are still leaning into AI capex, which has underpinned Nvidia’s data-center dominance.[1] Any sign that those plans are slipping could show up first in Nvidia’s tape during this window, even before the company speaks on Aug 26.
Third, monitor how volatility behaves inside the band defined by historical maximum favorable and adverse excursions. If intraday swings start to resemble the more extreme years in the sample, with 7% to 10% drawdowns and double-digit rallies inside the same 19-day stretch, that would be a sign the market is repricing AI expectations in real time rather than simply coasting into earnings.
Finally, the cleanest confirmation that the historical pattern is holding would be a positive close-to-close result for the window, ideally with Nvidia finishing the period closer to its 52-week high than its low. A flat or modestly negative outcome would not break the long-term NVDA seasonal pattern, but a deep loss through the window would mark only the second losing midterm-year August stretch in the last six cycles and could hint at a different playbook for AI leaders as this midterm election year moves toward its final quarter.
Sources
- The Motley Fool, "Should You Buy Nvidia Stock Before Aug. 26? Here's What History Suggests.", Aug 4, 2026
- The Motley Fool, "Prediction: Nvidia Stock Will Skyrocket on Aug. 26", Aug 2, 2026
- The Motley Fool, "Data Center Sales Make Up 92% of Nvidia's Revenue.", Aug 3, 2026
- The Motley Fool, "What Nvidia Could Be Worth on a $1,000 Investment if History Repeats Itself", Aug 2, 2026
About this seasonal analysis
Seasonal pattern data is sourced from TradeWave.ai, which analyzes historical price behavior across annual calendar windows going back up to 30 years. Read the full data methodology or the book The 100-Year Pattern by Afshin Moshrefi (2026 edition). Past performance of seasonal patterns does not guarantee future results. This article is for informational purposes only and does not constitute investment advice.