Ahead of Q2 Print, Merck & Co. (MRK) Nears 139-Day Midterm Window With 100% Gains
Merck & Co. is approaching a historically powerful late-August-to-January trading window just as shares ease ahead of Q2 earnings and options activity picks up.
Price as of Aug 3, 2026: $127.77 (last close).

What is the seasonal pattern for Merck & Co. (MRK)?
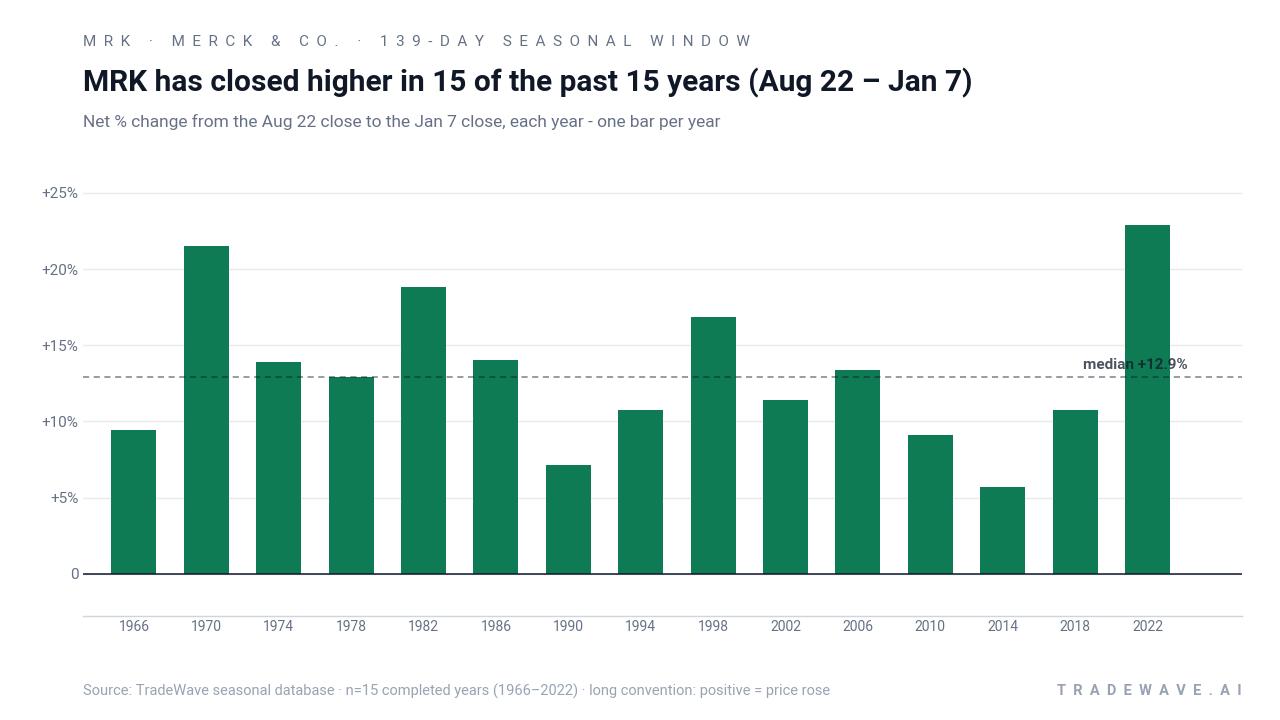
Merck & Co. has risen in 15 of 15 midterm-year Aug 22–Jan 7 windows, with an average gain of 13.24% in winning years.
- 15 for 15 in this window, averaging 13.24% gains in winning years across the last 15 midterm election cycles.
- Seasonal window runs from Aug 22 through Jan 7, spanning 139 calendar days in the heart of the midterm election year.
- Percent Profitable is 100%, with 15 winners and 0 losers over the historical sample.
- Median profit of 12.93% and annualized return of 13.14% point to a consistently bullish MRK seasonal trend.
- TradeWave Ratio of 2.64 and Sharpe ratio of 2.35 indicate strong upside travel in the trade direction relative to volatility.
- Individual years have still seen meaningful drawdowns inside the window, so timing and risk management remain critical.
According to historical data from TradeWave.ai, this midterm-year stretch has behaved very differently from an average few months on the calendar for Merck. The next section looks at how that pattern has played out and where the upcoming window fits into today’s setup.
How has Merck & Co. (MRK) traded in the midterm-year Aug 22–Jan 7 window?
Merck & Co. has posted gains in every single Aug 22–Jan 7 window across the last 15 midterm election years, averaging a 13.24% rise for long positions. Shares finished the prior session at 127.77, down 1.9% on the day and below the recent 52-week high of 135.05, leaving the stock about 5.4% under that peak. The upcoming 139-day window begins on Aug 22 and runs through Jan 7, overlapping the late-year phase when healthcare and large-cap defensives often see renewed institutional demand.
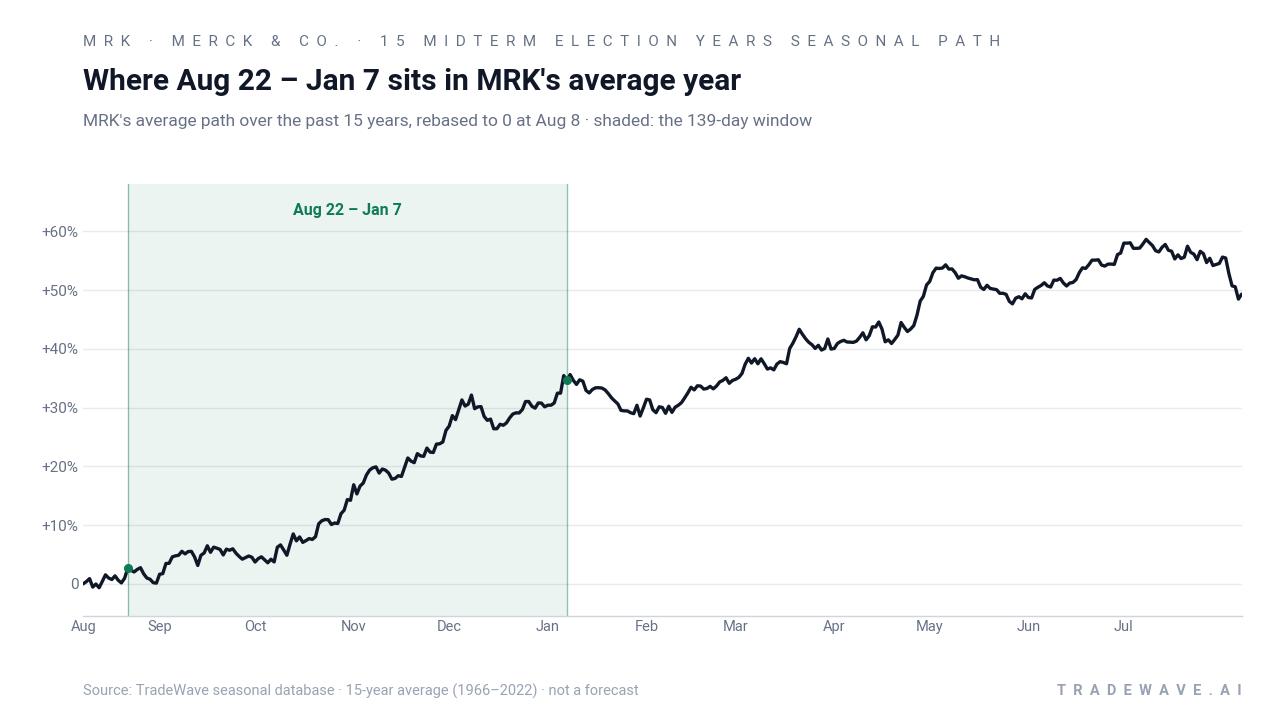
Grouping the data by the presidential election cycle matters here because midterm years often bring policy uncertainty early on, followed by a more supportive backdrop as the calendar shifts toward the pre-election year. This MRK seasonal window sits squarely in that late-midterm to early pre-election transition, when risk appetite has historically improved and large pharmaceutical names have benefited from clearer regulatory and fiscal visibility.[1]
The trade direction for this pattern is explicitly long, and the track record is unusually clean. Percent Profitable stands at 100%, with 15 winners and 0 losers, and the median profit of 12.93% shows that the gains are not just driven by a single outlier year. Average profit of 13.24% across all years lines up closely with that median, which suggests a tight cluster of double-digit advances rather than a boom-or-bust profile.
Looking at individual years, the strongest outcome in the sample came in 2022, when MRK gained 22.87% between the Aug 22 entry and the Jan 7 exit, after reaching a maximum favorable move of 28.56% at the intra-window peak. At the other end of the spectrum, 2014 still finished higher by 5.68%, but that year saw a deeper mid-window wobble, with a worst drawdown of 10.64% from the entry before the stock recovered into the close.
Year-by-year ranges show how far MRK has typically run in both directions inside this window.
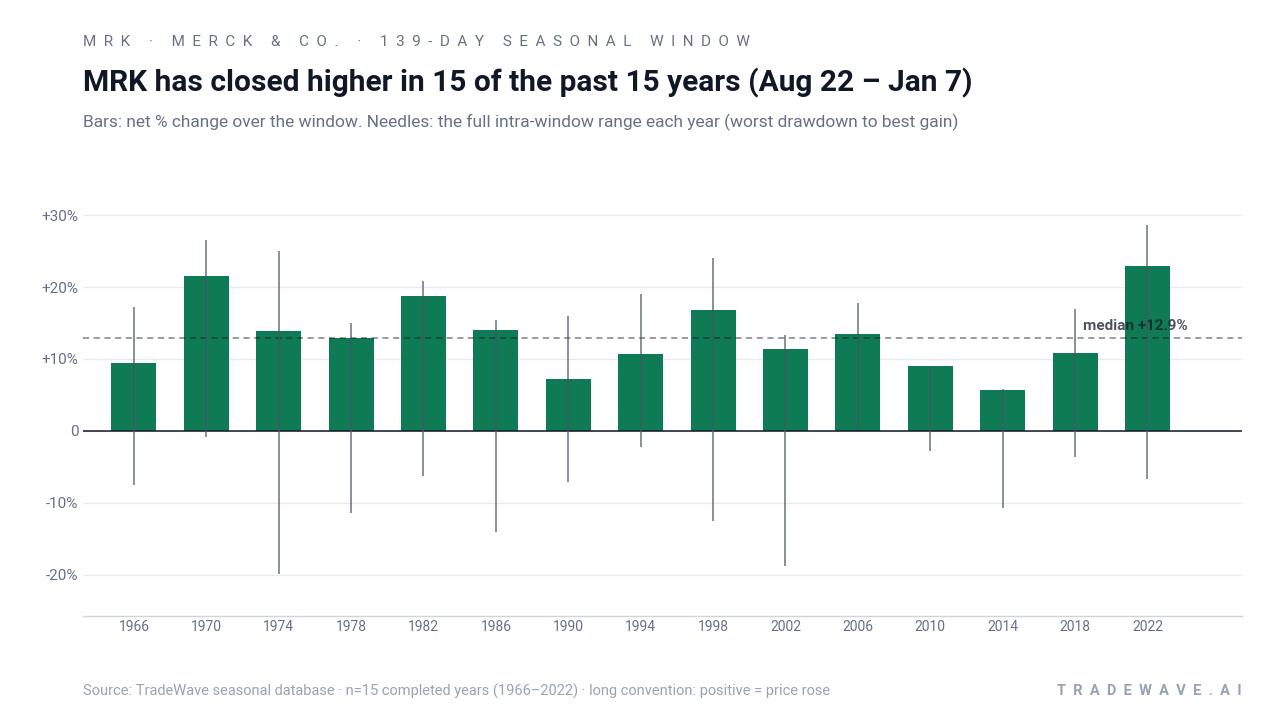
The combined net / maximum favorable / maximum adverse profile shows a window that has historically rewarded patience but not complacency. Maximum favorable moves have often stretched into the mid-teens or higher, while maximum adverse moves have at times pushed into high single digits or, in 2002, nearly 19% before the stock recovered. The TradeWave Ratio of 2.64 captures how far MRK has typically traveled in the trade direction within the window, while the Sharpe ratio of 2.35 points to strong risk-adjusted returns based on end-of-window outcomes.
History does not guarantee future results; adverse excursions can be large even in winning windows, and past seasonal strength does not ensure similar performance in 2026.
Why does Merck & Co. (MRK) follow this seasonal pattern?
One likely driver is the clustering of Merck’s late-year earnings, guidance updates and R&D news around the fall conference season, which can reset expectations into the new year.[1] Institutional portfolio rebalancing ahead of year-end, often favoring large-cap healthcare as a defensive anchor, may also support this recurring MRK trading window.[2] The midterm-to-pre-election transition can further reduce policy uncertainty for drugmakers, encouraging incremental risk-taking in pharmaceutical stocks during this stretch.[3]
What is driving Merck & Co. (MRK) today?
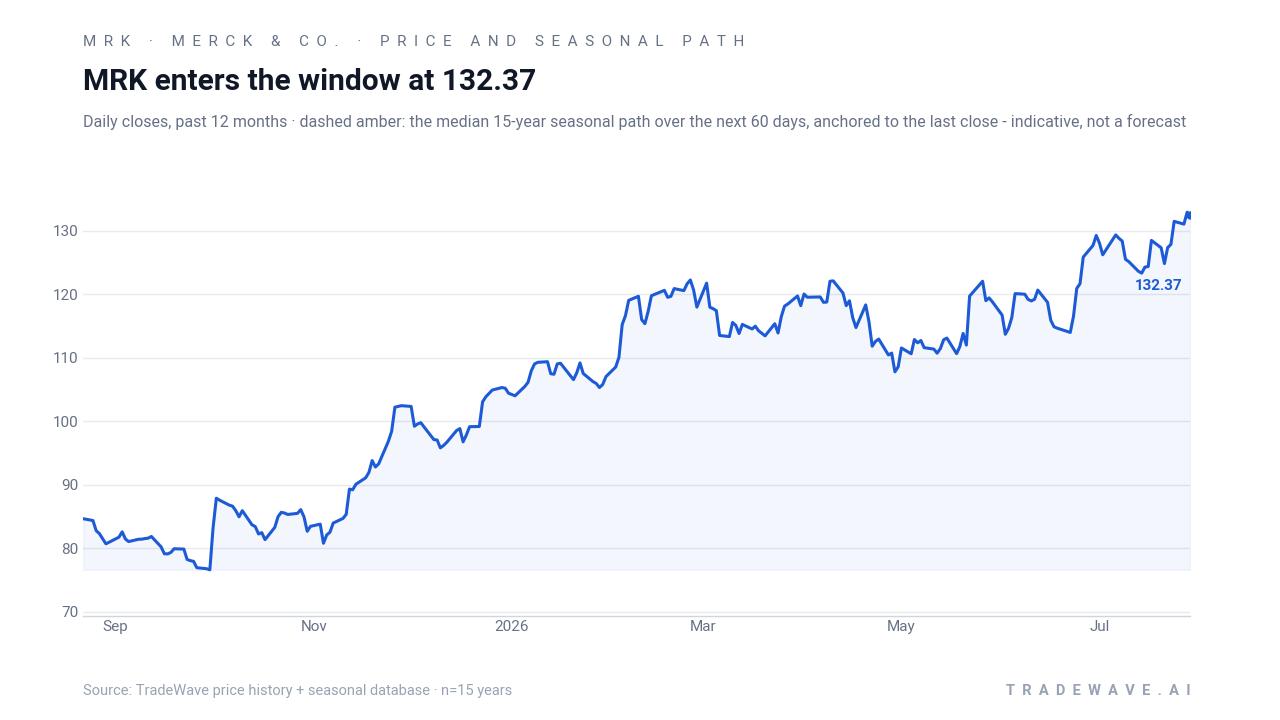
Merck & Co. closed the prior session at 127.77, down 1.9% on the day, with the stock sitting about 5.4% below its 52-week high of 135.05 and well above the 52-week low near 72.59. The pullback comes as investors position around Merck’s Q2 2026 earnings report, which is scheduled before the market open on Aug 4 and is expected to show continued revenue growth after the company delivered $16.29 billion in sales and an earnings beat in the prior quarter.[2][3] Options traders have also been active: a MarketBeat note from Jul 22 flagged unusually high options volume in MRK, a sign that some investors are using derivatives to express views on near-term volatility rather than just buying or selling the stock outright.[9]
Street commentary ahead of the print focuses on how Merck’s key franchises and pipeline can sustain growth into 2027, with consensus price targets around $135.19 reflecting a modest premium to the latest close.[1][2] Sector-wise, pharmaceutical peers have delivered steady Q2 results, and the group has been modestly positive in the month leading into Merck’s report, reinforcing the idea that stock-specific catalysts rather than broad macro stress are in the driver’s seat.[2] Merck’s 20-day average volume of about 8.66 million shares and a 50-day moving average near 122.61 also suggest the stock is trading with healthy liquidity and remains above its intermediate trend line, even after the latest dip.
The chart below situates the latest move in its recent multi-month context alongside the median 60-day seasonal path.
What should traders watch as this MRK seasonal window approaches?
First, the earnings reaction will set the tone for how MRK enters the Aug 22–Jan 7 window: a move that keeps the stock above its 50-day moving average near 122.61 would leave the long-term seasonal pattern intact, while a break below that level would signal a tougher starting point.[2][10] Second, watch whether the unusually high options activity seen in late July persists or fades after the Q2 report; sustained heavy call or put volume would suggest that derivatives traders are leaning into the historical seasonality rather than fading it.[9] Third, price behavior inside the window will be key: if MRK again builds a double-digit gain with only mid-single-digit drawdowns, it would reinforce the 15-for-15 record, while a flat or negative outcome would mark the first real break in this midterm-year pattern. Finally, policy and healthcare headlines into year-end, from drug pricing debates to regulatory decisions, will help determine whether the broader pharmaceutical sector seasonal outlook continues to support Merck’s long-biased trading window.[1][2]
Sources
- Yahoo Finance: Exploring Analyst Estimates for Merck (MRK) Q2 Earnings (Jul 31, 2026).
- StockStory via Yahoo Finance: What To Expect From Merck’s (MRK) Q2 Earnings (Aug 3, 2026).
- Yahoo Finance / Zacks: Should You Buy, Sell or Hold Merck Stock Ahead of Q2 Earnings? (Jul 31, 2026).
- MarketBeat: Merck & Co., Inc. Sees Unusually High Options Volume (NYSE:MRK) (Jul 22, 2026).
- Barchart: MRK - Merck & Company Stock Price (Aug 1, 2026).
- MarketBeat: Merck & Co., Inc. (MRK) Stock Price, News & Analysis (Aug 2, 2026).
About this seasonal analysis
Seasonal pattern data is sourced from TradeWave.ai, which analyzes historical price behavior across annual calendar windows going back up to 30 years. Read the full data methodology or the book The 100-Year Pattern by Afshin Moshrefi (2026 edition). Past performance of seasonal patterns does not guarantee future results. This article is for informational purposes only and does not constitute investment advice.