Analog Devices (ADI) Has Risen in 10 of 10 Aug-May Midterm Windows, Averaging 40.85% Gains
Analog Devices is stepping into a historically powerful 268-day seasonal window as shares trade below their 52-week high and investors balance AI optimism with shifting insider and institutional positioning.
Price as of Aug 11, 2026: $385.30 (last close).

What is the seasonal pattern for Analog Devices (ADI)?
Analog Devices has risen in 10 of 10 midterm-year windows starting Aug 12 and lasting 268 days, with an average gain of 40.85% in winning years.
- 10 for 10 in this window, with Analog Devices averaging 40.85% gains across all winning years.
- Seasonal window runs from Aug 12 through May 6, spanning 268 days in the last 10 midterm election years.
- Percent Profitable is 100%, with 10 winners and 0 losers in the historical sample.
- Annualized return of 39.64% and a Sharpe ratio of 2.02 point to unusually strong risk‑adjusted performance.
- TradeWave Ratio of 1.98 signals that price has typically traveled meaningfully in the long direction within the window.
- Intraperiod swings have still been sharp at times, with some years showing double‑digit drawdowns before finishing higher.
According to historical data from TradeWave.ai, this midterm-year stretch for Analog Devices has behaved very differently from an average year, and the next iteration of that pattern begins today.
How strong is the Aug 12 – May 6 seasonal window for Analog Devices (ADI)?
Analog Devices has finished higher in every single Aug 12 to May 6 window across the last 10 midterm election years, averaging a 40.85% gain for long positions. Shares opened this latest window at 389.98 and last traded at 385.30, leaving the stock about 13.6% below its 52-week high of 445.91 as it moves into this historically favorable stretch. Recent trading has also featured elevated volume around earnings and a pullback from record levels, giving this cycle’s start a more volatile feel than some prior years.[1]
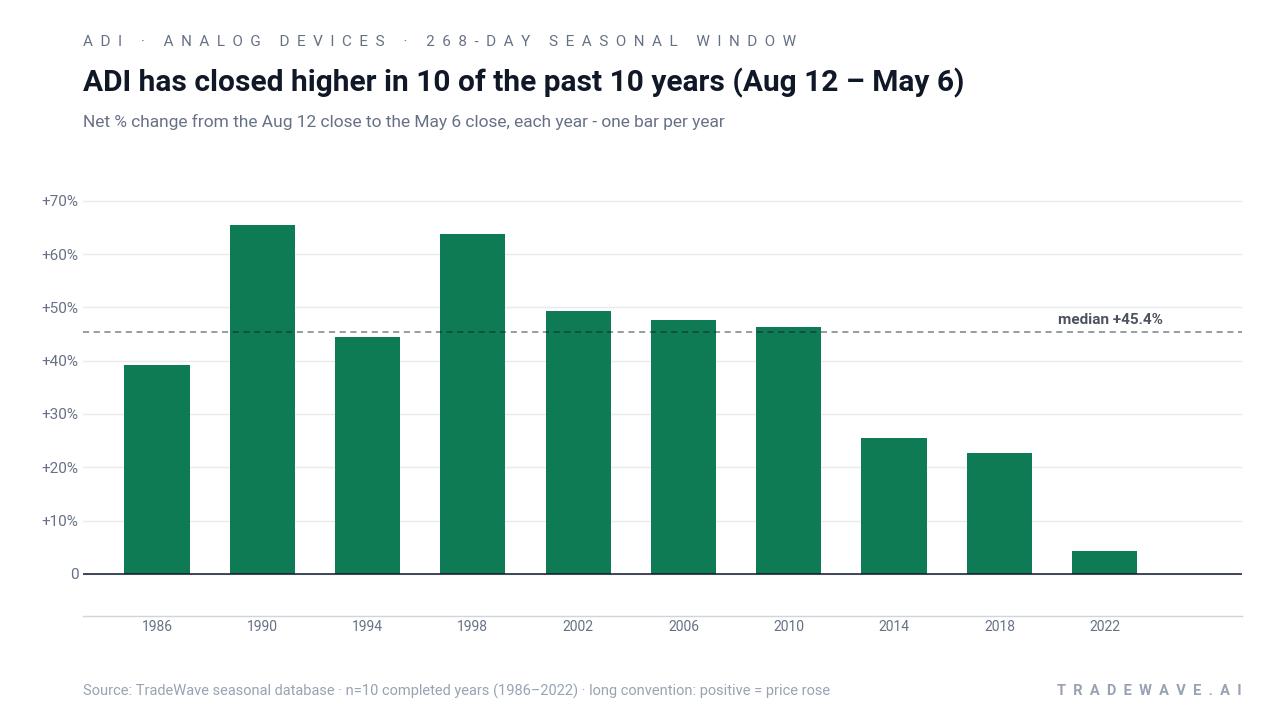
Grouping the data by the presidential election cycle matters here because this window always runs from the back half of a midterm election year into the following pre-election year, a phase when policy visibility tends to improve and risk appetite in cyclicals like semiconductors often rebuilds. In this pattern phase, the market is in a midterm election year on the calendar today, and the window carries through into the year before the presidential election, when equities have historically leaned more risk-on.
Across the last 10 midterm election years in the sample, the trade direction for this Analog Devices seasonal pattern is explicitly long. Percent Profitable is 100%, with 10 winners and 0 losers, and the average profit of 40.85% reflects the mean gain across all those winning windows. The median profit of 45.4% shows that half of the cycles delivered at least mid‑40s returns, while the 39.64% annualized return and 2.02 Sharpe ratio point to a strong risk‑adjusted profile for this specific Analog Devices trading window.
The per-year table shows how wide the range of outcomes has been even inside that perfect win record. The strongest year in the sample was 1990, when the stock gained 65.39% between the Aug 12 entry and the May 6 exit, with a maximum favorable move of 92.31% at the best point in the window. The softest outcome was 2022, which still finished up 4.37% but saw a maximum adverse move of -25.18% at one point, underscoring that even “winning” years for this ADI seasonal trend have included deep drawdowns.
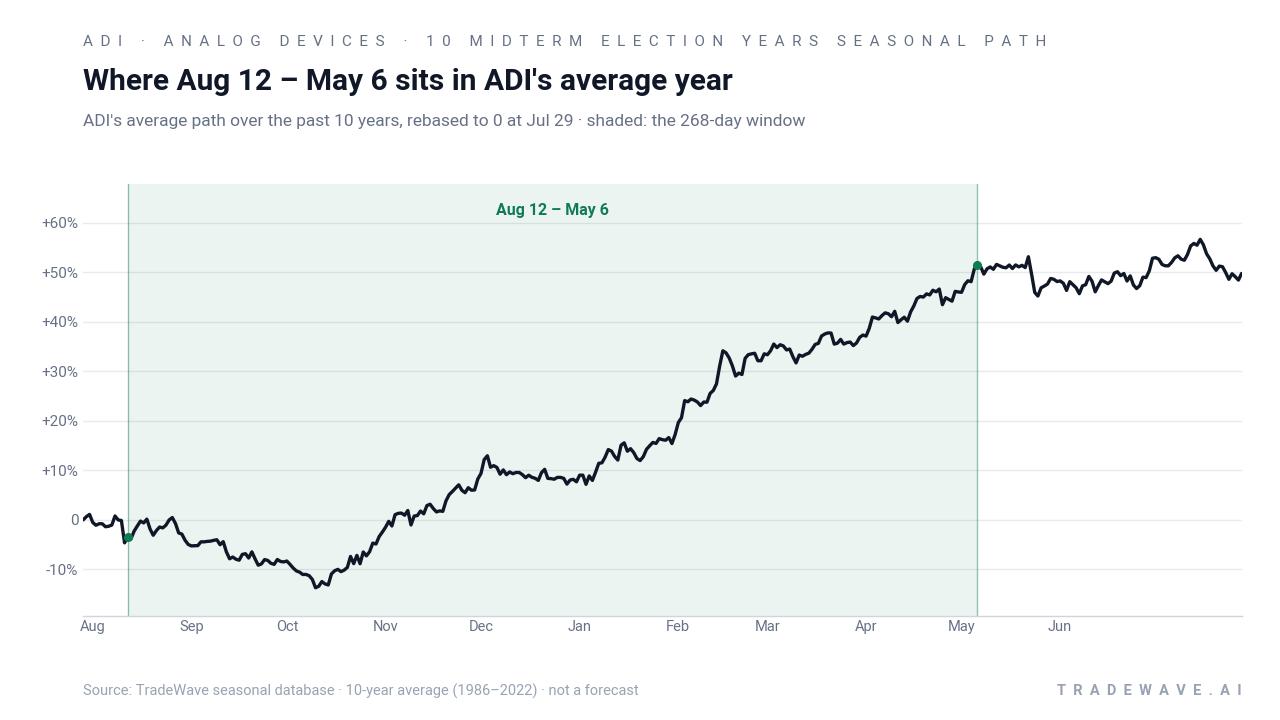
The historical seasonal average chart shows Analog Devices typically grinding higher through much of this 268-day stretch, with gains tending to build from the early months of the window and then consolidating into the spring. The path is not a forecast, but it illustrates how prior cycles have clustered most of their upside inside this specific slice of the calendar rather than in the months immediately before or after.
The next view combines yearly net results with the full intraperiod range between worst drawdown and best run-up.
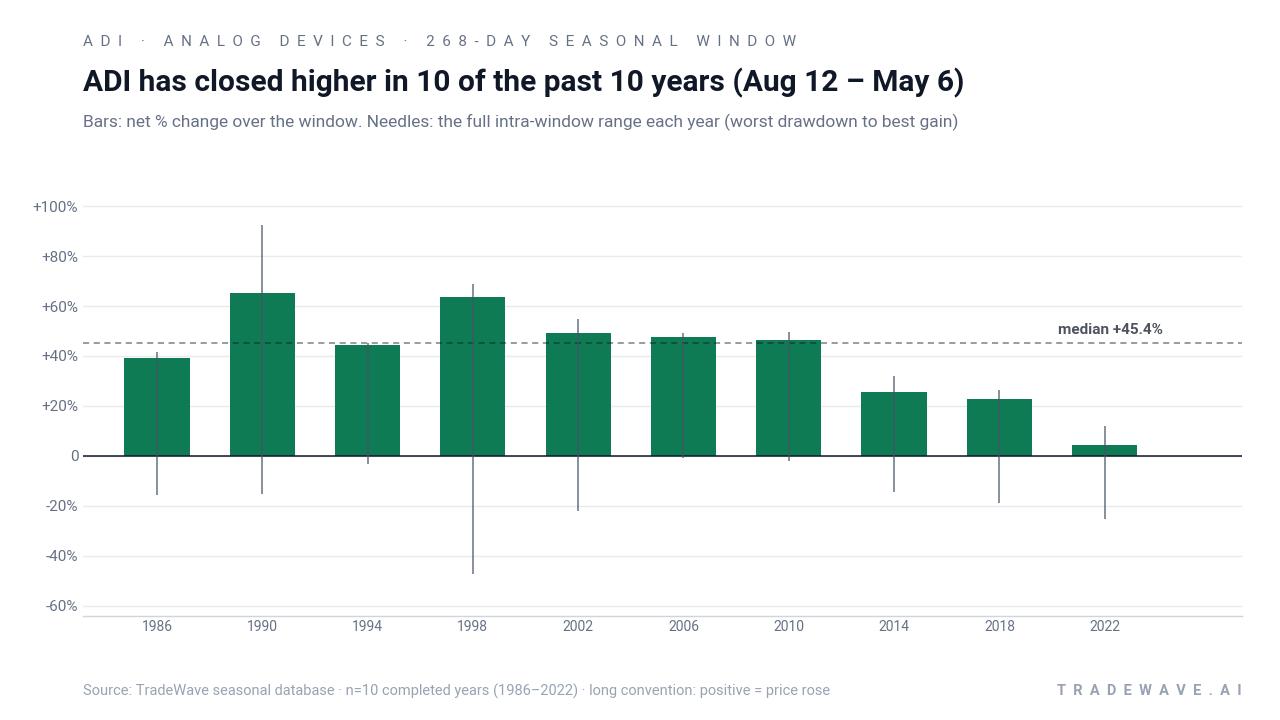
The combined net/MFE/MAE chart makes the volatility profile clear. In strong years like 1990 and 1998, maximum favorable excursions ran into the 60% to 90% zone while maximum adverse moves still reached roughly -15% to -47% at the worst point in the window. Even in the modest 4.37% up year of 2022, the stock first sank more than 25% below the entry before recovering into a positive close, a reminder that this historically bullish Analog Devices seasonal pattern has often rewarded patience but not without sizable swings along the way.
History does not guarantee future results; adverse excursions can be large even in winning windows, and traders should treat this Analog Devices seasonal pattern as context rather than a signal on its own.
Why does Analog Devices (ADI) follow this seasonal pattern?
One likely driver is the way Analog Devices’ earnings calendar and capital spending cycles line up with the broader presidential election cycle, with midterm-year back halves often coinciding with clearer policy signals and stronger demand visibility in industrial, automotive and data center markets.[1][11] Analysts have also pointed to institutional portfolio repositioning into high-quality semiconductor names ahead of the typically stronger pre-election year, which can funnel flows into stocks like ADI during this window.[1][11] The pattern may also reflect how AI and data-center buildouts tend to be funded and communicated on a multi-quarter basis, concentrating positive guidance and follow-through into this part of the calendar.[1][11]
What is driving Analog Devices (ADI) today?
Analog Devices last traded at 385.30, up 0.36% on the day, after opening the session at 389.98 and trading between 384.71 and 394.16 on volume of about 2.33 million shares. That leaves the stock well off its 52-week high of 445.91 but far above its 52-week low near 217.54, with the 50-day moving average around 393.69 and 20-day average volume closer to 3.80 million shares, suggesting a modest pullback within a still-elevated range. The move comes after a powerful run that accelerated when Analog Devices reported record fiscal second-quarter results on May 20, with revenue of $3.62 billion, non-GAAP EPS of $3.09 and raised guidance that reinforced the AI and data-center demand story.[4]
In May 2026, management projected third-quarter revenue of $3.9 billion plus or minus $100 million and adjusted EPS of $3.30 plus or minus $0.15, while Wall Street penciled in roughly $3.33 for the quarter and nearly 60% year-on-year EPS growth for the full fiscal year.[4] That backdrop has helped keep Analog Devices in the conversation as one of the key analog and mixed-signal semiconductor suppliers leveraged to the AI and data center supercycle, alongside peers that are also seeing margin expansion and strong free cash flow.[11]
Fresh analyst commentary from early August framed the recent pullback as a pause after a strong run, with a MarketBeat aggregation showing a “Moderate Buy” consensus rating and a consensus price target around 441, based on multiple firms’ views.[1] While that target sits above the current share price, it reflects estimates compiled over prior months rather than a single up-to-the-minute call, and investors are weighing it against the stock’s sharp rally since early 2026.[2][3]
Ownership flows have been active as well. On Jul 29, a filing-based report highlighted that insiders had been selling shares under a Rule 10b5-1 plan, with company insiders collectively selling 103,858 shares worth about $42 million over the prior 90 days and insiders owning roughly 0.36% of the float.[6] At the same time, institutional investors have been adding and trimming positions: on Aug 7, Assenagon Asset Management disclosed the purchase of 107,277 Analog Devices shares, while on Aug 4, Confluence Investment Management reported selling 247,250 shares, underscoring how large holders are actively repositioning around the name.[7][8]
Back in May, the stock’s surge after earnings was accompanied by a spike in trading volume as investors reacted to the beat-and-raise quarter, a sign that liquidity can tighten or expand quickly around key catalysts for this name.[4] Earlier in 2026, short interest was reported below 2% and declining, suggesting that bearish positioning had been relatively light heading into this latest leg of the AI and data-center cycle.[3] Add it up and Analog Devices enters this historically strong seasonal window with a supportive fundamental story, active institutional flows and a valuation that has already priced in a good portion of the growth narrative.
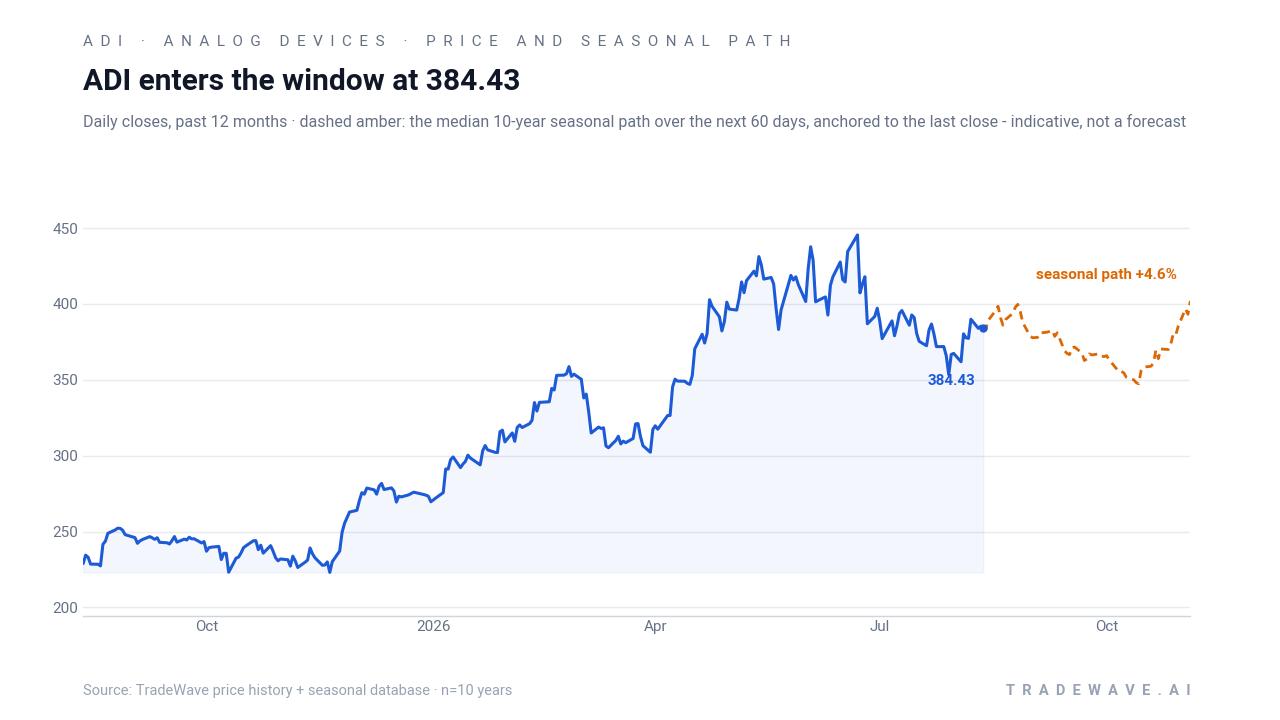
The chart below situates the latest pullback and today’s move within the past year of trading and the next 60 days of historical seasonal behavior.
What should traders watch in this Analog Devices (ADI) seasonal window?
For this Aug 12 to May 6 stretch, the first watchpoint is how Analog Devices behaves around upcoming earnings and guidance updates relative to the historical pattern of strength. In prior midterm election years, the stock has often absorbed early drawdowns inside the window before finishing higher, so traders will be watching whether any near-term weakness stays within the kind of intraperiod ranges seen in years like 2018 and 2022 or breaks that template.
Second, price levels matter. The 50-day moving average near 393.69 and the 52-week high at 445.91 are natural reference points for whether this cycle’s path is tracking closer to the stronger historical years or the more muted ones. Sustained trading above the 50-day average with rising volume would be more consistent with the historical Analog Devices seasonal trend, while repeated failures at that band could signal a departure from the prior pattern.
Third, flows and positioning will be key. Continued insider selling at the pace reported in late July would raise questions about how management views the risk-reward after the recent run, while additional institutional buying like the Assenagon purchase could reinforce the idea that large investors are leaning into the AI and data-center story during this window.[6][7][8] Traders will also be watching whether short interest remains low or begins to rebuild as the stock moves through the heart of the seasonal regime.[3]
Finally, the macro and policy calendar around the midterm election year and the transition into the year before the presidential election will shape how much of the historical pattern can repeat. If AI and data-center spending stays robust and Washington avoids major policy shocks, the backdrop will look more like the stronger historical cycles for this Analog Devices trading window.[1][11] A combination of weaker demand or tighter financial conditions, by contrast, would be the clearest way this 10-for-10 record could face its toughest test yet.
Sources
- Barchart, “Dear Analog Devices Stock Fans, Mark Your Calendars for August 19” (Aug 8, 2026)
- MarketBeat, “ADI Stock Pulls Back Before Its Next Leg Higher” (May 20, 2026)
- MarketBeat, “ADI Stock Forecast: Can It Reach $400 in 2026?” (Feb 18, 2026)
- Chartmill, “Analog Devices Inc (NASDAQ:ADI) Surges After Crushing Q2 Estimates, Lifts Outlook” (May 20, 2026)
- MarketBeat, “Analog Devices, Inc. $ADI Shares Sold by The Manufacturers Life Insurance Company” (Jul 29, 2026)
- MarketBeat, “Assenagon Asset Management S.A. Acquires 107,277 Shares of Analog Devices, Inc. $ADI” (Aug 7, 2026)
- MarketBeat, “Confluence Investment Management LLC Sells 247,250 Shares of Analog Devices, Inc. $ADI” (Aug 4, 2026)
- MarketBeat, “Top Semiconductor Stocks for 2026: AMD, AVGO, MU, MRVL, and ADI” (Dec 3, 2025)
About this seasonal analysis
Seasonal pattern data is sourced from TradeWave.ai, which analyzes historical price behavior across annual calendar windows going back up to 30 years. Read the full data methodology or the book The 100-Year Pattern by Afshin Moshrefi (2026 edition). Past performance of seasonal patterns does not guarantee future results. This article is for informational purposes only and does not constitute investment advice.