Workday, Inc. (WDAY) Faces AI Budget Squeeze Just as a Weak Sep-Oct Window Approaches
Workday, Inc. is trading well below its 52-week high as it heads toward a Sep 1–Oct 15 stretch that has usually meant pressure for the stock, putting a notable seasonal pattern on traders’ radar just as sentiment turns more cautious.
Price as of Aug 11, 2026: $181.27 (last close).

What is the seasonal pattern for Workday, Inc. (WDAY)?
Workday, Inc. has fallen in 8 of 10 years during the Sep 1–Oct 15 window, with an average 7.04% gain in winning years for the short setup.
- 8 for 10 in this window, with the short side averaging 7.04% profit in winning years.
- Seasonal window runs from Sep 1 through Oct 15, covering 45 calendar days of trading in Workday, Inc.
- Percent Profitable is 80%, with 8 winning years and 2 losing years for the short pattern.
- Avg Profit - All, which includes both winners and losers, comes in at 5% across the 10-year sample.
- TradeWave Ratio (TWR) of 1.75 signals that price has typically traveled meaningfully in the trade direction within this window.
- Sharpe ratio of 0.65 points to a historically favorable risk-adjusted profile for this specific WDAY seasonal trend.
According to historical data from TradeWave.ai, this upcoming early-fall stretch in Workday, Inc. has behaved very differently from an average month on the calendar. The next section looks at how that pattern has played out over the past decade and what it means for the 2026 setup.
How has Workday, Inc. (WDAY) traded in the Sep 1–Oct 15 window?
Workday, Inc. has closed lower in 8 of the past 10 Sep 1–Oct 15 windows, with the short side averaging a 7.04% profit in winning years. Today the stock finished at $181.27, leaving it about 27.4% below its 52-week high of $249.85 and roughly 64.2% above its 52-week low of $110.36. That backdrop means the stock is heading into a historically weak slice of the calendar from a mid-range level rather than from extremes, which has often been the starting point in prior years.
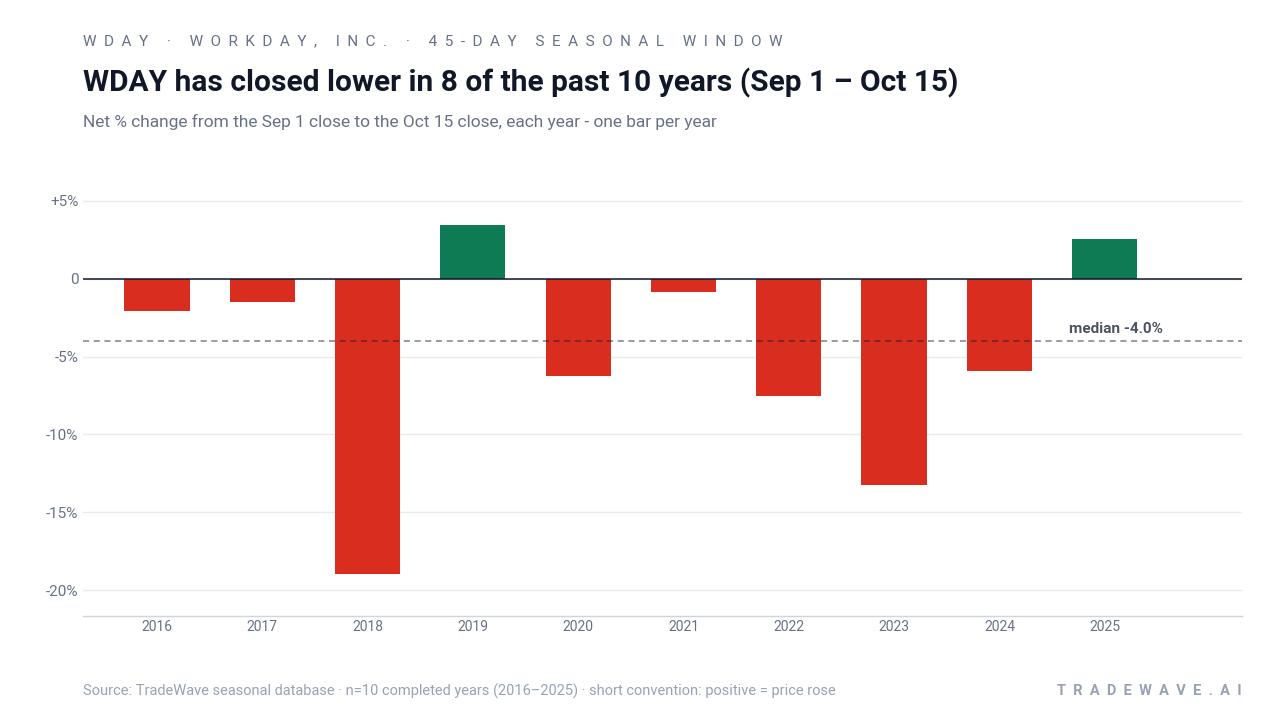
Trade direction for this pattern is explicitly short, so years where WDAY fell over the window were favorable outcomes and rallies were losing years for the setup. Across the 10-year sample, Percent Profitable sits at 80%, with 8 winners and 2 losers, and the all-years average outcome is a 5% gain for the short side. That gap between the 7.04% Avg Profit in winning years and the 5% Avg Profit - All shows that the two losing years did not fully erase the gains from the stronger down moves.
The per-year table shows how that has played out in practice. The strongest year for the short pattern was 2018, when WDAY dropped 18.95% between the Sep 1 entry at $156.69 and the Oct 15 exit at $127.00, with the worst intraperiod drawdown from entry reaching 22.28% and the best point-to-peak move only 0.78% in the wrong direction. On the other side, 2019 stands out as a losing year for shorts, with the stock rising 3.42% over the window from $174.98 to $180.96 and experiencing a 6.08% maximum move against the short before a 6.7% favorable dip that did not hold into the close.
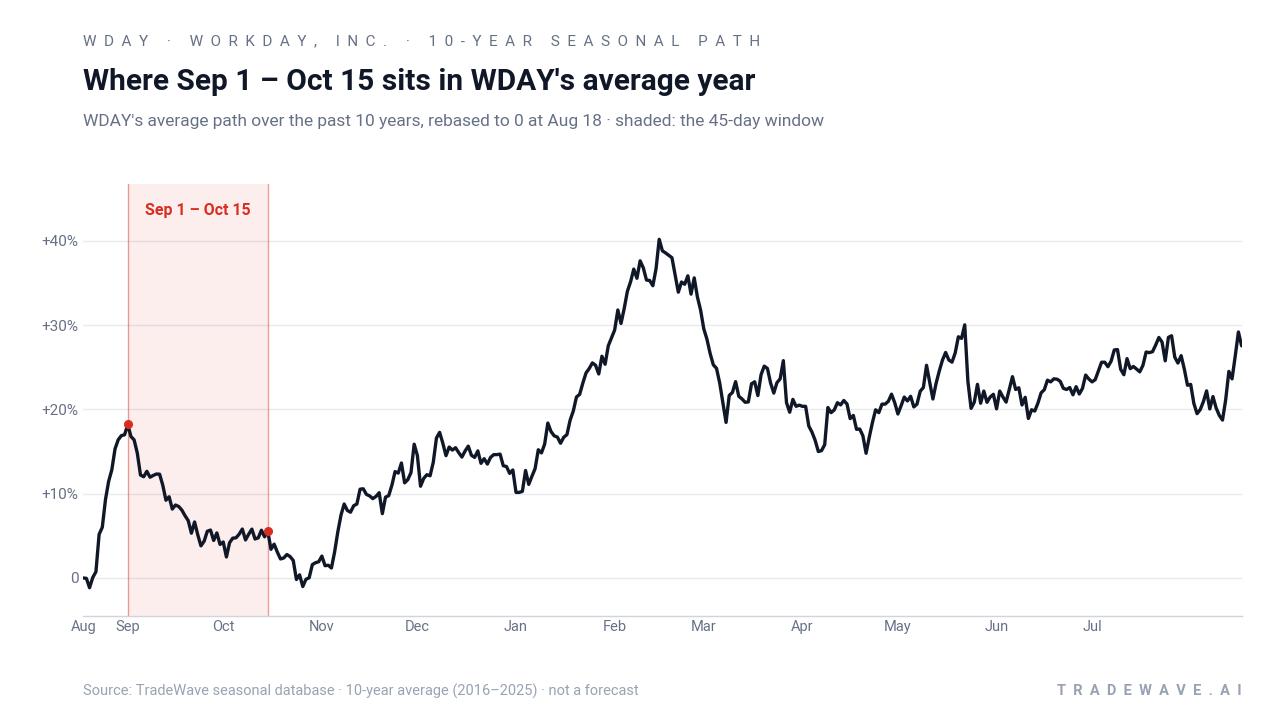
A second view combines net results with the full intraperiod range, highlighting both downside and upside swings inside the window.
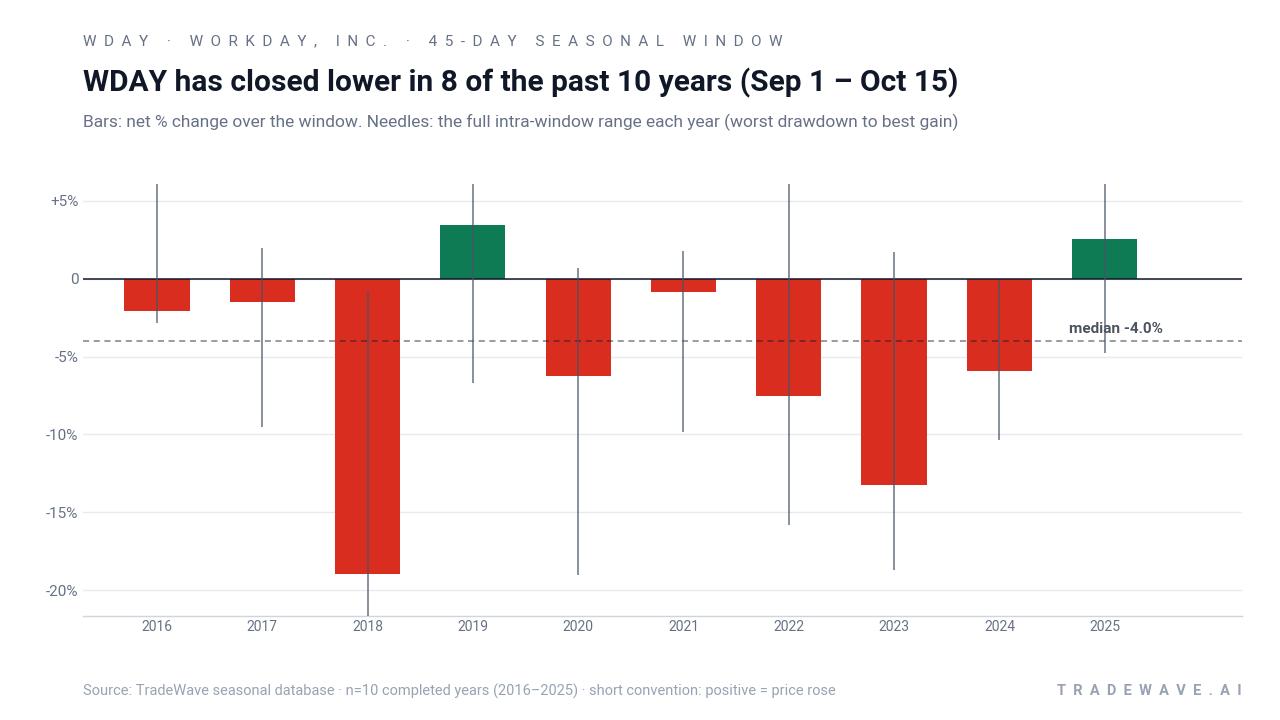
The combined net / maximum favorable excursion / maximum adverse excursion view makes the volatility profile clear. In heavy down years like 2018 and 2023, the maximum favorable move for shorts came from persistent selling, while the maximum adverse move stayed relatively contained, meaning rallies against the short were brief and shallow. In other years, such as 2017 and 2020, the worst drawdowns from entry reached roughly 9% to 19% against the short before the stock ultimately finished lower, underscoring that the path inside the window can be choppy even when the final outcome favors the seasonal trend.
The cumulative chart compounds those 45-day windows year after year and reaches a 60% gain for the short side over the 2016–2025 period. That steady climb, with only two visible setbacks, is what gives this WDAY seasonal pattern its edge compared with a random slice of the calendar. The pattern is clear: this window has favored shorts in 8 of 10 years, with several double-digit declines that have outweighed the occasional squeeze.
History does not guarantee future results; adverse excursions (MAE) can be large even in winning windows.
Why does Workday, Inc. (WDAY) follow this seasonal pattern?
This early-fall WDAY seasonal pattern may reflect a mix of enterprise budget cycles and the company’s earnings calendar. One likely driver is that large customers often finalize year-end software spending and renewals later in the fall, which can leave September and early October feeling softer for growth expectations. Analysts have also pointed to sector rotation around this time, as investors rebalance between high-multiple software names and other parts of tech, which can amplify downside pressure when sentiment is already fragile.
What is driving Workday, Inc. (WDAY) today?
Workday, Inc. shares closed at $181.27 on Wednesday, down 1.6% on the day and sitting about 27.4% below the 52-week high of $249.85, even after a strong 27.14% gain over the past month. The stock has been digesting a sharp rally that followed a Q1 earnings beat in May, when Workday delivered $2.66 in EPS versus $2.51 expected on revenue of $2.54 billion, up 13.5% year over year, and raised guidance for mid-teens topline growth.[8] That fundamental strength has been colliding with a more cautious tone from the Street, including a July downgrade from Morgan Stanley to Underweight with a cut in its price target to $145 and a fresh Underperform initiation from CLSA at $92, both flagging slowing growth and a widening GAAP versus non-GAAP earnings gap.[2]
Sector and macro currents have added to the crosswinds. Coverage in early August framed Workday as part of a broader enterprise SaaS and AI software cohort, with investors weighing its positioning in agentic AI and integrations against concerns that some AI capabilities could become commoditized over time.[1] At the same time, IBM’s commentary on customers shifting budgets toward AI hardware has raised questions about how much room is left in near-term software spending, a theme that has periodically pressured Workday alongside peers like ServiceNow and Salesforce.[2] On the flows side, MarketBeat reported institutional interest from firms such as Empowered Funds LLC and First Eagle Investment Management earlier this year, while also noting insider sales over the past 90 days and insiders owning roughly 20% of the company, a mix that keeps positioning in focus for the next leg of the move.[8][9]
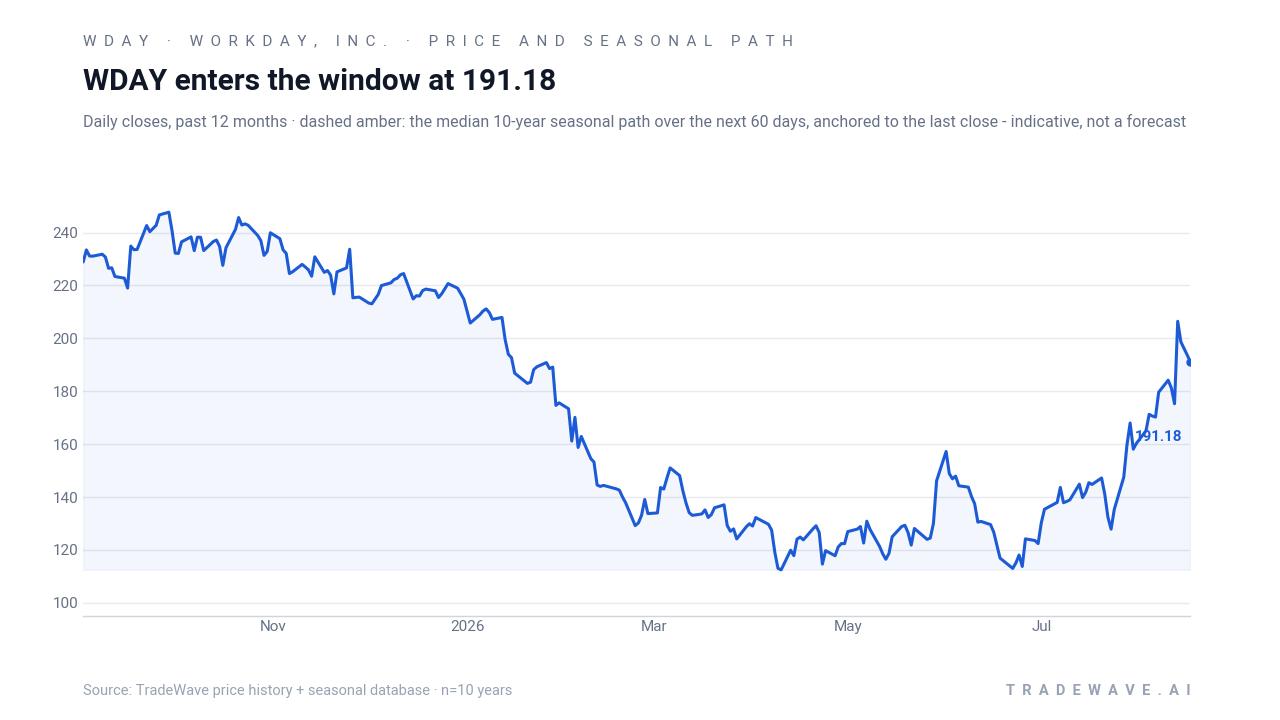
The chart below situates the latest move in its recent multi-month context and overlays the median 10-year seasonal path into the upcoming window.
What should traders watch as the Sep 1–Oct 15 window approaches?
For this year’s window, the first thing to watch is how WDAY behaves as it approaches the $175–$185 band where the seasonal pattern is set to kick in. A decisive break lower into late August would mean the stock enters the window already under pressure, which historically has sometimes preceded the larger down years, while a continued grind higher would raise the odds of a squeeze against the short pattern similar to 2019. Second, any fresh commentary on enterprise software budgets or AI spending from large-cap tech peers could quickly reset expectations for Workday’s growth trajectory, especially given prior concerns about budget shifts toward hardware and mixed sector sentiment.[1][2]
Positioning and insider activity are the other key tells. MarketBeat’s earlier note on insider sales over the last 90 days, alongside institutional buying from firms like First Eagle, suggests that ownership is actively turning over rather than locked in place.[8][9] If insider selling accelerates into late August while the stock stalls below its 52-week high, that would rhyme with prior years where the seasonal short pattern has worked well. If, instead, insider activity cools and incremental institutional demand shows up on down days, it would signal that the market is willing to lean against the historical WDAY seasonal trend. Either way, how price reacts inside the Sep 1–Oct 15 window relative to these signals will tell traders whether this decade-long pattern is still in force or starting to fade.
Sources
- Seeking Alpha – Workday, Inc. (WDAY) Stock Price, Quote, News & Analysis (Aug 8, 2026)
- Yahoo Finance – Why Workday (WDAY) Shares Are Sliding Today (Jul 22, 2026)
- MarketBeat – First Eagle Investment Management LLC Purchases New Position in Workday, Inc. $WDAY (Mar 3, 2026)
- MarketBeat – WDAY Stock Beats Q1 Estimates, Raises Guidance, Eyes 100% Upside (May 23, 2026)
- MarketBeat – Workday, Inc. $WDAY Shares Purchased by Empowered Funds LLC (Jul 30, 2026)
- MarketBeat – WDAY News Today | Why did Workday stock go down today? (Aug 11, 2026)
About this seasonal analysis
Seasonal pattern data is sourced from TradeWave.ai, which analyzes historical price behavior across annual calendar windows going back up to 30 years. Read the full data methodology or the book The 100-Year Pattern by Afshin Moshrefi (2026 edition). Past performance of seasonal patterns does not guarantee future results. This article is for informational purposes only and does not constitute investment advice.