Franklin Resources (BEN) Earnings Momentum Runs Into a 9-of-10 Late-Summer Losing Stretch
Franklin Resources is back in a late-summer window that has historically leaned lower even as the stock rallies in 2026 and rides fresh earnings momentum.
Price as of Aug 12, 2026: $33.59 (last close).

What is the seasonal pattern for Franklin Resources (BEN)?
Franklin Resources has fallen in 9 of 10 years during the Aug 13 to Sep 8 window, with an average 5.68% gain in winning years for the short-side pattern.
- 9 for 10 in this window, with the short-side pattern averaging 5.68% profit in winning years and a 5% average across all years.
- The late-summer window runs from Aug 13 to Sep 8 over the past 10 years and has historically been a weak stretch for BEN’s share price.
- Percent Profitable sits at 90%, with 9 winners and just 1 loser for the short trade direction in this Franklin Resources trading window.
- Avg Profit reflects winners only at 5.68%, while Avg Profit - All, which includes the lone losing year, comes in at 5%.
- The TradeWave Ratio of 2.05 suggests price has typically moved meaningfully in the trade direction within the window, with sizable intraperiod swings.
- Sharpe ratio of 1.31 points to a historically attractive risk-adjusted profile for this BEN seasonal trend, though individual years have seen sharp drawdowns.
According to historical data from TradeWave.ai, this late-summer stretch for Franklin Resources has behaved very differently from an average month on the calendar, and the 2026 iteration is now underway.
How has Franklin Resources (BEN) traded in the Aug 13 to Sep 8 window?
Franklin Resources has closed lower in 9 of the past 10 years during the Aug 13 to Sep 8 window, with the short-side pattern posting an average 5.68% profit in winning years and 5% across all years. Shares enter this year’s window at 33.59, up about 30% year to date and roughly 7.4% below the 52-week high of 36.28.
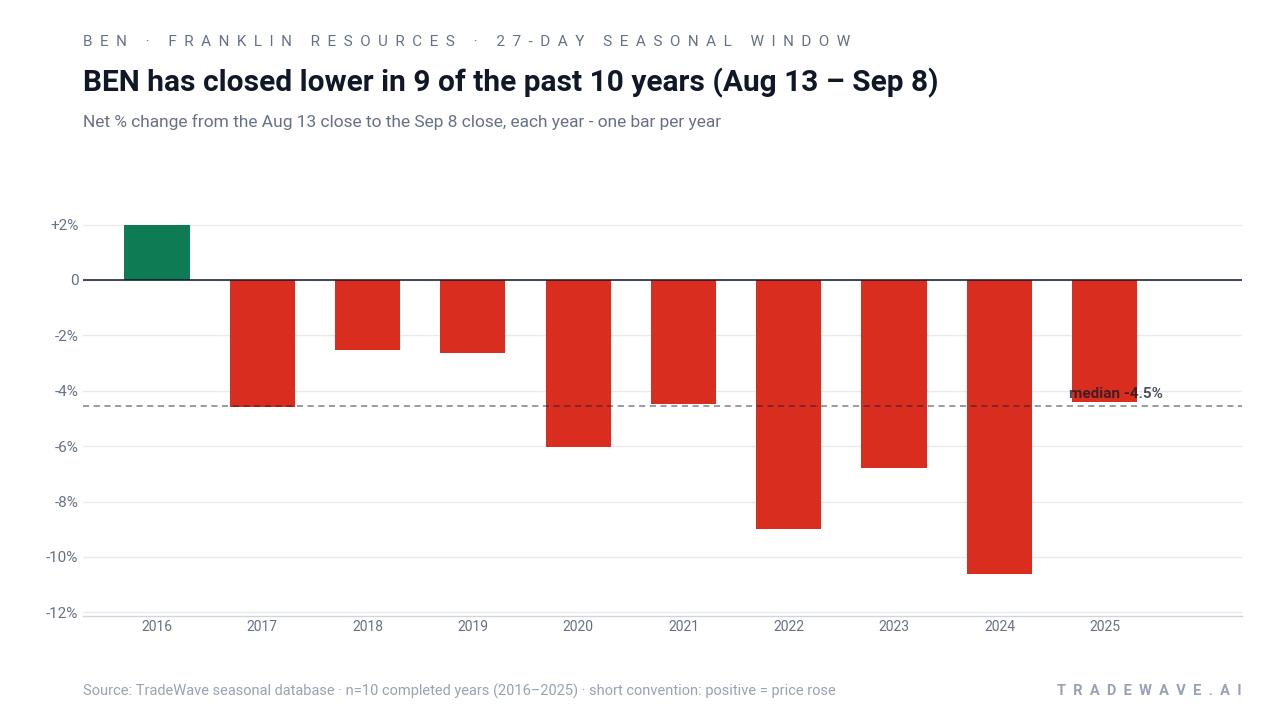
Trade direction for this pattern is short, which means years where BEN’s share price fell over the window were favorable for the strategy, while rallies counted as losing years. Across the 10-year lookback, 9 windows delivered profits for shorts and only 2016 finished higher, producing a 1.97% loss for the pattern. The strongest year for the short side was 2024, when BEN dropped 10.61% between the Aug 13 entry and Sep 8 exit, while the weakest for shorts was that lone 2016 gain.
Average winner profit of 5.68% compares with a 5% average when all years are included, which shows that the single losing year has not been large enough to erase the typical downside drift. Median profit of 4.54% sits slightly below the average, hinting that a few deeper declines, such as 2022’s 8.98% slide and 2024’s double-digit drop, have pulled the mean higher. Annualized, the pattern translates into a 4.86% return for the short strategy over the 27-day span.
The intraperiod path has not been gentle. In 2022, for example, the best move in the trade direction reached 12.93% at one point, while the worst countertrend move within the window was just 0.62%, a profile that heavily favored shorts that year. By contrast, 2018 saw a maximum favorable move of 6.52% for shorts but also a 4.81% intraperiod rally against them, illustrating that even “good” years for the pattern can involve sharp squeezes before the final decline.
Trend metrics show the short-side edge has been persistent rather than front-loaded. The “Trend Short” and “Trend Short1” counts, at 13 and 14 respectively, indicate that in many years the pattern has continued to work deeper into the window instead of delivering all its downside in the first few sessions. That lines up with the per-year record, where several of the larger drops, including 2020 and 2024, unfolded over the full stretch rather than in a single air pocket.
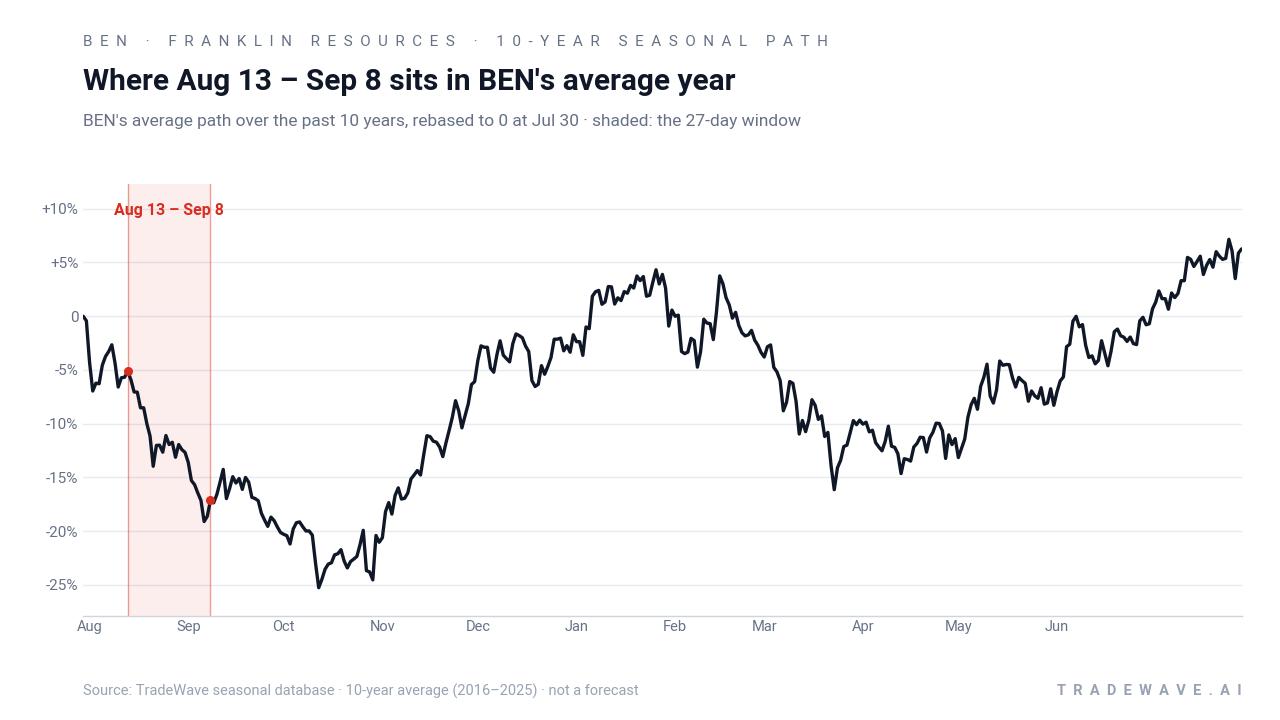
Yearly net and intraperiod swings highlight how often BEN has drifted lower while still delivering sharp countertrend rallies.
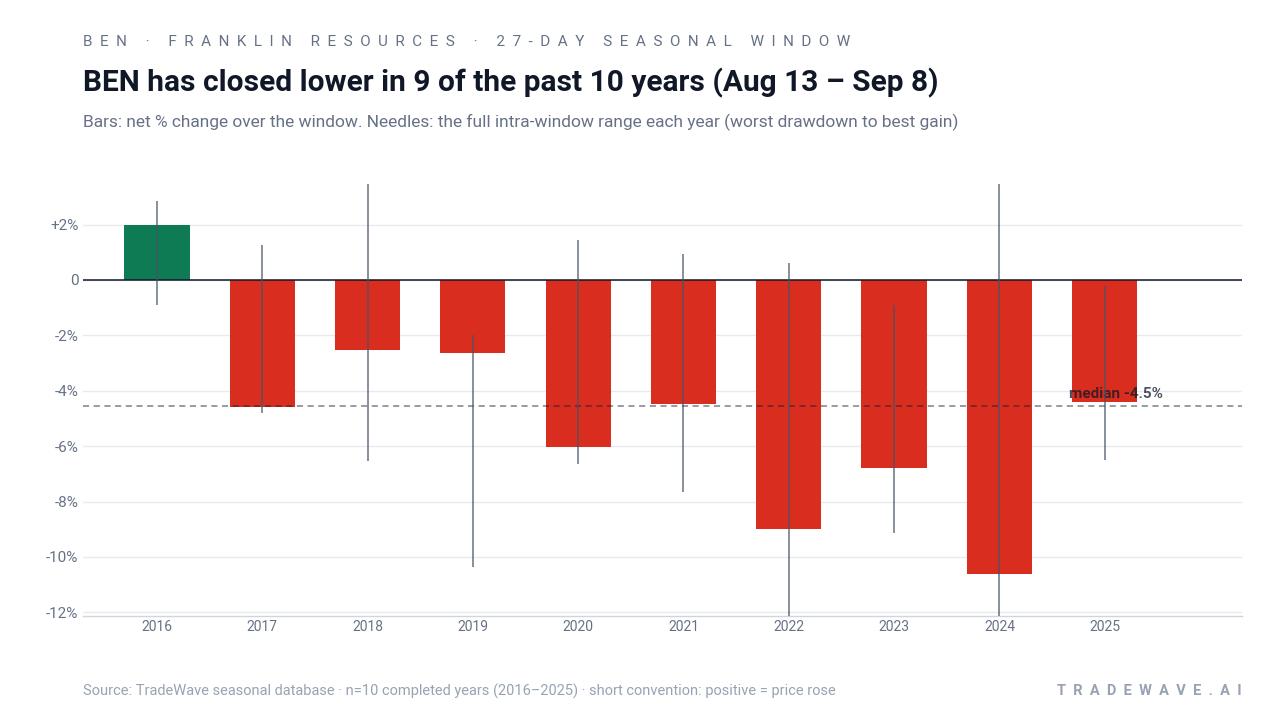
Stacking the window year after year compounds to a 60% cumulative gain for the short strategy across the decade, a striking result for a 27-day slice of the calendar. Nine for ten is the record this window carries into the 2026 cycle.
Why does Franklin Resources (BEN) follow this seasonal pattern?
One likely driver is the way asset managers’ flows and positioning tend to shift late in the summer as institutions rebalance ahead of September and the next leg of the calendar. Analysts have also pointed to earnings timing and guidance resets around this period, which can trigger portfolio rotation out of traditional asset managers and into other financials. For Franklin Resources, that combination of flow seasonality and sector rotation may help explain why this specific August-to-September stretch has so often leaned lower.
History does not guarantee future results; adverse excursions (MAE) can be large even in winning windows.
What is driving Franklin Resources (BEN) today?
Franklin Resources closed Thursday at 33.59, up 0.7% on the day and roughly 30% higher year to date, leaving the stock about 7.4% below its 52-week high of 36.28. The move comes on the heels of a strong fiscal third quarter: on Jul 31, the company reported higher revenue, net income and EPS, including diluted EPS that topped the prior year’s 0.49 baseline, and detailed a $33 million impairment, continued share repurchases, a new $1.50 billion revolving credit facility and a planned rebrand to Franklin Templeton effective Aug 17, 2026.[4][13]
The latest quarter followed earlier upside surprises that prompted analysts to cite upgraded guidance and a more constructive earnings outlook for the asset manager.[3] In late July, SummitTX Capital disclosed a $2.84 million position in Franklin Resources, while other institutional filings in July and early August showed a mix of stake increases and reductions from firms including Royal Bank of Canada, Sumitomo Mitsui Trust Group and Amundi, underscoring active repositioning around the name.[8][9][10][14] Short interest has been referenced at 5.14% in industry comparisons, a level that suggests some investors are still betting against the stock even after the 2026 rally.[12]
Sector-wise, Franklin Resources sits at the center of the global asset management industry, offering equities, fixed income, alternatives, ETFs and multi-asset strategies to institutions and individuals.[1] The firm has been expanding in non-U.S. and emerging markets, with roughly $500 billion of assets under management outside the United States, a push that could support longer-term AUM and revenue growth if global markets cooperate.[2] Valuation commentary earlier in 2026 flagged how the stock’s strong price performance had tightened the margin of safety versus historical multiples, even as earnings momentum improved.[2][5]
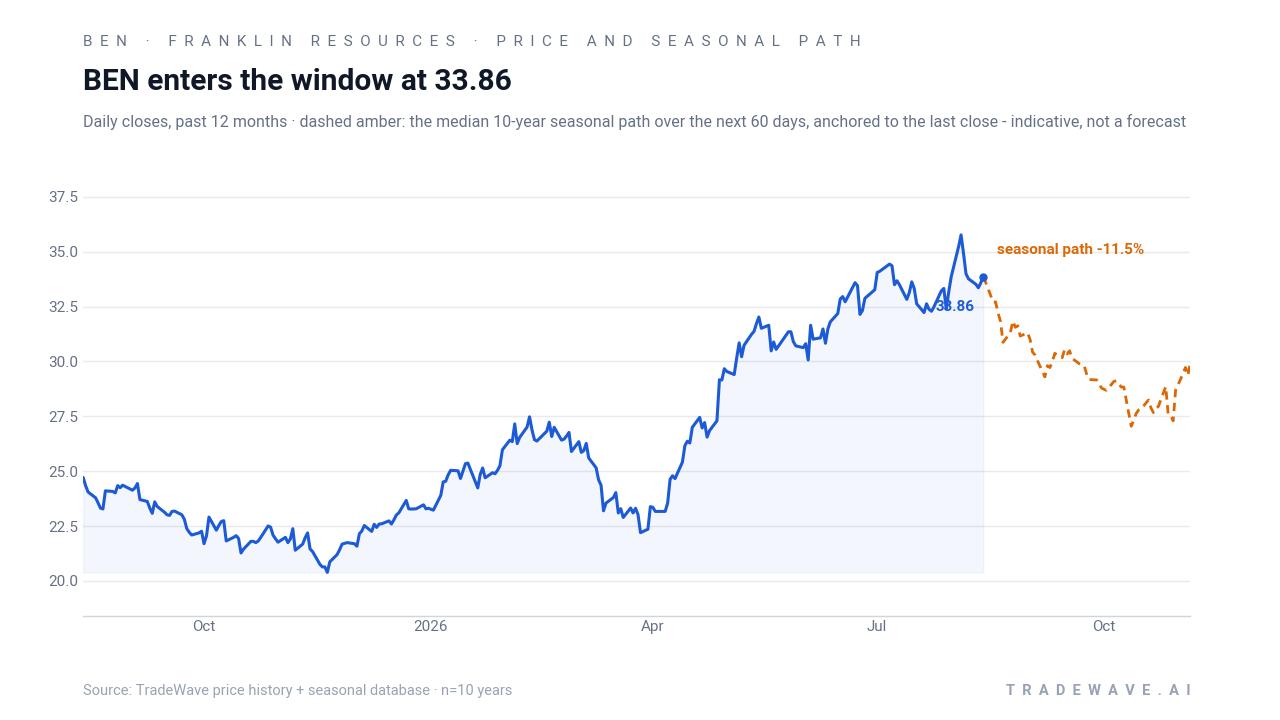
The chart below situates the latest move in its recent multi-month context alongside the typical seasonal path.
What should traders watch in this Franklin Resources (BEN) window?
For the next several weeks, the key test is whether BEN respects its historical late-summer softness or whether 2026 becomes the second clear exception in a decade. Price action around the 52-week high near 36.28 and the recent post-earnings zone in the low-to-mid 30s will matter: a quick rejection from the mid-30s that lines up with the seasonal pattern would fit the 9-for-10 history, while a sustained breakout through the prior high would contradict it.
Earnings follow-through is another focal point. Management’s upgraded tone and the new credit facility give the company more flexibility to pursue growth or capital returns, and any fresh commentary around AUM flows, fee pressure or non-U.S. expansion could either reinforce or offset the seasonal bias.[3][4][13] Traders will also be watching institutional filings and ownership updates for signs that large holders are adding into strength or using the rally to trim exposure, especially after the recent mix of stake increases and reductions from major investors.[8][9][10][14]
Finally, behavior inside the window itself will offer a real-time read on how much weight to give this BEN seasonal trend. A pattern of lower highs and heavier selling on up days would echo prior years where the short-side strategy worked cleanly, while a grind higher on solid volume would signal that the 2026 fundamental backdrop is overpowering the usual late-summer drag. Either way, this is one of the few calendar stretches where Franklin Resources has shown a clear historical tendency, and traders will be watching to see if the 9-for-10 record holds.
Sources
- Barchart via Yahoo Finance, "Franklin Resources Stock: Analyst Estimates & Ratings," May 11, 2026.
- Simply Wall St via Yahoo Finance, "Assessing Franklin Resources (BEN) Valuation After Earnings Beat And Analyst Upgrades," May 4, 2026.
- Barchart via Yahoo Finance, "What to Expect From Franklin Resources’ Next Quarterly Earnings Report," Jul 23, 2026.
- Barchart via Yahoo Finance, "Franklin Resources (BEN) Is Up 7.3% After Strong Q3, Rebrand To Franklin Templeton, New Credit Facility," Aug 6, 2026.
- Simply Wall St via Yahoo Finance, "Assessing Franklin Resources (BEN) Valuation After Strong Recent Share Price Performance," Jun 7, 2026.
- MarketBeat, "SummitTX Capital L.P. Has $2.84 Million Stock Position in Franklin Resources, Inc. $BEN," Jul 29, 2026.
- MarketBeat, "66,901 Shares in Franklin Resources, Inc. $BEN Purchased by Forty three Eighteen Advisors LLC," Jul 18, 2026.
- MarketBeat, "Amundi Sells 526,765 Shares of Franklin Resources, Inc. $BEN," Aug 7, 2026.
- MarketBeat, "Royal Bank of Canada Increases Holdings in Franklin Resources, Inc. $BEN," Aug 6, 2026.
- MarketBeat, "Franklin Resources Q3 Earnings Call Highlights | MarketBeat," Jul 31, 2026.
- MarketBeat, "Sumitomo Mitsui Trust Group Inc. Lowers Stake in Franklin Resources, Inc. $BEN," Jul 15, 2026.
About this seasonal analysis
Seasonal pattern data is sourced from TradeWave.ai, which analyzes historical price behavior across annual calendar windows going back up to 30 years. Read the full data methodology or the book The 100-Year Pattern by Afshin Moshrefi (2026 edition). Past performance of seasonal patterns does not guarantee future results. This article is for informational purposes only and does not constitute investment advice.