Campbell's Company (The) (CPB) Faces Inflation Squeeze as 27-Day Midterm Weak Stretch Nears
Campbell's Company (The) is heading into a late-August seasonal window that has been reliably weak in past midterm election years, just as the stock trades well below its 52-week high and next earnings approach.
Price as of Aug 12, 2026: $22.60 (last close).
What is the seasonal pattern for Campbell's Company (The) (CPB)?
Campbell's Company (The) has fallen in 10 of 10 midterm-year late-August to late-September windows, with an average gain of 4.82% in winning years for short positions.
- 10 for 10 in this window, with short trades averaging 4.82% profit across the last 10 midterm election years.
- The upcoming 27-day trading window runs from Aug 25 to Sep 20 and has historically been a weak stretch for CPB’s share price.
- Percent Profitable is 100%, with 10 winners and 0 losers for the short-side pattern in this midterm-year slice.
- All recorded years delivered profits for shorts, contributing to a compounded 59% cumulative return when the window is stacked over time.
- The TradeWave Ratio of 1.59 signals that CPB’s price has typically moved meaningfully in the trade direction within the window, even before final closes.
- Intraperiod swings have included sizable drawdowns against the trade, so timing and risk control have mattered even in this historically consistent pattern.
According to historical data from TradeWave.ai, this late-August stretch has behaved very differently from an average month for Campbell's Company (The). The next section walks through what that election-cycle pattern has looked like and how it frames the coming weeks.
How has Campbell's Company (The) (CPB) traded in this late-August midterm window?
Campbell's Company (The) has closed lower in every single late-August to late-September window across the last 10 midterm election years, with short trades averaging 4.82% profit and a 100% win rate. Shares finished the prior session at 22.60, leaving the stock about 30.2% below its 52-week high of roughly 32.36 and up 15.49% year to date.[1]
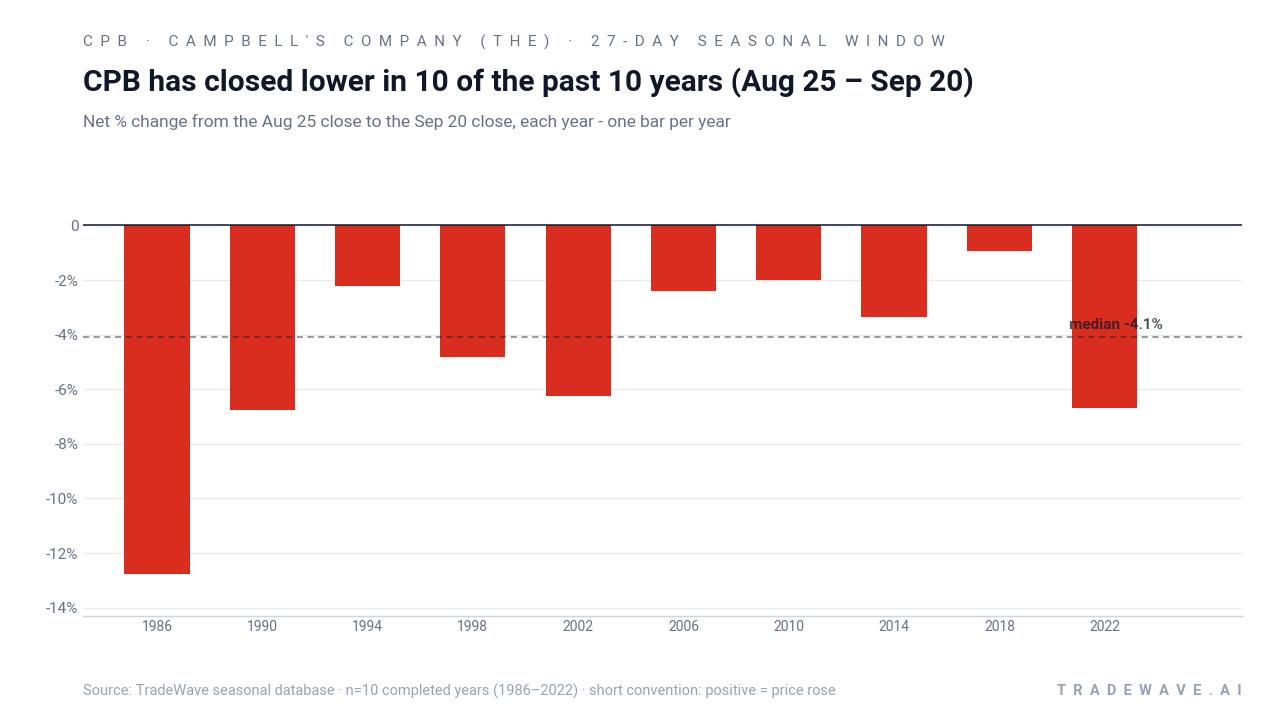
Grouping the data by the presidential election cycle matters here because the current year is a midterm election year, and this 27-day slice sits in the late-summer stretch when Washington’s fiscal debates and rate expectations often collide with thin liquidity. For a packaged foods stock like Campbell's Company (The), that has historically meant a short window where defensive positioning has not fully shielded the name from selling pressure tied to broader risk rotations.
This seasonal window begins on Aug 25 and spans 27 days, and in prior midterm election years it has been a consistently bearish stretch for CPB’s share price. The trade direction is short, and every one of the 10 historical windows finished with the stock lower at the close, which is why the Percent Profitable metric sits at 100% with 10 winners and 0 losers. Average profit of 4.82% reflects the mean gain for those short trades, while the 59% cumulative return figure shows what would have happened if an investor had repeated the same short window across all 10 midterm years and compounded the results.
The per-year breakdown shows that the strongest short years were 1986 and 2022, when CPB fell 12.76% and 6.68% respectively between the Aug 25 entry and Sep 20 exit. Even the “milder” years, such as 2018 with a 0.93% decline, still ended in the black for shorts. That consistency is unusual for a single-stock seasonal pattern and helps explain the relatively high Sharpe ratio of 1.3 for this window.
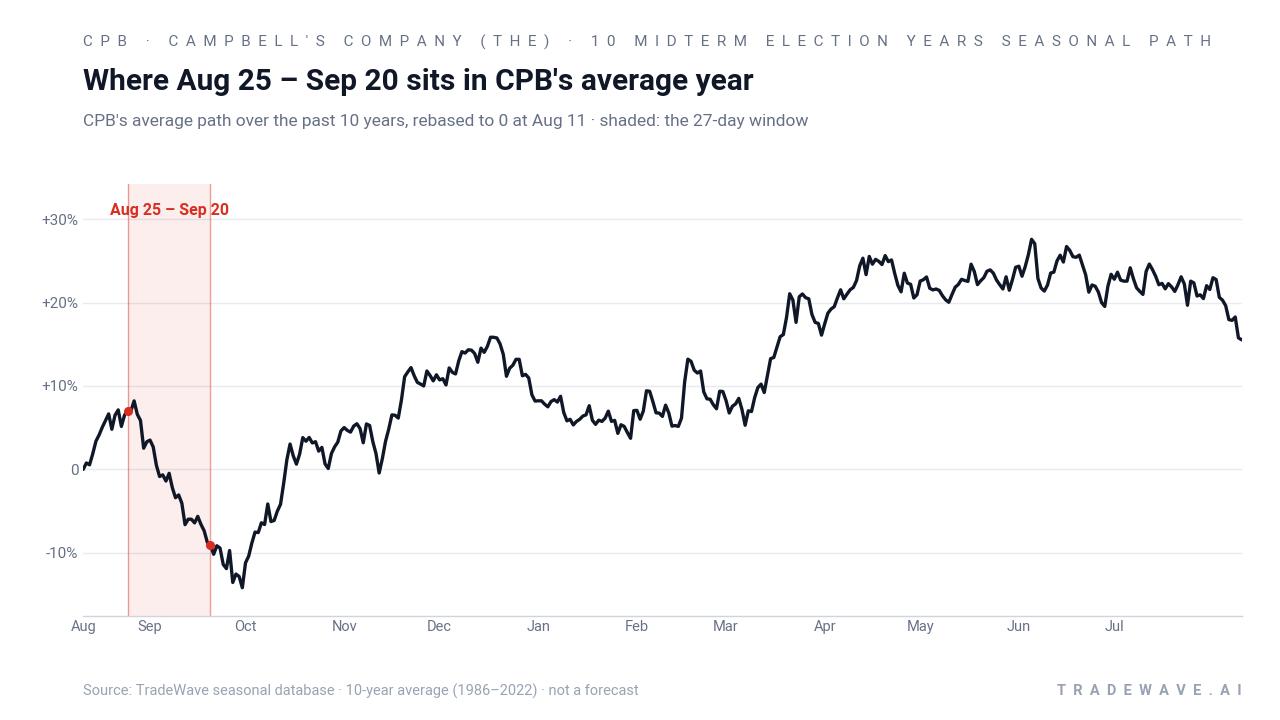
The historical seasonal average trend chart suggests that CPB often drifts sideways into late August before sliding through much of the 27-day window. The weakness is not typically a single air pocket; instead, the average path shows a grind lower that accelerates in the back half of the period, which lines up with several of the larger short winners in the sample.
The next view combines yearly net results with the full intraperiod range, highlighting both opportunity and risk for this short-side pattern.
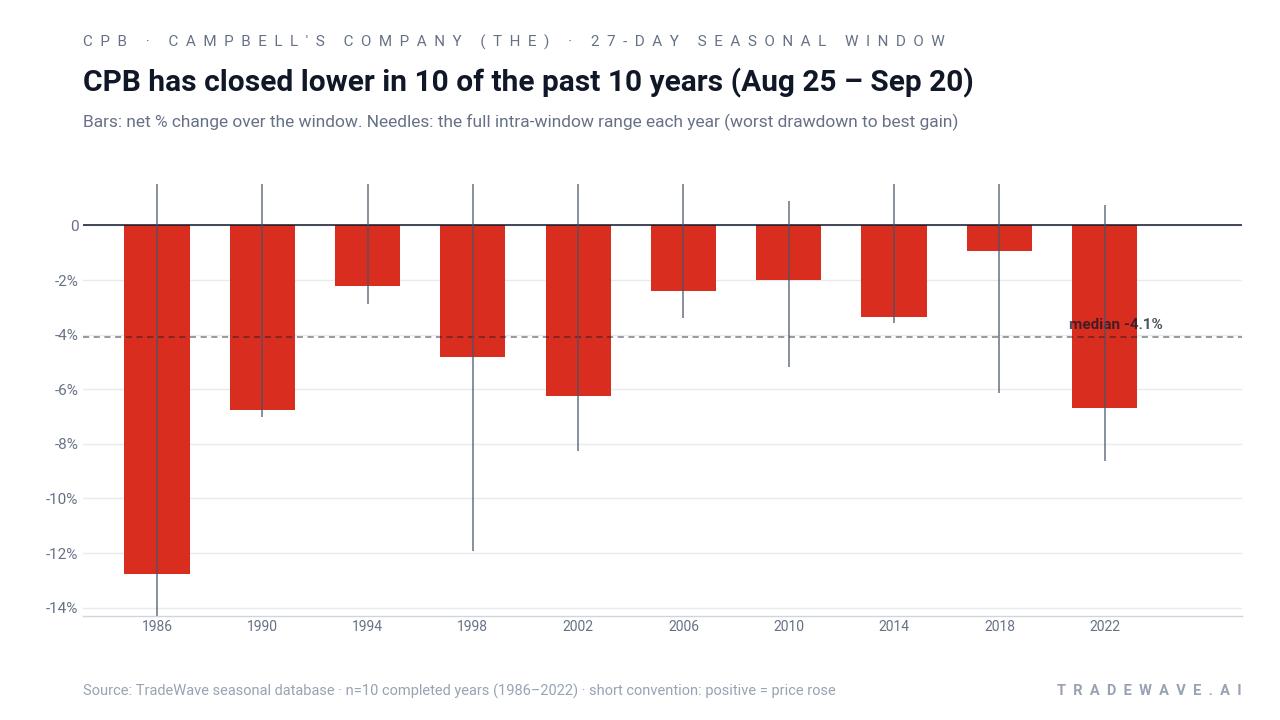
The combined net-return and range chart shows that while every year ended with CPB lower, the path was not a straight line. Maximum favorable excursions for shorts, which are the best point-to-trough moves within the window, reached double digits in years like 1986 and 1998, but maximum adverse excursions, the worst drawdowns against the short, also stretched to several percentage points in many cases. That mix of sizable MFE and meaningful MAE is what the TradeWave Ratio of 1.59 is capturing: CPB has tended to move far enough in the trade direction to make the window attractive for shorts, but not without interim squeezes.
The bottom line is simple: 10 for 10. In the last 10 midterm election years, this specific Aug 25 to Sep 20 window has always finished with CPB lower, and the average short-side gain has been meaningful rather than marginal.
Why does Campbell's Company (The) (CPB) follow this seasonal pattern?
This pattern may reflect a mix of midterm-year policy uncertainty and consumer-spending seasonality. One likely driver is that late August and early September sit between summer promotions and the full ramp of fall and holiday merchandising, a softer demand period that can weigh on packaged foods sentiment. Analysts have also pointed to inflation and production-cost pressures on margins in recent years,[5] which can make investors more sensitive to any guidance tweaks or macro headlines that land in this window.
History does not guarantee future results, and even in a 100% profitable sample, adverse excursions within the window have at times been large enough to challenge poorly timed positions.
What is driving Campbell's Company (The) (CPB) today?
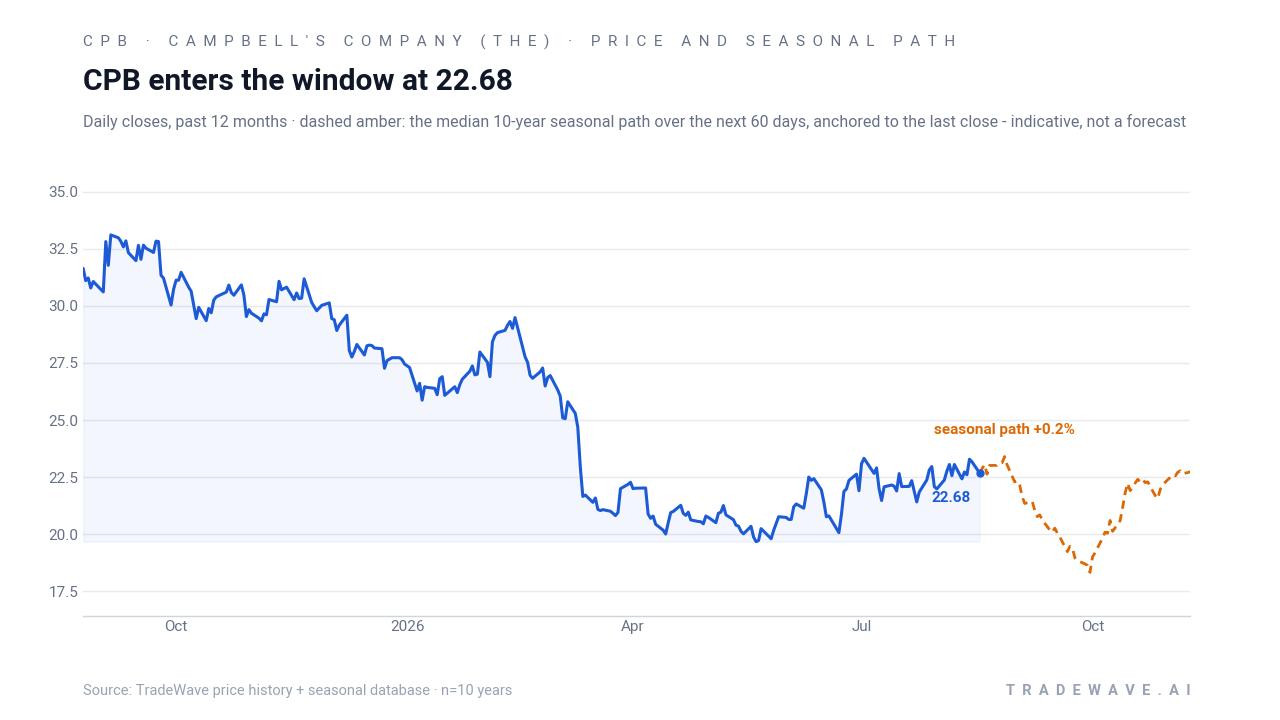
CPB last traded at 22.60, down 0.53% on the day, after moving between 22.22 and 22.70 in the prior session on volume of about 4.0 million shares, versus a 20-day average near 5.45 million. The stock is up 15.49% year to date but still sits well below its 52-week high near 32.36 and only modestly above its 52-week low around 18.92, with the 50-day moving average at roughly 21.85 providing a nearby reference level.[1]
Fundamentally, investors are weighing a mixed earnings picture against a still-cautious analyst stance. On Jun 8, Campbell's reported quarterly EPS of $0.50, beating the $0.48 consensus, on revenue of about $2.37 billion, but organic sales fell roughly 4% year over year as both Meals & Beverages and Snacks volumes declined 4%.[2] A separate summary of the same quarter highlighted that the EPS beat came alongside category softness, reinforcing concerns that pricing rather than volume has been doing the heavy lifting.[7]
Looking ahead, the next earnings report is scheduled for Sep 9, with management’s fiscal 2026 guidance pointing to EPS in a range that has been reported between $22.22 and $22.70 in one MarketBeat summary and $2.40 to $2.55 on an adjusted basis in an earlier article, underscoring some confusion around the exact framing of targets.[2] MarketBeat’s aggregation shows a consensus “Reduce” rating and a consensus price target around $22.00, slightly below where the stock currently trades, suggesting that many covering analysts still see limited upside at today’s valuation.[3]
Institutional positioning has been active into this backdrop. Filings in late July and early August showed firms such as Gamco Investors, Saba Capital Management and Amundi adjusting their stakes in Campbell's Company (The), with some increasing exposure and others trimming positions, a sign that professional investors are far from unanimous on the stock’s risk-reward profile at current levels.[3][9][10] In April, a Yahoo Finance analysis noted that CPB had suffered a roughly 41% share-price slide over the prior year, prompting a reassessment of valuation and fair value scenarios for the name.[6]
Macro and credit factors are also in the mix. Earlier this year, coverage pointed to significant inflationary pressures and rising production costs weighing on margins and the EPS outlook for Campbell's Company (The), a common theme across the packaged foods sector as input prices and labor costs stayed elevated.[5] A separate report highlighted that Fitch had downgraded the company’s long-term debt rating to “BBB-,” citing sustained high leverage and a projected EBITDA decline for fiscal 2026, which keeps balance-sheet flexibility on investors’ radar.[5]
The chart below situates the latest move in its recent multi-month context and overlays the median seasonal path for the next 60 days.
What should traders watch as this CPB seasonal window approaches?
First, the calendar: the 27-day midterm-year window opens on Aug 25 and runs through Sep 20, overlapping the Sep 9 earnings date. How CPB trades around that report, especially if guidance shifts against a backdrop of inflation and leverage concerns, will be a key test of whether the historical late-summer weakness repeats.[2][5]
Second, levels matter. On the upside, the 50-day moving average near 21.85 and the low-20s band that has acted as a recent floor are important reference points; sustained breaks below that zone during the window would rhyme with prior midterm-year patterns, while a firm hold or rally through it would mark a clear departure.[1]
Third, watch liquidity and volume. Past commentary has noted that trading volume in CPB ramped as the stock slid to multi-decade lows between 2024 and 2026, suggesting that big moves have tended to come with heavier activity.[8] If volume swells again as the window opens, it would signal that institutions are leaning into the move rather than fading it.
Finally, the historical pattern itself offers a simple scoreboard. If CPB spends most of the Aug 25 to Sep 20 stretch grinding lower or failing to hold intraday rallies, that would be consistent with the 10-for-10 short-side record. A decisive break from that script, especially if driven by a stronger-than-expected earnings update or a shift in macro tone, would tell traders that this midterm-year window is starting to behave differently from the past decade of data.
Sources
- Yahoo Finance: The Campbell's Company (CPB) Stock Price, News, Quote & History (Aug 12, 2026).
- MarketBeat: Campbell's (NASDAQ:CPB) Stock Price Expected to Rise, Stifel Nicolaus Analyst Says (Jul 22, 2026).
- MarketBeat: The Campbell's Company $CPB Shares Purchased by Gamco Investors INC. ET AL (Jul 26, 2026).
- MarketBeat: Assetmark Inc. Decreases Stock Position in The Campbell's Company $CPB (Jul 28, 2026).
- Yahoo Finance: Campbell's (CPB) Stock Trades Down, Here Is Why (Jan 16, 2026).
- Yahoo Finance: Is It Time To Reassess Campbell Soup (CPB) After A 41% One Year Share Price Slide (Apr 23, 2026).
- Yahoo Finance: William Blair Highlights The Campbell’s Company (CPB)’s Stable Growth Strategy (Jul 14, 2026).
- MarketBeat: CPB Stock Offers Deep Value and a 7% Dividend Yield (Jun 9, 2026).
- MarketBeat: Saba Capital Management L.P. Grows Holdings in The Campbell's Company $CPB (Jul 28, 2026).
- MarketBeat: Amundi Increases Stock Position in The Campbell's Company $CPB (Aug 5, 2026).
About this seasonal analysis
Seasonal pattern data is sourced from TradeWave.ai, which analyzes historical price behavior across annual calendar windows going back up to 30 years. Read the full data methodology or the book The 100-Year Pattern by Afshin Moshrefi (2026 edition). Past performance of seasonal patterns does not guarantee future results. This article is for informational purposes only and does not constitute investment advice.